CITATION
SPURS-2 Planning Group. 2015. From salty to fresh—Salinity Processes in the Upper-ocean Regional Study-2 (SPURS-2): Diagnosing the physics of a rainfall- dominated salinity minimum. Oceanography 28(1):150–159, http://dx.doi.org/10.5670/
oceanog.2015.15.
DOI
http://dx.doi.org/10.5670/oceanog.2015.15
COPYRIGHT
This article has been published in Oceanography, Volume 28, Number 1, a quarterly journal of The Oceanography Society. Copyright 2015 by The Oceanography Society.
All rights reserved.
USAGE
Permission is granted to copy this article for use in teaching and research.
Republication, systematic reproduction, or collective redistribution of any portion of this article by photocopy machine, reposting, or other means is permitted only with the approval of The Oceanography Society. Send all correspondence to: [email protected] or The Oceanography Society, PO Box 1931, Rockville, MD 20849-1931, USA.
OceanographyTHE OFFICIAL MAGAZINE OF THE OCEANOGRAPHY SOCIETY
DOWNLOADED FROM HTTP://WWW.TOS.ORG/OCEANOGRAPHY
Oceanography | Vol.28, No.1 150
Salinity Processes in the Upper-ocean Regional Study-2 (SPURS-2)
Salinity Processes in the Upper-ocean Regional Study
Diagnosing the Physics of a Rainfall-Dominated Salinity Minimum
From Salty
to Fresh
Oceanography | Vol.28, No.1 150
By the SPURS-2 Planning Group
exchange in the hydrological cycle. In addition to air-sea water exchange, oce- anic advection and mixing fundamen- tally affect SSS. “Oceanic advection and mixing” is a term that encompasses all of ocean dynamics, from large-scale sub- duction of surface waters beneath adja- cent water masses to eddy transports and centimeter-scale turbulence, and many of these physical processes will influence SSS at different times and places.
The field program, Salinity Processes in the Upper-ocean Regional Study (SPURS), was specifically designed to examine those processes affecting near-surface salinity. SPURS was envi- sioned as a two-phase effort, with the first phase focusing on the salinity maximum of the North Atlantic during 2012–2013 (SPURS-1). This paper describes the rationale behind the proposed sec- ond phase field effort in the low- salinity region of the eastern tropical Pacific (SPURS-2). Some of the largest rainfall rates on the planet drive the low salinities in this area (Figure 1).
Mid-latitude evaporation regions that supply moisture to both high- and low-latitude precipitation- dominated regions characterize the global water
cycle. Within this context, SPURS focuses on both source and sink regions for ocean salinity and atmospheric fresh- water. Because the latent heat of evapo- ration represents the largest term in the transfer of energy from ocean to atmo- sphere (Stephens et al., 2012), regions of net evaporation must be exporting energy to other places; regions of net precipitation are areas where the atmo- sphere has imported and used that latent heat energy to drive convective motions.
That is, when evaporation and precipita- tion are locally balanced, then the latent heat energy from the ocean drives local convection. However, when evaporation dominates, energy is exported; when pre- cipitation dominates, energy has been imported from other regions. SPURS-1 focused on a subtropical high-pressure region where dry, sinking, and diver- gent atmospheric circulation, with its associated wind-stress curl field, drives a convergent Ekman transport, and sub- ducting oceanic circulation is character- ized by high salinity. In such regions, the ocean is exporting latent heat energy at a rate of ~75 W m–2 for every meter per year of net evaporation. Insights into the ocean dynamics and mixing pro- cesses there are readily transferable to the other subtropical gyres. The overall goal of SPURS-2 is to improve understand- ing of the physical processes that influ- ence upper-ocean salinity and SSS in a precipitation-dominated regime with net freshwater and buoyancy fluxes into the ocean. For the atmosphere, this region is consuming latent heat energy sup- plied by other parts of the ocean. The region chosen for SPURS-2 lies under the Intertropical Convergence Zone (ITCZ) in the eastern tropical Pacific, where the intensity of surface water flux is largest in boreal summer.
Table 1 summarizes some of the con- trasts in the environments and processes INTRODUCTION
One of the most important issues facing society is how the water cycle may change in the future. The exponential increase in the vapor-carrying capacity of the atmosphere with increasing temperature means that changes could be severe, with a tendency for dry areas to get dryer and wet areas to get wetter (Durack, 2015, in this issue). The distribution of rainfall and drought is arguably the single most soci- etally relevant aspect of climate change.
Because sea surface salinity (SSS) is influ- enced by the evaporation that fuels atmo- spheric convection and the precipitation that removes water from the atmosphere, it is a key indicator of water exchange between the atmosphere and the ocean.
The global database of SSS observations is rapidly expanding now as a result of new satellite measurement capabilities—
the US National Aeronautics and Space Administration’s Aquarius and the European Space Agency’s Soil Moisture Ocean Salinity (SMOS) missions—and other enhancements to the global observ- ing system such as the Argo float array.
However, improved understanding of the processes modulating SSS is critical to the use of SSS as an indicator of air-sea
ABSTRACT. One of the notable features of the global ocean is that the salinity of the North Atlantic is about 1 psu higher than that of the North Pacific. This contrast is thought to be due to one of the large asymmetries in the global water cycle: the transport of water vapor by the trade winds across Central America and the lack of any comparable transport into the Atlantic from the Sahara Desert. Net evaporation serves to maintain high Atlantic salinities, and net precipitation lowers those in the Pacific. Because the effects on upper-ocean physics are markedly different in the evaporating and precipitating regimes, the next phase of research in the Salinity Processes in the Upper-ocean Regional Study (SPURS) must address a high rainfall region. It seemed especially appropriate to focus on the eastern tropical Pacific that is freshened by the water vapor carried from the Atlantic. In a sense, the SPURS-2 Pacific region will be looking at the downstream fate of the freshwater carried out of the SPURS-1 North Atlantic region. Rainfall tends to lower surface density and thus inhibit vertical mixing, leading to quite different physical structure and dynamics in the upper ocean. Here, we discuss the motivations for the location of SPURS-2 and the scientific questions we hope to address.
Oceanography | Vol.28, No.1 152
Also, the basic downwelling and subduct- ing regime of the salinity maxima and the upwelling and obducting regime of the ITCZ lead to dramatically different thermocline depths.
The fundamental differences in how evaporation and precipitation affect ocean stratification and mixing are highly relevant to interpreting and understand- ing the long-term trends in ocean salin- ity that show the salty regions becoming saltier and the fresh regions becoming fresher (e.g., Durack and Wijffels, 2010).
In the precipitation-dominated tropi- cal regions, where SSS is freshening on decadal time scales, it is possible that the oceanic and atmospheric dynamics could reinforce one another with a posi- tive feedback: enhanced precipitation can contribute to reduced vertical mixing in the upper ocean, which can contribute to warmer sea surface temperatures (SSTs) that can in turn contribute to enhanced atmospheric convection and precipita- tion. In contrast, increased evaporation and SSS could lead to greater vertical heat and moisture transfers in both ocean and atmosphere, conditions favoring further evaporation. These distinctions highlight the very different large-scale and small- scale physics of the evaporation and pre- cipitation regimes. Measuring and mod- eling the ocean’s response to surface water fluxes of both signs is the central goal of the SPURS field programs.
Siting SPURS-2
SPURS-1 was designed to allow gener- alization to the salinity maxima of other subtropical gyres, and SPURS-2 should have similarly wide applicability. Thus, planning has evolved so that the pre- ferred site is representative of the open- ocean ITCZ regime, rather than one dominated by riverine inputs and other coastal processes. The region around 10°N, 125°W was discussed as a nomi- nal site for SPURS-2 at a SPURS work- shop in April 2014, in part because of prior knowledge of the area and exist- ing monitoring arrays there, in partic- ular, the TAO (Tropical Atmosphere
GPCP mean precip (mm day–1)
0 2 4 6 8 10
0°E 50°E 100°E 150°E 160°W 110°W 60°W 10°W
50°S 0°
50°N
FIGURE 1. Mean daily precipitation rate from the Global Precipitation Climatology Project (GPCP) for the period 1979–present (Adler et al., 2003). The nominal locations of SPURS-1 (25°N, 38°W in the Atlantic) and SPURS-2 (10°N, 125°W in the Pacific) are indicated by white dots.
TABLE 1. Characteristics of SPURS-1 and SPURS-2 study sites.
SPURS-1 SPURS-2
Convergent ocean (subducting) Divergent atmosphere
Divergent ocean (upwelling) Convergent atmosphere
Salinity maximum Salinity minimum
Evaporation dominated Buoyancy loss Precipitation dominated Buoyancy gain Deep mixed layer and thermocline Shallow mixed layer and thermocline
Weak mean advection Strong mean advection
Small annual cycle Large annual cycle
Poleward limit of tropical-subtropical cell Equatorward limit of tropical-subtropical cell In the saltiest ocean basin, North Atlantic In the freshest ocean basin, North Pacific Positive long-term salinity trend Negative long-term salinity trend
targeted in each phase of SPURS. While most of these contrasts relate to the basic structure of oceanic tropical- subtropical circulation, there is also an attempt to exploit one of the significant asymme- tries of the global water cycle: the con- trast between the salty North Atlantic as a net evaporation basin and the fresh North Pacific as a net precipita- tion basin (Figure 2). This difference is generally attributed to the narrow- ness and more land-surrounded nature of the North Atlantic (Schmitt, 2008) and the ready transport of moisture in the trade winds from the Atlantic to the Pacific across narrow Central America (Broecker et al., 1990). SPURS-1 can be thought of a source region for the water
that is freshening the SPURS-2 region, though individual water molecules do not travel that far in one evaporation/
precipitation cycle.
Different Physics
A key to understanding the differences between an evaporation-dominated regime and a precipitation-dominated regime is the opposite sign of the buoy- ancy flux. Evaporation leaves salt behind and therefore increases the den- sity of near-surface waters, enhanc- ing vertical mixing and deepening the mixed layer. Precipitation freshens sur- face waters and enhances stratifica- tion, which tends to limit vertical mix- ing and leads to a shallower mixed layer.
Ocean) line to the south along 125°W.
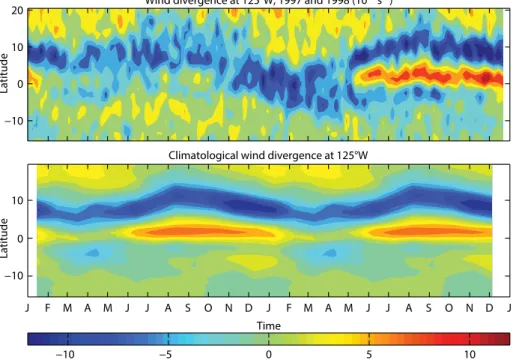
The existing TAO infrastructure will be essential for placing the limited-duration SPURS-2 project into a longer-term con- text with respect to the El Niño-Southern Oscillation. Figure 3 shows the climatol- ogy of surface wind divergence at 125°W.
The latitude of 10°N is near the sum- mer northward excursion of the ITCZ, assuring a strong seasonal cycle in rain- fall. Such temporal variability in fresh- water forcing will aid in discerning those processes that are most depen- dent on rainfall.
The SPURS-2 experiment will focus on the region of low SSS found in the eastern Pacific ITCZ region (Figure 4). SPURS-2 is motivated by scientific questions and a need to better understand physical pro- cesses that involve scales ranging from centimeter-scale freshwater layers result- ing from rainfall to the planetary scale of the tropical Pacific. Thus, SPURS-2 sci- entific investigations cannot be limited to a particular point on the map. Like SPURS-1, SPURS-2 will adopt a nested sampling strategy, with intensive sam- pling of a central region around 10°N, 125°W. The nested sampling is intended to observe the upper ocean in a cas- cading series of horizontal scales from meters to thousands of kilometers. The largest scales will be observed using data from the existing global observing array: Aquarius, SMOS, TAO/TRITON (Triangle Trans-Ocean buoy Network) moorings, Volunteer Observing Ships (VOS) observations, Argo floats, drifters, and other platforms. The SPURS-2 field program is planned for summer 2016 through summer 2017 so that two rain- fall periods can be sampled.
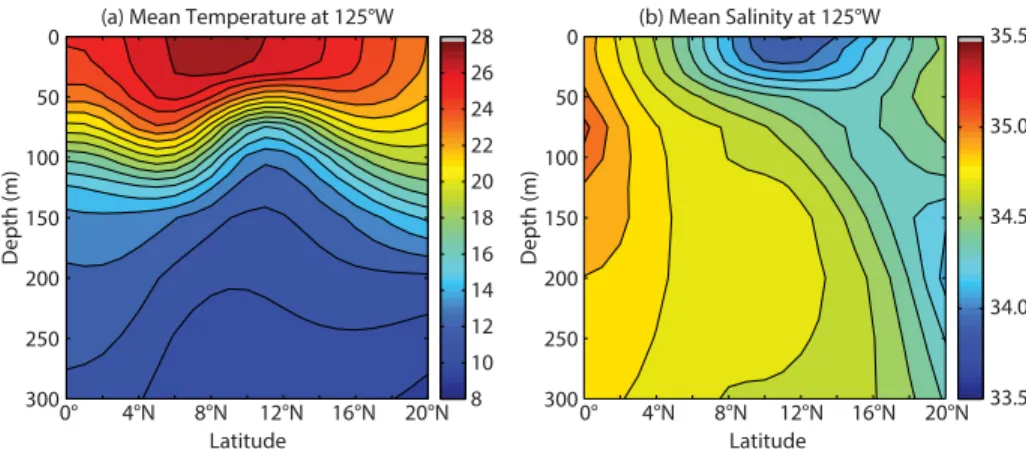
We can draw on climatological data to highlight the important features of the proposed site of the SPURS-2 field- work. The World Ocean Atlas 2009 cli- matology (Figure 5) shows the shape of the thermocline, more or less determined by the depth of the 20°C isotherm. The thermocline is the signature of the zonal current systems in this region, the South Equatorial Current (SEC) south of 5°N,
the North Equatorial Countercurrent (NECC) between 5° and 10°N, and the North Equatorial Current (NEC) north of that. The thermocline reaches a mini- mum depth, as shallow as 50 m, around 10°–11°N. At that latitude, the shallow surface freshwater pool that is the sub- ject of SPURS-2 can be seen. Note that the meridional surface salinity mini- mum is at 12°N in this climatology, and
that the maximum surface temperature is located at around 8°N. Also note that the maximum rainfall (Figure 4b) occurs at 8°N. These offsets highlight the indi- rect nature of the relationship between air-sea interaction and SSS. Ocean pro- cesses of advection and mixing as much as air-sea interaction determine the loca- tion and magnitude of the meridional SSS minimum.
SSS (psu)
0°E 50°E 100°E 150°E 160°W 110°W 60°W 10°W
50°S 0°
50°N
30 31 32 33 34 35 36 37 38
FIGURE 2. Mean sea surface salinity (SSS) from Aquarius during 2012–2013. The eastern tropical Pacific has some of the lowest salinities in the tropics and contrasts strongly with the high salinity of the SPURS-1 region in the North Atlantic (indicated by a white dot near 25°N, 38°W).
−10 −5 0 5 10
−10 0 10
20 Wind divergence at 125°W, 1997 and 1998 (10–6 s–1)
Latitude
−10 0 10
Latitude
J F M A M J J A S O N D J F M A M J J A S O N D J
Climatological wind divergence at 125°W
Time
FIGURE 3. Latitude-time plot of climatological wind divergence at 125°W estimated from the IFREMER Earth Remote Sensing (ERS) satellite scatterometer wind product. The band of wind con- vergence (negative divergence) is a measure of the location of the Intertropical Convergence Zone (ITCZ). Units are 10–6 s–1. From Farrar (2003)
Oceanography | Vol.28, No.1 154
SPURS-2 SCIENTIFIC QUESTIONS The overall goal of the SPURS-2 field pro- gram is to understand the structure and variability of upper-ocean salinity under the ITCZ. The Pacific ITCZ, with its fre- quent, heavy rainfall, is a major source of freshwater. Ultimately, this freshwater input contributes to the large-scale pat- tern of low SSS in the eastern tropical Pacific, but the initial input of freshwater is in “puddles” on the ocean surface with horizontal scales ranging from rain cells up to the atmospheric mesoscale.
Several key scientific questions for the SPURS-2 field program can be identified:
• Where does the freshwater go? In other words, how does the ocean integrate the freshwater forcing and destroy the salinity variance created at the sur- face? By what oceanic processes is the freshwater transformed from shallow, patchy “puddles” of freshwater into the
large-scale mean distribution of salin- ity that makes up the Eastern Pacific Fresh Pool?
• What impact will this horizontal and vertical variability have on the per- formance of satellite-based measure- ments of SSS?
• What are the local and non-local effects of the freshwater flux on the ocean?
• How does the ocean SSS impact the feedbacks on the atmosphere?
These general issues frame the interests of SPURS-2. More specifically, the program is expected to focus on certain physical processes, such as the following.
1. Barrier layers and the role of salinity in upper-ocean stratification In high-precipitation regions, the vertical structure of salinity can be more import- ant than that of temperature in setting
upper-ocean stratification and mixed- layer depth. When the salinity stratifica- tion sets the base of the mixed layer, and the thermocline is at some deeper level, the resulting region between the mixed- layer base and the thermocline is called a
“barrier layer” (Godfrey and Lindstrom, 1987; de Boyer Montegut et al., 2007).
The “barrier layer” label is used because strong salinity stratification and weak temperature stratification at the mixed- layer base make it difficult for mixed- layer entrainment to cool the mixed layer and SSTs. By the same token, the exis- tence of a barrier layer provides favor- able conditions for mixed-layer entrain- ment to increase SSS if winds are strong enough (because, by definition, salin- ity is larger beneath the mixed layer in a barrier-layer situation).
Barrier layers are commonly found in the tropical ocean beneath the ITCZ (Mignot et al., 2007), and they are typi- cally present for about half of the year near 10°N, 125°W in the eastern Pacific (de Boyer Montegut et al., 2007). The persistent 5–10 m thick barrier layers observed by de Boyer Montegut et al.
(2007) in the eastern Pacific ITCZ region are relatively thin in comparison to those in the western Pacific and Atlantic Oceans and the Bay of Bengal.
The climatological significance of the eastern Pacific barrier layers and how they contrast with those in other areas are central concerns. In this regard, the Office of Naval Research program Air- Sea Interactions in the northern Indian Ocean – Regional Initiative (ASIRI) will provide a useful contrast with an area where strong river runoff in the Bay of Bengal influences the barrier layer, as well as observational guidance for SPURS-2. A related fundamental inter- est is in understanding how salinity stratification affects upper-ocean tem- perature (and hence air-sea interaction) beneath the eastern Pacific ITCZ, par- ticularly in the SST maximum at about 8oN (Figure 5).
SSS (psu)
30 31 32 33 34 35 36 37 38
120°E 140°E 160°E 180°E 160°W 140°W 120°W 100°W 80°W
120°E 140°E 160°E 180°E 160°W 140°W 120°W 100°W 80°W 20°S
0°
20°N
Nominal SPURS−2 central site
a
b
TAO/TRITON moorings
GPCP precip, Aug 2013 (mm day–1)
0 4 8 12 16 20 24
20°S 0°
20°N
FIGURE 4. (upper panel) Aquarius sea surface salinity (SSS) from August 2013 (colored contours).
(lower panel) GPCP precipitation for August 2013 (colored contours). The red squares mark TAO/
TRITON mooring sites, and the white dot at 10°N, 125°W marks the nominal location of the SPURS-2 central site. The box delineates a broader SPURS-2 region.
2. Surface fluxes
Evaporation and precipitation, the pri- mary contributions to surface freshwater flux, are expected to exert an important influence on the evolution of SSS on both the short time scale of rain events and on longer time scales (e.g., seasonal). These measurements will thus be important for SPURS-2. Precipitation measurements pose special sampling challenges.
Satellite precipitation products will play an important role in SPURS-2.
These products have matured greatly in recent years (e.g., the Tropical Rainfall Measuring Mission [TRMM]) and have recently been improved with the suc- cessful launch of the Global Precipitation Measurement (GPM) mission. In situ methods for measuring rainfall will also be valuable, including point measure- ments from surface buoys and acoustic techniques that provide an area-averaged estimate of rainfall. Ship-based precipita- tion radars would be of value, and inves- tigators are encouraged to pursue designs for them because SPURS-2 will provide an exceptional research opportunity.
In addition to surface freshwater fluxes, measurements of surface heat and momentum fluxes are required in order to understand and interpret the evolution of the surface layer and SSS. For example, surface buoyancy fluxes are often (but not always) dominated by surface heat fluxes, and mixed-layer entrainment is often driven by surface momentum fluxes.
3. Ocean/atmosphere Ekman layer coupling
As noted in Table 1, the ITCZ regime is one of convergence in the atmosphere and divergence in the ocean. The ris- ing air drops its moisture as precipita- tion that freshens the upwelling ocean.
The upwelled waters are saltier and have generally arrived in the tropics years after subducting in the subtropical gyres. This area is the tropical terminus of the shal- low tropical-subtropical overturning cell that provides much of the low- latitude oceanic heat flux. Understanding this system is a central goal for SPURS-2.
Many questions arise, such as: Why is the salinity minimum north of the rain- fall maximum? How do the north equa- torial currents and counter-currents influence the salinity budget and space- time structure of the salinity minimum?
How close/different is the eastern Pacific ITCZ regime to/from other precipitation- dominated tropical regions (e.g., in the western and central Pacific, the Indian Ocean, and in the far-eastern Pacific)?
4. Salinity fronts and rainfall-induced
“fresh pools”
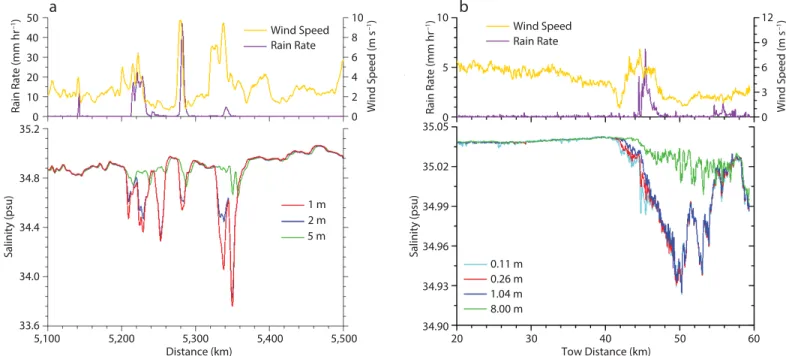
The intermittency and spatial distribution of rainfall in the tropics leads to regions of low-salinity water at the ocean surface with sharp lateral and vertical bound- aries. In the tropics, where rain rates can often exceed 10 mm hr–1, measure- ments of these lateral and vertical gradi- ents have shown them to be on the order of 1 psu over lateral scales of a kilometer and depth scales of a meter. Figure 6 com- pares SSS sections at large spatial scales (i.e., a few hundred kilometers) and small spatial scales (i.e., a few tens of kilome- ters) measured as a function of depth in the upper few meters of the ocean. These measurements show that vertical and lat- eral gradients in SSS occur at a range of rain rates and wind speeds. Furthermore, their scales in the horizontal direction can extend over a few tens of kilometers.
In the vertical direction, salinity profiles in the upper few meters can be complex, with instances where there is a vertical
gradient extending over a few meters (e.g., 5,320 km to 5,340 km in Figure 6a and 44 km to 45 km in Figure 6b) and instances where the top few meters are well mixed, with a salinity gradient at deeper depths.
The current state of observational knowledge concerning how the fresh- water influx from rain interacts with dynamical processes to generate SSS vari- ability in both time and space is insuffi- cient to constrain models of ocean surface processes. The density anomalies asso- ciated with decreases in salinity of this magnitude and surface mass fluxes from heavy precipitation events are expected to generate both baroclinic and barotropic responses in the ocean. For example, it is known that freshwater influx must spread laterally across the ocean surface and mix downward with the underlying higher salinity water. The interplay between lat- eral spreading driven by baroclinic forces and surface currents and vertical mixing due to waves and wind stress determines SSS variability on horizontal scales of a few tens of kilometers down to vertical scales of a few meters. However, although data such as those in Figure 6, and other data measured previously (Price, 1979;
Soloviev and Lukas, 1996), show that these features exist at the ocean surface, their spatial and temporal evolution has not been fully characterized.
SPURS-2 will address the questions of how spatial and temporal scales of rain combine with other upper-ocean forcing
Latitude
Depth (m)
(a) Mean Temperature at 125°W
12°N 16°N 20°N
0° 4°N 8°N
300 250 200 150 100 50 0
Depth (m)
300 250 200 150 100 50 0
8
Latitude
12°N 16°N 20°N
0° 4°N 8°N
10 12 14 16 18 20 22 24 26
28 (b) Mean Salinity at 125°W
33.5 34.0 34.5 35.0 35.5
FIGURE 5. (a) Mean temperature (°C) and (b) salinity sections along 125°W from the equator to 20°N.
From the World Ocean Atlas 2009 climatology
Oceanography | Vol.28, No.1 156
and dynamics to produce observed tem- poral and spatial salinity distribution.
Required measurements include long- term monitoring (i.e., weeks to months) of salinity fields in the ocean mixed layer, with emphasis on measurements in the very near surface (i.e., upper 10 m). Resolution of the short-time- scale dynamics associated with forma- tion and decay of rain-related salinity anomalies in the upper ocean will also require short-term measurements that are capable of resolving salinity gradients in the upper meter of the ocean. These measurements should ideally cover spa- tial scales on order of the known spa- tial scales of rain events, so that the ini- tial conditions for these lenses of fresher water are known.
5. Influence of rain on remote sensing Figure 6b shows that salinity gradients in the top few meters of the ocean can extend over scales of a few tens of kilome- ters and have salinity anomalies on order of 1 psu. Rain-induced surface freshen- ing on these scales, measured by L-band microwave radiometers, would be sig- nificant in terms of its impact on salin- ity. The surface salinity measurements
described above in item 4 will also pro- vide information required to determine whether fresh events resulting from rain cause a bias that must be taken into account when extrapolating salinities measured by L-band microwave instru- ments (at depths on order of 0.01 m) to values that would be found at depths on the order of 10 m.
SPURS-2: A TROPICAL FIELD AND MODELING PROGRAM
In order to address the questions out- lined in the previous section, an obser- vational and modeling program will be carried out throughout an annual cycle, beginning during the 2016 calendar year.
SPURS-2 is expected to fully capitalize on measurements from Aquarius and SMOS satellite missions, as well as with other remote-sensing products (e.g., altime- try, scatterometry, precipitation). As in SPURS-1, large-scale velocity fields will be derived from ocean models that incor- porate Argo float hydrographic data and satellite altimetry data.
Measuring and interpreting processes occurring in a thin surface layer above the shallow and strong thermocline/
halocline of the eastern tropical Pacific
present special challenges that need to be squarely addressed by SPURS-2 measure- ments. This high-precipitation region dif- fers from the western Pacific warm pool where there is a much deeper perma- nent pycnocline, so it will be of interest to draw out differences between the kinds of upper-ocean processes at work in the SPURS-2 area from those described in the Tropical Ocean Global Atmosphere Coupled Ocean Atmosphere Response Experiment (TOGA COARE). The par- ticular state of the El Niño system during SPURS-2 will be of great interest for gen- eralizing to other time periods. Such interannual variability, though strongest further south, must be factored in to any attempt to generalize from the limited duration of the field program. SPURS-2 will also help inform how such regions should be monitored in future ocean observing systems.
The field component is expected to maintain a persistent presence through- out the year. Intense ship-based mea- surements will be required to resolve the small temporal and spatial scales of rain events and enhance the interpretation of long-term measurements. All measure- ments will be guided and complemented
FIGURE 6. Observations of rain-induced salinity stratification in the upper few meters of the ocean at large and small scales as reported by Asher et al.
(2014). (a) Data recorded by the Underway Salinity Profiling System installed on R/V Thomas G. Thompson in 2011 while underway in the North Pacific.
(b) Data from the Surface Salinity Profiler recorded in the equatorial Pacific Ocean during a cruise aboard R/V Kilo Moana.
Tow Distance (km)
Wind Speed (m s–1) Rain Rate (mm hr–1)
20
0.11 m 0.26 m 1.04 m 8.00 m 1 m
2 m 5 m
Wind Speed Rain Rate Wind Speed
Rain Rate
a b
30 40 50 60
Distance (km)
5,100 5,200 5,300 5,400 5,500
10 8 6 4 2 0
10
5
0
Salinity (psu)
35.05
35.02
34.99
34.96
34.93
34.90
Rain Rate (mm hr–1) 50
40 30 20 10 0
Salinity (psu)
35.2
34.8
34.4
34.0
33.6
Wind Speed (m s–1) 12 9 6 3 0
by numerical modeling and data assimi- lation studies.
Next, we describe the scientific objec- tives of SPURS-2 in terms of temporal and spatial scales.
Large Scale
This scale covers the entire tropical ocean regime, with a focus on the ITCZ region and the eastern Pacific fresh pool (box shown in Figure 4). The proposed SPURS-2 area is the location of a strong annual cycle of salinity, one of the larg- est in the global ocean. The region’s salin- ity gradients and advective currents need to be monitored in order to understand the local balances. The field campaign and modeling efforts should aim to char- acterize the processes contributing to the freshening and salinifying stages. We expect to investigate similarities to and contrasts with other ITCZ and high pre- cipitation regions, as well as those in the rest of the Pacific Ocean. As SPURS-2 will sample only one realization of the annual cycle, some effort must be made to assess the extent to which the particular year during which the SPURS-2 experiment is conducted represents a typical annual cycle in the region. The TAO array will be particularly helpful in assessing the sta- tus of El Niño during SPURS-2. Though the strongest effects will be to the south of the SPURS-2 site, we can expect El Niño to weaken the trade winds in this region and raise SST; La Niña would have the opposite effects.
Mesoscale
A smaller region around the central SPURS-2 site would resolve scales of about 10 km to about 300 km. Within this “mesoscale box” or “inner nest,”
gradients are larger in the north-south direction than in the east-west direc- tion. Tropical instability waves have been observed in Aquarius SSS maps, though the strongest salinity signals are south of the main SPURS-2 site (Lee et al., 2012).
They have periods of 17–33 days and will contribute to velocity, temperature, and salinity variance at the study site. These
waves tend to be more prominent during La Niña, and suppressed during El Niño (Willet et al., 2006).
Small-Scale: <10 km, <1 day
Precipitation is expected to be spatially and temporally patchy, thus provid- ing the ocean with an input variance at small scales. The “rain puddles” need to be characterized over a short time scale because they evolve rapidly (Soloviev et al., 2015). A variety of oceanic pro-
cesses spread and integrate that variance, which might be described as an inverse cascade. Shcherbina et al. (2015, in this issue) describe some of the fine-scale intrusive structures observed during SPURS-1. At the same time, rain pud- dles and buoyancy fronts associated with patchy freshwater may lead to submeso- scale processes that generate mixed-layer eddies and smaller structures. The strong stratification at the base of the mixed layer also supports internal waves, which modulate mixing and more generally play an important role in mixed-layer dynam- ics and its response to perturbations. It is expected that effort would be dedi- cated to estimation of the microscale dis- sipation parameters ε and χ in as many places as possible using gliders, profil- ing floats, and ship-based measurements.
These data will enable examination of the role processes at scales ranging from sev- eral hundred kilometers down to the dis- sipation scale play in turbulent mixing of salinity and other properties.
In order to resolve the processes hap- pening at different scales, a nested obser- vational approach is planned. For exam- ple, it can include a setup similar to that used in SPURS-1, where year-long obser- vations from flux buoys, underwater gliders, profiling and mixed-layer floats, surface wave gliders, and drifters were complemented by dedicated ship surveys (microstructure, autonomous under- water vehicles, profiler measurements) and historical observations.
Modeling Component
SPURS-2 will be a fully integrated observing and modeling program. Before the field experiment, SPURS-2 will use models to perform Observing System Simulation Experiments (OSSEs) to aid the observing system design. During the field experiment, investigators will have access to real-time assimilative/forecast- ing models at the spatial scales of obser- vational data being collected. After the field experiment, models will be used to produce reanalysis to further address the SPURS-2 science questions. Thus, the model program may include:
• Process-oriented ocean models, including large-eddy-simulation (LES), to address specific SSS processes, for example, mixing parameterizations
• Full three-dimensional global to regional ocean general circulation models
• OSSE, observing system design, and trade-off studies (e.g., how many glid- ers do we need to address a specific
“Measuring and interpreting processes occurring in a thin surface layer above the shallow and strong thermocline/halocline of the eastern tropical Pacific present special challenges that need to be squarely addressed
by SPURS-2 measurements.
”.
Oceanography | Vol.28, No.1 158
science question?) in preparation for the field experiment
• Real-time or near-real-time assimi- lation/forecasting and adaptive sam- pling (to track features such as eddies and fronts) during the field experiment
• Reanalysis, further process modeling, and parameterization development following the field experiment
• Downscaled Weather Research and Forecasting (WRF) and Coupled Ocean-Atmosphere Mesoscale Predic- tion System (COAMPS) nowcast/
forecast/reanalysis over the field exper- iment domain (likely to be needed along with leveraging on other model and flux products in the event that air-sea fluxes from global Numerical Weather Prediction models are not sufficiently accurate)
Given the scope of the scientific goals, the plan is to collaborate with multiple funding agencies and interna- tional partners, as was done successfully during SPURS-1.
Atmospheric Component
Although SPURS-2 is framed as an ocean- ographic experiment, atmospheric forc- ing of the upper ocean is of central impor- tance for addressing the SPURS-2 science questions. Oceanic variability, at least immediately after a precipitation event, is likely to tightly mirror the scales of clouds and/or atmospheric storms. It is therefore important to characterize rainfall scales, although it is recognized that this may be different from oceanic scales or those pre- dicted by meteorologists. It is expected that rain rates can be estimated in situ by a variety of instruments, including moored and autonomous platforms as well as ship-mounted sensors, and it would be useful to compare/relate these measure- ments with the rain scales estimated from satellite remote sensing (GPM, TRMM, and ship-mounted radar).
SPURS Data Management System The success of the SPURS-2 field experi- ment depends on collaboration among a network of institutions across the United
States and internationally. Achieving the overall SPURS-2 goals will require quan- titative analysis of interdisciplinary data sets and model output. Thus, obser- vational data and model output must be exchanged between researchers. To extract the full scientific value, data must be made available to the scientific com- munity on a timely basis. This was done very successfully in SPURS-1 (Bingham et al., 2015, this issue), so that near-real- time observations from Argo, Aquarius, and altimetry were available to mod- els that provided estimates of currents and salinity structure to the investiga- tors at sea. The SPURS Data Management System (SPURS-DMS) will be adapted to the SPURS-2 site well in advance of the field experiment to collect data products and make them available through the Web. Originators (observing elements or modeling groups) will be primarily responsible for quality control of their own data/products. As soon as quality- controlled data can be made available to other researchers (ideally within two to six months), the data will be released, along with documentation to judge data quality and potential usefulness.
SPURS-2 SUMMARY:
EXPERIMENTAL DESIGN
It is premature to present a detailed experimental design prior to identifica- tion of the funded resources that will be able to contribute to SPURS-2. However, it is possible to identify the site and the preferred timing of the field program and anticipated contributions to the program.
Site. Eastern tropical Pacific ITCZ in the region of 10°N, 125°W.
Scheduling. The field campaign would take place over one full year, with ship time arranged in three cruises about six months apart and an anticipated start date in the summer of 2016. Because interest is highest in the dynamics of rainfall events, it will be best to have the initial deployment cruise and final asset recovery cruise in the summer/fall rainy
period. As such, these cruises could be also used for specific process studies, which would be an attractive option to encourage partnership between funding agencies.
Intensive Surveys. These field campaigns should include shipboard surveys of basic temperature, salinity, and velocity struc- ture at a variety of scales, including the use of conductivity-temperature-depth (CTD) sections, thermosalinographs, and special techniques to sample the surface layer. Microstructure measure- ments from ship and mobile assets are also encouraged. Atmospheric flux mea- surements, especially of rainfall, would be valuable, as would radiosonde deploy- ments from the ships.
Moored Assets. We anticipate the use of one or more moorings, potentially arranged meridionally along 125°W, with priority on air-sea flux measurements (freshwater, heat, and momentum) and upper-ocean temperature, salinity, and velocity structure. The concentration of instruments can be more surface-focused than was required in SPURS-1.
Lagrangian Assets. Lagrangian instru- ments such as floats and surface drifters will be needed to define regional gradi- ents, but we must consider the stronger current regime of this site compared to SPURS-1. The potential for upstream seeding of drifters or active selection of float parking depth should be considered.
Mobile Assets. Wave Gliders, Seagliders, or other mobile platforms may be partic- ularly useful in this high-current regime.
Monitoring of meridional thermohaline structure will be of most interest.
Ongoing Regional Measurements.
Maintenance of the 125°W line of the TAO/TRITON array is highly desired for this project, as well as any enhancements to it, such as improved flux measurements or higher-resolution monitoring of tem- perature and salinity structure. Similarly,
regional enhancements of VOS-deployed expendable bathythermographs (XBTs) or drifters would be most welcome.
Regional and Local Modeling. As in SPURS-1, we anticipate the use of ocean and coupled ocean-atmosphere models on a variety of scales to help understand and interpret our data and plan ship- board operations during the cruises.
Remote Sensing. Aquarius data were particularly useful during SPURS-1, and access to altimetry products and SST products also proved useful. Similar contributions would be beneficial to SPURS-2.
Data Management Plan. A SPURS Data Management System that includes real- time support of the cruises, data quality control, and data archiving will be imple- mented (e.g., Bingham et al., 2015, in this issue). Powerful visualization tools are now available that incorporate data and models to provide guidance to the inves- tigator at sea. Blogs from SPURS-1 inves- tigators at sea proved to be popular and effective communication links to the gen- eral public. And, of course, basic archi- val functions will keep the data avail- able to the broader scientific community for posterity.
SPURS-2 represents an exceptional opportunity to explore the physical response of the ocean to strong fresh- water forcing. As in SPURS-1, we antic- ipate new discoveries and better under- standing of known processes to emerge from the work. The knowledge gained will assure that new salinity observing tools such as Aquarius, SMOS, and Argo can provide greater insight into our changing global water cycle. Because most of the water cycle is over the ocean and most rainfall originates there, the anticipated benefits to society are substantial.
REFERENCES
Adler, R.F., G.J. Huffman, A. Chang, R. Ferraro, P.-P. Xie, J. Janowiak, B. Rudolf, U. Schneider, S. Curtis, D. Bolvin, and others. 2003. The Version 2 Global Precipitation Climatology Project (GPCP) monthly precipitation analysis (1979–pres- ent). Journal of Hydrometeorology 4:1,147–1,167, http://dx.doi.org/10.1175/1525-7541(2003)004
<1147:TVGPCP>2.0.CO;2.
Asher, W.E., A.T. Jessup, R. Branch, and D. Clark.
2014. Observations of rain-induced near sur- face salinity anomalies. Journal of Geophysical Research 119:5,483–5,500, http://dx.doi.org/
10.1002/2014JC009954.
Bingham, F.M., P. Li, Z. Li, Q. Vu, and Y. Chao. 2015.
Data management support for the SPURS Atlantic field campaign. Oceanography 28(1):46–55, http://dx.doi.org/10.5670/oceanog.2015.13.
Broecker, W.S., T.H. Peng, J. Jouzel, and G. Russell.
1990. The magnitude of global fresh-water trans- ports of importance to ocean circulation. Climate Dynamics 4:73–79, http://dx.doi.org/10.1007/
BF00208902.
de Boyer Montégut, C., J. Mignot, A. Lazar, and S. Cravatte. 2007. Control of salinity on the mixed layer depth in the world ocean: Part 1. General description. Journal of Geophysical Research 112, C06011, http://dx.doi.org/10.1029/2006JC003953.
Durack, P.J. 2015. Ocean salinity and the global water cycle. Oceanography 28(1):20–31, http://dx.doi.org/
10.5670/oceanog.2015.03.
Durack, P.J., and S.E. Wijffels. 2010. Fifty-year trends in global ocean salinities and their rela- tionship to broad-scale warming. Journal of Climate 23:4,342–4,362, http://dx.doi.org/
10.1175/2010JCLI3377.1.
Farrar, J.T. 2003. The evolution of upper ocean ther- mal structure at 10°N, 125°W during 1997–1998.
SM Thesis, Massachusetts Institute of Technology, 191 pp.
Godfrey, J.S., and E.J. Lindstrom. 1989. The heat budget of the equatorial western Pacific sur- face mixed layer. Journal of Geophysical Research 94(C6):8,007–8,017, http://dx.doi.org/
10.1029/JC094iC06p08007.
Lee, T., G. Lagerloef, M.M. Gierach, H.-Y. Kao, S. Yueh, and K. Dohan. 2012. Aquarius reveals salinity struc- ture of tropical instability waves. Geophysical Research Letters 39, L12610, http://dx.doi.org/
10.1029/ 2012GL052232.
Mignot, J., C. de Boyer Montegut, A. Lazar, and S. Cravatte. 2007. Control of salinity on the mixed layer depth in the world ocean: Part 2. Tropical areas. Journal of Geophysical Research 112, C10010, http://dx.doi.org/10.1029/2006JC003954.
Price, J.F. 1979. Observations of a rain- formed mixed layer. Journal of Physical Oceanography 9:643–649, http://dx.doi.org/
10.1175/1520-0485(1979)009 <0643:OOARFM>
2.0.CO;2.
Schmitt, R.W. 2008. Salinity and the global water cycle. Oceanography 21(1):12–19, http://dx.doi.org/
10.5670/oceanog.2008.63.
Shcherbina, A.Y., E.A. D’Asaro, S.C. Riser, and W.S. Kessler. 2015. Variability and interleav- ing of upper-ocean water masses surround- ing the North Atlantic salinity maximum.
Oceanography 28(1):106–113, http://dx.doi.org/
10.5670/oceanog.2015.12.
Soloviev, A., and R. Lukas. 1996. Observation of spatial variability of diurnal thermo- cline and rain-formed halocline in the west- ern Pacific warm pool. Journal of Physical Oceanography 26(11):2,529–2,538.
Soloviev, A.V., S. Matt, and A. Fujimura. 2015.
Three-dimensional dynamics of freshwater lenses in the ocean’s near-surface layer.
Oceanography 28(1):142–149, http://dx.doi.org/
10.5670/oceanog.2015.14.
Stephens, G.L., J. Li, M. Wild, C.A. Clayson, N. Loeb, S. Kato, T. L’Ecuyer, P.W. Stackhouse Jr., M. Lebsock, and T. Andrews. 2012. An update on Earth’s energy balance in light of the latest global observations.
Nature Geoscience 5:691–696, http://dx.doi.org/
10.1038/ngeo1580.
Willett, C.S., R.R. Leben, and M.F. Lavın. 2006.
Eddies and tropical instability waves in the eastern tropical Pacific: A review. Progress in Oceanography 69:218–238, http://dx.doi.org/
10.1016/j.pocean.2006.03.010.
SPURS-2 PLANNING GROUP
Raymond W. Schmitt (Woods Hole Oceanographic Institution, [email protected]), William Asher (Applied Physics Laboratory, University of Washington), Frederick Bingham (University of North Carolina at Wilmington), James Carton (Department of Atmospheric and Oceanic Science, University of Maryland), Luca Centurioni (Scripps Institution of Oceanography), J. Thomas Farrar (Woods Hole Oceanographic Institution), Arnold Gordon (Lamont-Doherty Earth Observatory of Columbia University), Benjamin Hodges (Woods Hole Oceanographic Institution), Andrew Jessup (Applied Physics Laboratory, University of Washington), William S. Kessler (NOAA Pacific Marine Environmental Laboratory), Luc Rainville (Applied Physics Laboratory, University of Washington), and Andrey Shcherbina (Applied Physics Laboratory, University of Washington) ARTICLE CITATION
SPURS-2 Planning Group. 2015. From salty to fresh—
Salinity Processes in the Upper-ocean Regional Study-2 (SPURS-2): Diagnosing the physics of a rainfall-domi- nated salinity minimum. Oceanography 28(1):150–159, http://dx.doi.org/10.5670/oceanog.2015.15.