For Peer Review
Food anaphylaxis induces oral dysbiosis and IL-33–
mediated exacerbation in the intestine
Journal: Clinical and Experimental Allergy Manuscript ID Draft
Manuscript Type: Original Article-Basic Mechanisms in Allergic Disease Date Submitted by the
Author: n/a
Complete List of Authors: Matsui, Shohei; Showa University - Hatanodai Campus, Department of Oral Microbiology and Immunology
Kataoka, Hideo; Showa University - Hatanodai Campus, Department of Oral Microbiology and Immunology
Tanaka, Jun-ichi; Showa University - Hatanodai Campus, Division of Pathology, Department of Oral Diagnostic Science
Kikuchi, Mariko; Showa University - Hatanodai Campus, Department of Oral Microbiology and Immunology
Fukamachi, Haruka; Showa University - Hatanodai Campus, Department of Oral Microbiology and Immunology
Morisaki, Hirobumi; Showa University - Hatanodai Campus, Department of Oral Microbiology and Immunology
Matsushima, Hitomi; Showa University - Hatanodai Campus, Department of Pediatric Dentistry
Mishima, Kenji; Showa University - Hatanodai Campus, Division of Pathology, Department of Oral Diagnostic Sciences
Hironaka, Shoji; Showa University - Hatanodai Campus, Department of Special Needs Dentistry,Division of Hygiene and Oral Health
Takaki, Takashi; Showa University - Hatanodai Campus, Division of Electron Microscopy
Okahashi, Nobuo; Osaka University, Center for Frontier Oral Science Maruoka, Yasubumi; Showa University - Hatanodai Campus, Department of Special Needs Dentistry, Division of Community Based Comprehensive Dentistry
Kuwata, Hirotaka; Showa University - Hatanodai Campus, Department of Oral Microbiology and Immunology
Keywords: anaphylaxis, basic immunology, food allergy Additional Keywords:
For Peer Review
Food anaphylaxis induces oral dysbiosis and IL-33–mediated exacerbation in the intestine
Running title: Intestinal dysbiosis augments food allergy
Word count: 3,328 words
Number of figures: 8 figures
Number of tables: 0 tables
Shohei Matsui
1,2, Hideo Kataoka
1,*, Jun-Ichi Tanaka
3, Mariko Kikuchi
2, Haruka Fukamachi
1, Takafumi Arimoto
1, Hirobumi Morisaki
1, Hitomi Matsushima
4, Kenji Mishima
3, Shoji Hironaka
5, Takashi Takaki
6, Nobuo Okahashi
7, Yasubumi Maruoka
2, Hirotaka Kuwata
11
Departments of Oral Microbiology, Showa University, Tokyo, Japan
2
Department of Special Needs Dentistry, Division of Community Based Comprehensive Dentistry, Showa University, Tokyo, Japan
3
Department of Oral Diagnostic Sciences, Division of Pathology, Suita-Osaka, Japan
4
Department of Pediatric Dentistry, Showa University, Tokyo, Japan
5
Department of Special Needs Dentistry, Division of Hygiene and Oral Health, Showa University, Tokyo, Japan
6
School of Dentistry, Division of Electron microscopy, School of Medicine, Showa University, Tokyo, Japan
7
Center for Frontier Oral Science, Osaka University Graduate School of Dentistry,
4
5
6
7
8
9
10
11
12
13
14
15
16
17
18
19
20
21
22
23
24
25
26
27
28
29
30
31
32
33
34
35
36
37
38
39
40
41
42
43
44
45
46
47
48
49
50
51
52
53
54
55
56
57
58
For Peer Review
Suita-Osaka, Japan
*
Corresponding author
Hideo Kataoka, D. D. S., Ph.D., Department of Oral Microbiology, Showa University School of Dentistry, 1-5-8 Hatanodai,Shinagawa-ku, Tokyo 142-8555, Japan
E-mail: [email protected], Tel: +81-3-3784-8166
Acknowledgements
This work was supported by Grant-in-Aid for Scientific Research (C) Nos. 15K11084 and 18K09558 provided by the Japan Society for the Promotion of Science and MEXT-Supported Program for the Strategic Research Foundation at Private Universities No. S1411009. The authors declare no competing financial interests.
Conflict of interest
The authors have no conflicts of interest to declare.
4
5
6
7
8
9
10
11
12
13
14
15
16
17
18
19
20
21
22
23
24
25
26
27
28
29
30
31
32
33
34
35
36
37
38
39
40
41
42
43
44
45
46
47
48
49
50
51
52
53
54
55
56
57
58
For Peer Review
Abstract
Background: Food allergy is a life-threatening response to specific foods, and
gastrointestinal microbiota imbalance is considered a cause of this disease. However,
the effects of an imbalanced oral microbiota on food allergy are unknown. The host
immune response also plays an important role in the disease. Notably, interleukin
(IL)-33 released from damaged or necrotic intestinal epithelial cells facilitates Th2
responses. However, causal relationships among the gastrointestinal and oral
microbiota, food allergy, and IL-33 release remain unknown.
Objective: To analyze the effects of gastrointestinal and oral microbiota on the
development of food allergy.
Methods: A murine model of food allergy was established via ovalbumin (OVA)
injection in BALB/c mice. Viable bacteria in feces were identified using matrix-assisted
laser desorption ionization-time of flight mass spectrometry. Il33 expression in colon-26
mouse colon cells stimulated by isolated fecal bacteria was quantified by real-time PCR.
Intestinal T lymphocytes from the mice were analyzed by flow cytometry. Hydrogen
peroxide-producing bacteria in mouse saliva were detected using Prussian blue plates.
Salivary IgA levels were quantified using ELISA, and IgA-bound oral bacteria were
detected using flow cytometry.
4
5
6
7
8
9
10
11
12
13
14
15
16
17
18
19
20
21
22
23
24
25
26
27
28
29
30
31
32
33
34
35
36
37
38
39
40
41
42
43
44
45
46
47
48
49
50
51
52
53
54
55
56
57
58
For Peer Review
Results: Among fecal bacteria, Citrobacter sp. accumulated at a significantly higher
level in the feces of allergic mice, and these bacteria induced il33 expression in
colon-26 cells. Orally administered Citrobacter koseri JCM1658 exacerbated systemic
allergic symptoms and reduced Th17 cell counts in the gastrointestinal tract. Hydrogen
peroxide-producing bacterium counts were lower in the oral cavities of allergic mice,
whereas salivary IgA levels and IgA-bound oral bacterium counts were increased.
Conclusions & clinical relevance: Food allergy changed the bacterial compositions of
both the gastrointestinal and oral microbiota. Citrobacter sp. counts were higher in the
gastrointestinal tract of mice with food allergy, and they aggravated symptoms by
inducing IL-33 release from intestinal epithelial cells.
4
5
6
7
8
9
10
11
12
13
14
15
16
17
18
19
20
21
22
23
24
25
26
27
28
29
30
31
32
33
34
35
36
37
38
39
40
41
42
43
44
45
46
47
48
49
50
51
52
53
54
55
56
57
58
For Peer Review
1 Introduction
Food allergy is a life-threatening anaphylactic response to foods. Its prevalence is increasing, particularly in developed countries.
1Gastrointestinal immune system dysfunction is considered an inducer of food allergy, and the intestinal microbiota plays important roles in this dysfunction.
2A recent report revealed that clostridia, commensal bacteria indigenous to the murine gastrointestinal tract, induce regulatory T cell accumulation in the mouse colonic lamina propria while decreasing ovalbumin (OVA)-specific IgE production in the sera of OVA-sensitized mice.
3Clostridia alter the composition of the commensal gastrointestinal microbiota, and the clostridia-containing gastrointestinal microbiota suppresses Th2 cytokine production and allergen accession by inducing interleukin (IL)-22 production in mouse serum.
4In addition, orally administered Lactobacillus brevis HY7401 induces Th1 cytokine production and inhibits Th2 cytokine production.
5These reports demonstrate that the intestinal bacteria comprising the gastrointestinal microbiota are capable of affecting host Th2 responses. However, the detailed relationships between food allergies and the
gastrointestinal microbiota remain to be elucidated. Conversely, the relationship of the oral microbiota composition, which influences that of the gastrointestinal microbiota, and food allergy symptoms is completely unknown even though the effects of orally administered bacteria have been investigated.
5IL-33, a member of the IL-1 family of cytokines, is produced by epithelial cells,
4
5
6
7
8
9
10
11
12
13
14
15
16
17
18
19
20
21
22
23
24
25
26
27
28
29
30
31
32
33
34
35
36
37
38
39
40
41
42
43
44
45
46
47
48
49
50
51
52
53
54
55
56
57
58
For Peer Review
keratinocytes, fibroblasts, and other immune cells.
6IL-33 induces the expression of
cytokine-encoding genes in Th2 cells and activates MAP kinases in mast cells by binding to cthe unique IL-33-specific receptor ST2.
6Upon the infiltration of damaged epithelial cells, bacterial pathogens and commensal bacteria induce host production of IL-33, which in turn activates Th2 cells, basophils, mast cells, and group-2 innate lymphoid cells.
6These results illustrate the crucial role of IL-33 in inducing Th2 responses in the gastrointestinal tract, suggesting a causal relationship between IL-33 induction and food allergy. Indeed, a recent report revealed that IL-33 released from damaged epithelial cells enhances IgE-mediated degranulation in mast cells and that blockade of ST2 attenuates food-induced anaphylaxis.
7In addition, another report found that il33
−/−mice were completely protected against oral
challenge-induced core body temperature lowering, one of the typical symptoms of the anaphylactic response.
8Therefore, the IL-33–inducing activity of intestinal bacteria influences the severity of food anaphylaxis.
In the present study, we identified an intestinal bacterium that specifically
accumulates in the gastrointestinal tract in a mouse model of food allergy. We then examined the il33-inducing activity of this bacterium. Concurrently, we also compared the
compositions of the oral microbiota between food-allergic mice and control mice. Our results demonstrated that intestinal dysbiosis exacerbates food anaphylaxis, confirming the food allergy-inducing ability of gastrointestinal commensal bacteria. Interestingly, our results
4
5
6
7
8
9
10
11
12
13
14
15
16
17
18
19
20
21
22
23
24
25
26
27
28
29
30
31
32
33
34
35
36
37
38
39
40
41
42
43
44
45
46
47
48
49
50
51
52
53
54
55
56
57
58
For Peer Review
suggest that food allergy also induces oral dysbiosis.
2 Methods
2.1 Mouse model of food allergy
Animal experiments were approved by The Institutional Animal Care and Use Committee of Showa University, Japan (approval number: 18008). Female BALB/c mice (8 weeks old; Japan CLEA, Tokyo, Japan) were maintained under specific pathogen-free conditions. These mice were housed in sterilized cages, and they received a standard mouse diet (Certified Diet MF, Oriental Yeast, Tokyo, Japan) and autoclaved water. These mice were sensitized via two intraperitoneal (IP) injections (at a 1-week interval) of 4 g of ovalbumin (OVA, Wako, Osaka, Japan) mixed with 100 l of aluminum hydroxide gel adjuvant (alum; Invivogen, San Diego, CA, USA). Starting 1 week after the second injection, food allergy was induced via oral (PO) administration of four doses (over the course of 1 week) of 10 mg of OVA dissolved in phosphate-buffered saline (PBS) using a feeding needle. To elicit allergic responses, mice were administered PO 50 mg of OVA dissolved in PBS 1 week after the last 10-mg OVA administration. To evaluate whether a food allergy was elicited, OVA-specific IgE levels in the sera of the mice were measured using a mouse OVA-IgE ELISA kit (AKRIE-30, Shibayagi, Gumma, Japan). Systemic anaphylaxis in the
4
5
6
7
8
9
10
11
12
13
14
15
16
17
18
19
20
21
22
23
24
25
26
27
28
29
30
31
32
33
34
35
36
37
38
39
40
41
42
43
44
45
46
47
48
49
50
51
52
53
54
55
56
57
58
For Peer Review
mice was evaluated by monitoring for decreased rectal temperature using a weighing environment logger (AD-1687; A and D, Tokyo, Japan).
2.2 Identification of fecal bacteria
The feces of both OVA/alum mice and PBS/alum mice were suspended in 20 volumes of PBS, inoculated onto plates containing Columbia agar with 5% sheep blood, and cultured anaerobically for 2 days at 37°C. To identify viable bacteria in the feces of the mice, a portion of the fresh colonies that developed on each plate was smeared onto a target slide as samples. These samples were covered with α-cyano-4-hydroxycinnamic acid matrix solution and loaded into a VITEK® MS MALDI-TOF MS system (BioMérieux, Lyon, France). The spectra of the samples were analyzed using the Myla® database to identify the species of origin.
9Forty-eight fresh colonies from each group of mice were analyzed.
2.3 mRNA expression
Colon-26 RCB2657, a mouse colon epithelial cell line, was purchased from the Cell Engineering Division of RIKEN BioResource Center (Tsukuba, Japan). The cells were cultured in RPMI 1640 medium (Wako, Tokyo, Japan) supplemented with 10%
heat-inactivated fetal bovine serum (FBS) at 37°C in a humidified 5% CO
2atmosphere. The cells were stimulated by each of four species of fecal-extracted bacteria (Citrobacter sp.,
4
5
6
7
8
9
10
11
12
13
14
15
16
17
18
19
20
21
22
23
24
25
26
27
28
29
30
31
32
33
34
35
36
37
38
39
40
41
42
43
44
45
46
47
48
49
50
51
52
53
54
55
56
57
58
For Peer Review
Enterococcus sp., Lactobacillus sp. 1, and Lactobacillus sp. 2), each at multiplicities of
infection of 1, 5, and 10, for 4 h. Total RNA from the cells was isolated using TRIzol®
reagent (Thermo Fisher Scientific, MA, USA) and quantified spectrophotometrically. Then, 200 ng of total RNA were converted into cDNA using a ReverTra Ace® qPCR RT kit (Toyobo, Osaka Japan). The primer pairs for mouse il33 (sense,
5′-GATGGGAAGAAGGTGA-3′; anti-sense, 5′-TTGTGAAGGACGAAGA-3′) and gapdh
(sense, 5′-GCACAGTCAAGGCCGAGAAT-3′; anti-sense,
5′-GCCTTCTCCATGGTGGTGAA-3′) transcripts were used for real-time PCR.
Amplification was performed using a Fast SYBR™ Green Master Mix (Applied Biosystems, CA, USA) and the Step One Plus Real-Time PCR System (Applied Biosystems). Il33
expression in each sample was normalized to that of gapdh (as internal control) and a non-stimulated cell sample (as a calibrator) using the comparative Ct method.
2.4 Oral administration of bacteria
For antibiotic-mediated depletion of the gastrointestinal microbiota, mice were permitted ad libitum access to drinking water containing an antibiotic cocktail consisting of ampicillin (0.1 g/ml; Wako), kanamycin (0.2 g/ml; Wako), and enrofloxacin (120 mg/ml;
Bayer, Tokyo, Japan) for 1 week. Citrobacter koseri JCM1658, purchased from the Cell Engineering Division of RIKEN BioResource Center, was cultured at 37°C under anaerobic
4
5
6
7
8
9
10
11
12
13
14
15
16
17
18
19
20
21
22
23
24
25
26
27
28
29
30
31
32
33
34
35
36
37
38
39
40
41
42
43
44
45
46
47
48
49
50
51
52
53
54
55
56
57
58
For Peer Review
conditions in BHI broth. After depleting the gastrointestinal microbiota, mice were
administered PO 200 l of 5% NaHCO3 in PBS followed by 1 × 10
9colony-forming units of live C. koseri JCM1658 suspended in 400 l of PBS using a feeding needle. Changes in the bacterial composition of the gastrointestinal microbiota were evaluated via speciation of fecal bacteria using the aforementioned plating and VITEK® methods.
2.5 Flow cytometry
Mice were anesthetized via IP injections of ketamine–xylazine (ketamine, 100 mg/kg body weight; xylazine, 10 mg/kg body weight) and perfused with Hanks’ Balanced Salt Solution (HBSS) containing 2 mM ethylenediaminetetraacetic acid (EDTA) to blood removal. The small intestines of mice were longitudinally opened, washed with PBS, and shaken in HBSS containing 2 mM EDTA for 70 s. The intestines were shredded and shaken in RPMI 1640 containing 4% FBS, 0.2 mg/ml collagenase type 1 (Wako), 0.4 mg/ml dispase 1 (Wako) and 10 g/ml DNase I (Nippon Gene, Japan) for 30 min at 37°C. Cells in the digested tissue were passed through a cell strainer, and single-cell suspensions were pretreated with brefeldin A (100 ng/ml) for 1 h. The cells then were stained with
allophycocyanin-conjugated anti-mouse CD3 (Becton Dickinson [BD], NJ, USA), Brilliant Violet™-421 (BV-421)-conjugated anti-mouse CD4 (BD), phycoerythrin (PE)-conjugated anti-mouse IL-17A (BD), PE-conjugated anti-mouse IL-17F (BD), and fluorescein
4
5
6
7
8
9
10
11
12
13
14
15
16
17
18
19
20
21
22
23
24
25
26
27
28
29
30
31
32
33
34
35
36
37
38
39
40
41
42
43
44
45
46
47
48
49
50
51
52
53
54
55
56
57
58
For Peer Review
isothiocyanate-conjugated anti mouse CD4 (BD) antibodies. These cells were analyzed using FACS Verse (BD).
2.6 Histological analysis
Small intestinal tissues were fixed in 4% paraformaldehyde and embedded in paraffin.
Sections were stained via May-Grünwald-Giemsa staining. The numbers of eosinophils were counted under a high-power field at ×400 magnification. The numbers of eosinophils were expressed as the means of three high-power fields.
2.7 Quantification of hydrogen peroxide-producing bacteria in the oral cavity
Saliva from both OVA/alum and PBS/alum mice was obtained using cotton swabs from the oral cavity, and these cotton swabs were each immersed in 500 l of PBS. Fifty microliters of the swab-immersed PBS were inoculated onto a Prussian blue (PB) agar plate to measure hydrogen peroxide production. PB plates were prepared by dissolving 1 g of FeCl3 ・ 6H2O, 1 g of potassium hexacyanoferrate ( Ⅲ ), 36 g of BHI broth, and 15 g of agar in deionized water.
10Hydrogen peroxide-producing bacteria were visualized by the formation of colonies with a blue halo on the PB plates after anaerobic incubation.
2.8 16S rRNA sequencing
4
5
6
7
8
9
10
11
12
13
14
15
16
17
18
19
20
21
22
23
24
25
26
27
28
29
30
31
32
33
34
35
36
37
38
39
40
41
42
43
44
45
46
47
48
49
50
51
52
53
54
55
56
57
58
For Peer Review
Saliva was obtained from OVA/alum and PBS/alum mice as described previously.
Total RNA was isolated from swab-immersed PBS samples using an RNeasy Mini Kit (Qiagen, Hilden, Germany). All RNA samples were sent to Hokkaido System Science (Sapporo, Japan), which performed 16S rRNA sequencing.
2.9 Quantification of salivary IgA levels and analysis of IgA-bound oral bacteria
OVA/alum and PBS/alum mice were anesthetized as described previously. Five minutes after the ketamine–xylazine injection, mice were IP injected with 1 mg/kg body weight of pilocarpine hydrochloride (Santen, Osaka, Japan) to stimulate salivary secretion.
Saliva was collected from the oral cavity of each mouse using a micropipette. Total IgA in the saliva was quantified using an IgA Mouse Uncoated ELISA kit (Thermo Fisher
Scientific). Collected salivary samples from both groups of mice were centrifuged at 8000 × g to pellet bacteria. The bacterial pellets were resuspended in 660 nM SYTO BC (Thermo
Fisher Scientific) in 0.25% BSA/PBS. After 30 min of incubation on ice, the suspensions were centrifuged at 8000 × g, and bacterial pellets were resuspended in 1.3 g/ml goat anti-mouse IgA-Alexa Fluor
®647 (Southern Biotech, AL, USA) in 0.25% BSA/PBS and incubated in 30 min on ice. After washing, bacterial pellets were resuspended in 0.25%
BSA/PBS and analyzed using FACS Verse (BD).
4
5
6
7
8
9
10
11
12
13
14
15
16
17
18
19
20
21
22
23
24
25
26
27
28
29
30
31
32
33
34
35
36
37
38
39
40
41
42
43
44
45
46
47
48
49
50
51
52
53
54
55
56
57
58
For Peer Review
2.10 Statistical analysis
The statistical differences were assessed using a two-tailed Student’s t-test, and homoscedasticity of the data was assumed. P values of ≤0.05 were considered significant.
3 Results
3.1 Establishment of a murine model of food allergy (OVA/alum mice)
A schematic of the establishment of the mouse model of food allergy is presented in Fig. 1A. Serum concentrations of OVA-specific IgE were significantly higher in OVA/alum mice than in PBS/alum mice, demonstrating that OVA/alum mice were sensitized to OVA (Fig. 1B). PO administration of 50 mg of OVA elicited a significant decrease in rectal temperature in the OVA/alum group compared with that in the control group (Fig. 1C). As decreased rectal temperature after PO administration of antigen is a representative symptom of food allergy,
11our results demonstrated the establishment of a murine model of food allergy.
3.2 Citrobacter sp. significantly propagated in the gastrointestinal tract of OVA/alum mice
To identify intestinal bacteria specifically accumulated in the gastrointestinal tract of food-allergic mice, we identified viable bacteria in the feces of both groups of mice using the
4
5
6
7
8
9
10
11
12
13
14
15
16
17
18
19
20
21
22
23
24
25
26
27
28
29
30
31
32
33
34
35
36
37
38
39
40
41
42
43
44
45
46
47
48
49
50
51
52
53
54
55
56
57
58
For Peer Review
VITEK® MS MALDI-TOF MS system. This analysis revealed that the density of
Citrobacter sp. was selectively elevated in the feces of OVA/alum mice compared with the findings in control mice (Fig. 2).
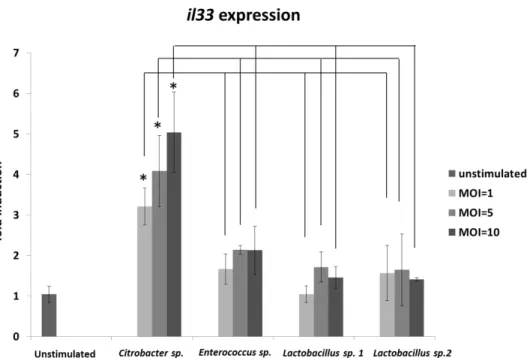
3.3 Citrobacter sp. induces IL-33 expression in a colon cell line
Recent reports revealed that IL-33 plays an important role in allergic responses,
12including the exacerbation of food-induced anaphylaxis in the gastrointestinal tract.
8We therefore examined whether fecal bacteria, including Citrobacter, induce il33 expression in gastrointestinal epithelial cells under in vitro conditions. Among the four tested species of fecal bacteria, only Citrobacter sp. induced il33 expression in a dose-dependent manner (Fig.
3).
3.4 Orally administered Citrobacter exacerbates an allergic symptom
To further confirm the augmentation of allergic responses by Citrobacter, we examined the influence of gastrointestinal microbiota (composed predominantly of
Citrobacter) on the allergic responses induced by a food antigen. The analysis revealed that
the PO C. koseri survived longer in the feces of OVA/alum mice than in the feces of
PBS/alum mice (Fig. 4A). Using these two groups of mice, we next examined whether orally administered C. koseri exacerbated the allergic response. Monitoring of rectal temperatures
4
5
6
7
8
9
10
11
12
13
14
15
16
17
18
19
20
21
22
23
24
25
26
27
28
29
30
31
32
33
34
35
36
37
38
39
40
41
42
43
44
45
46
47
48
49
50
51
52
53
54
55
56
57
58
For Peer Review
demonstrated that PO-administered OVA elicited a significantly lower rectal temperature in C. koseri-inoculated OVA/alum mice than in OVA/alum mice (Fig. 4B). In addition,
histological observation of small intestinal tissue demonstrated that PO administration of C.
koseri significantly increased the number of eosinophils in OVA/alum mice (Fig. 5).
Furthermore, an examination of the proportion of Th2 lymphocytes induced in the small intestinal lamina propria revealed that PO administration of C. koseri yielded an increased proportion of CD4+ IL-4+ lymphocytes (Th2 lymphocytes) in OVA-specific allergy mice (Fig. 6).
Recent studies reported that several intestinal bacteria including Citrobacter
rodentium, which is closely related to C. koseri, induce the accumulation of Th17 cells in the
intestinal lamina propria.
13Consistent with those reports, we observed that PO C. koseri strongly induced Th17 cell accumulation in the intestinal lamina propria of PBS/alum mice, but not in OVA/alum animals (Fig. 7). These results are consistent with the known role of Th17 cells in protecting the intestinal mucosa against exogenous pathogenic bacteria, including C. rodentium,
13and they may explain why orally administered C. koseri is more readily fixed in the gastrointestinal microbiota of OVA/alum mice than in that of PBS/alum mice.
3.5 Allergic symptoms changed the composition of the oral microbiota
4
5
6
7
8
9
10
11
12
13
14
15
16
17
18
19
20
21
22
23
24
25
26
27
28
29
30
31
32
33
34
35
36
37
38
39
40
41
42
43
44
45
46
47
48
49
50
51
52
53
54
55
56
57
58
For Peer Review
Although some causal relationships between food allergy symptoms and the gastrointestinal microbiota have been expected, the roles of the oral microbiota in food allergy are unknown. Thus, we compared the oral microbiota compositions of OVA/alum and PBS/alum mice. In the human oral cavity, it is well known that the oral cavity microbiota is normally dominated by oral streptococci including Streptococcus sanguinis and
Streptococcus gordonii, which explicitly produce hydrogen peroxide.
14In the mouse oral cavity, it has been reported that Lactobacillus sp. also dominates the oral microbiota in addition to Streptococcus.
15Lactobacillus sp. is reported to produce hydrogen peroxide.
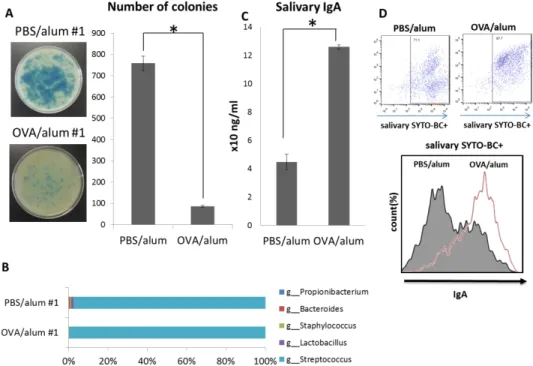
16As a result, fewer colonies with blue halos were formed on plates inoculated by saliva from OVA/alum mice than on plates exposed to saliva from PBS/alum mice (Fig. 8A). In addition, 16S rRNA sequencing confirmed the reduced diversity of oral commensal bacteria in
OVA/alum mice (Fig. 8B). Furthermore, IgA-coated bacterium counts have been reported to increase in the gastrointestinal tracts of patients with inflammatory bowel disease (IBD).
17The report suggested that IgA plays a key role in changing the gastrointestinal microbiota composition. In our experiment, salivary IgA levels were significantly higher in the oral cavities of OVA/alum mice than in PBS/alum mice (Fig. 8C). The increased salivary IgA content was bounded by oral bacteria (Fig. 8D).
4 Discussion
4
5
6
7
8
9
10
11
12
13
14
15
16
17
18
19
20
21
22
23
24
25
26
27
28
29
30
31
32
33
34
35
36
37
38
39
40
41
42
43
44
45
46
47
48
49
50
51
52
53
54
55
56
57
58
For Peer Review
In this study, we demonstrated that intestinal dysbiosis can exacerbate food
anaphylaxis. Intestinal commensal bacteria affect the development of the host gastrointestinal immune system, and antibiotic-induced intestinal dysbiosis increases host susceptibility to colonization by pathogenic bacteria.
18Several commensal bacteria that protect or induce IBD have been reported.
18Indeed, fecal microbiota transplantation has been proposed as an efficient method for treating IBD.
19Commensal microbiota or specific bacteria have been revealed to provide protection against food allergy.
4,20We used a VITEK® system to identify intestinal bacteria specifically enriched in a murine model of food allergy. This system uses MALDI-TOF-MS to speciate bacterial colonies that form on blood agar plates. This analysis made it possible to compare the quantities of viable bacteria between food-allergic mice and healthy control mice. This method revealed the allergy-inducing ability of intestinal bacteria more clearly than other methods that use samples containing dead bacteria or fragments of bacterial components because host cells respond to bacterial infiltration or bacterial metabolites to elicit immune responses. The validity of bacterial identification obtained by VITEK as established by Dubois et al.
21However, causal relationships between food allergy and the composition of the intestinal microbiota remain to be elucidated. In the present study, we identified a Citrobacter bacterium that was specifically enriched in the gastrointestinal tract in a mouse model of food allergy. Although the virulence and pathogenicity of C. rodentium in the
4
5
6
7
8
9
10
11
12
13
14
15
16
17
18
19
20
21
22
23
24
25
26
27
28
29
30
31
32
33
34
35
36
37
38
39
40
41
42
43
44
45
46
47
48
49
50
51
52
53
54
55
56
57
58
For Peer Review
gastrointestinal tract have been investigated,
22the food allergy-inducing abilities of
Citrobacter sp. have not been demonstrated. C. rodentium is reported to employ a pathogenic
mechanism of epithelial “attachment and effacement” (A/E),
23whereby this species attaches to the surface of intestinal epithelial cells and induces local destruction (“effacement”) of the epithelial cells. This mechanism triggers reactive inflammation and the induction of
IL-17-producing CD4 helper T (Th17) cells and IL-22-producing type-3 innate lymphoid cells.
23IL-33 is an alarmin cytokine that is released after cell or tissue damage.
6As
Citrobacter sp. was isolated from the feces of food-allergic mice, this species is presumed to
employ some attachment and infiltration mechanisms similar to A/E in C. rodentium. The Citrobacter sp. isolated in the present work is thus expected to be capable of disrupting host
intestinal epithelial cells, thereby triggering IL-33 production. In the present work, we
observed the il33-inducing activity of Citrobacter sp. isolated from OVA/alum mice. IL-33 is a Th2 response-driving cytokine. We further demonstrated that another Citrobacter species, C. koseri JCM1658, exacerbated the anaphylactic response when administered PO to
OVA/alum mice. These results clearly demonstrated a causal relationship between Citrobacter species and food anaphylaxis.
It has reported that C. rodentium induces Th17 cells in the gastrointestinal tract and that Th17 cells in turn facilitate the elimination of exogenous pathogenic bacteria, including Citrobacter.
13We postulate that attenuation of Th17 cell levels observed in this study can be
4
5
6
7
8
9
10
11
12
13
14
15
16
17
18
19
20
21
22
23
24
25
26
27
28
29
30
31
32
33
34
35
36
37
38
39
40
41
42
43
44
45
46
47
48
49
50
51
52
53
54
55
56
57
58
For Peer Review
attributed to Th2-biased responses in OVA/alum mice. Presumably, a trade-off occurred between Th2 and Th17 responses, such that (in the gastrointestinal tracts of OVA/alum mice) the Th2 response predominated over the weakened induction of Th17 cells, permitting the increased induction of Th2 cells. Apparently, the depleted pool of Th17 cells was not
sufficient to eliminate C. koseri within a week of PO administration. The surviving C. koseri presumably then stimulated the intestinal epithelial cells to produce IL-33, which in turn further reinforced the Th2 response in the gastrointestinal tracts of OVA/alum mice.
Furthermore, IL-33 can stimulate naïve T cells to exhibit Th2 responses but not Th17 responses.
24Such a circular feedback loop is expected to be an exacerbating factor for food allergy symptoms, facilitating further dysbiosis in the gastrointestinal tract. The resulting dynamic, imbalanced composition of the gastrointestinal microbiota has a causal relationship with food allergy symptoms. Thus, in the present study, we demonstrated that intestinal dysbiosis exacerbates food anaphylaxis and the food allergy-inducing ability of intestinal commensal bacteria.
In addition to intestinal dysbiosis, we demonstrated that the oral microbiota is also affected by food allergy. Although no detailed molecular mechanisms have been uncovered, an extended duration of food allergy symptoms changed the composition of the oral
microbiota. Repeated stimulation by allergens derived from food can induce Th2 responses in the gastrointestinal tract, and intestinal microbes affected by Th2 responses trigger a vicious
4
5
6
7
8
9
10
11
12
13
14
15
16
17
18
19
20
21
22
23
24
25
26
27
28
29
30
31
32
33
34
35
36
37
38
39
40
41
42
43
44
45
46
47
48
49
50
51
52
53
54
55
56
57
58
For Peer Review
circle of systemic dysbiosis and allergic symptoms. This “oral dysbiosis” is considered the result of Th2 conversion. It is supposed that atopic B cells activated in the gastrointestinal tract migrate through common mucosal immune systems and affect the oral microbiota composition.
25Lactobacillus sp. is reported to be one of the dominant bacteria in the oral cavities of mice,
15these bacteria are known to produce hydrogen peroxide.
16The study results suggested that hydrogen peroxide-producing Lactobacillus counts are decreased in the oral cavities of allergic mice, with a similar finding noted in the feces of OVA/alum mice.
The similar compositional change in both the oral and gastrointestinal microbiota indicated that intestinal dysbiosis induced in food allergy affects the oral microbiota. The importance of intestinal IgA for maintaining the commensal bacteria in the gastrointestinal tract was
recently reported.
17In the feces of patients with IBD, colitogenic members of the intestinal microbiota were coated with IgA.
17Oral supplementation of high-affinity and poly-reactive IgA improved the pathological colon phenotype and increased regulatory T cell counts in the colon.
26The results of the current study suggest that IgA induction in the gastrointestinal tract affects the composition of both the gastrointestinal and oral microbiota and indicate existence of causal relationships between food allergy as a systemic disease and oral dysbiosis.
4
5
6
7
8
9
10
11
12
13
14
15
16
17
18
19
20
21
22
23
24
25
26
27
28
29
30
31
32
33
34
35
36
37
38
39
40
41
42
43
44
45
46
47
48
49
50
51
52
53
54
55
56
57
58
For Peer Review
References
1. Berin MC, Sampson HA. Food allergy: an enigmatic epidemic. Trends Immunol 2013;34:390-397.
2. Prioult G, Nagler-Anderson C. Mucosal immunity and allergic responses: lack of regulation and/or lack of microbial stimulation? Immunol Rev 2005;206:204-218.
3. Atarashi K, Tanoue T, Shima T, Imaoka A, Kuwahara T, Momose Y, Cheng G, Yamasaki S, Saito T, Ohba Y, Taniguchi T, Takeda K, Hori S, Ivanov, II, Umesaki Y, Itoh K, Honda K. Induction of colonic regulatory T cells by indigenous Clostridium species. Science 2011;331:337-341.
4. Stefka AT, Feehley T, Tripathi P, Qiu J, McCoy K, Mazmanian SK, Tjota MY, Seo GY, Cao S, Theriault BR, Antonopoulos DA, Zhou L, Chang EB, Fu YX, Nagler CR.
Commensal bacteria protect against food allergen sensitization. Proc Natl Acad Sci USA 2014;111:13145-13150.
5. Lee J, Bang J, Woo HJ. Effect of orally administered Lactobacillus brevis HY7401 in a food allergy mouse model. J Microbiol Biotechnol 2013;23:1636-1640.
6. Liew FY, Girard JP, Turnquist HR. Interleukin-33 in health and disease. Nat Rev Immunol 2016;16:676-689.
7. Galand C, Leyva-Castillo JM, Yoon J, Han A, Lee MS, McKenzie ANJ, Stassen M, Oyoshi MK, Finkelman FD, Geha RS. IL-33 promotes food anaphylaxis in
4
5
6
7
8
9
10
11
12
13
14
15
16
17
18
19
20
21
22
23
24
25
26
27
28
29
30
31
32
33
34
35
36
37
38
39
40
41
42
43
44
45
46
47
48
49
50
51
52
53
54
55
56
57
58
For Peer Review
epicutaneously sensitized mice by targeting mast cells. J Allergy Clin Immunol 2016;138:1356-1366.
8. Muto T, Fukuoka A, Kabashima K, Ziegler SF, Nakanishi K, Matsushita K, Yoshimoto T. The role of basophils and proallergic cytokines, TSLP and IL-33, in cutaneously sensitized food allergy. Int Immunol 2014;26:539-549.
9. Levesque S, Dufresne PJ, Soualhine H, Domingo MC, Bekal S, Lefebvre B, Tremblay C. A side by side comparison of bruker biotyper and VITEK MS: utility of
MALDI-TOF MS technology for microorganism identification in a public health reference laboratory. PLoS One 2015;10:e0144878.
10. Saito M, Seki M, Iida K, Nakayama H, Yoshida S. A novel agar medium to detect hydrogen peroxide-producing bacteria based on the prussian blue-forming reaction.
Microbiol Immunol 2007;51:889-892.
11. Oka T, Rios EJ, Tsai M, Kalesnikoff J, Galli SJ. Rapid desensitization induces internalization of antigen-specific IgE on mouse mast cells. J Allergy Clin Immunol 2013;132:922-932.
12. Rankin AL, Mumm JB, Murphy E, Turner S, Yu N, McClanahan TK, Bourne PA, Pierce RH, Kastelein R, Pflanz S. IL-33 induces IL-13-dependent cutaneous fibrosis.
J Immunol 2010;184:1526-1535.
13. Ivanov, II, Atarashi K, Manel N, Brodie EL, Shima T, Karaoz U, Wei D, Goldfarb
4
5
6
7
8
9
10
11
12
13
14
15
16
17
18
19
20
21
22
23
24
25
26
27
28
29
30
31
32
33
34
35
36
37
38
39
40
41
42
43
44
45
46
47
48
49
50
51
52
53
54
55
56
57
58
For Peer Review
KC, Santee CA, Lynch SV, Tanoue T, Imaoka A, Itoh K, Takeda K, Umesaki Y, Honda K, Littman DR. Induction of intestinal Th17 cells by segmented filamentous bacteria. Cell 2009;139:485-498.
14. Zheng L, Chen Z, Itzek A, Ashby M, Kreth J. Catabolite control protein A controls hydrogen peroxide production and cell death in Streptococcus sanguinis. J Bacteriol 2011;193:516-526.
15. Abusleme L, Hong BY, Hoare A, Konkel JE, Diaz PI, Moutsopoulos NM. Oral microbiome characterization in murine models. Bio Protoc 2017;7:e2655.
16. Pridmore RD, Pittet AC, Praplan F, Cavadini C. Hydrogen peroxide production by Lactobacillus johnsonii NCC 533 and its role in anti-salmonella activity. FEMS Microbiol Lett 2008;283:210-215.
17. Palm NW, de Zoete MR, Cullen TW, Barry NA, Stefanowski J, Hao L, Degnan PH, Hu J, Peter I, Zhang W, Ruggiero E, Cho JH, Goodman AL, Flavell RA.
Immunoglobulin A coating identifies colitogenic bacteria in inflammatory bowel disease. Cell 2014;158:1000-1010.
18. Kamada N, Chen GY, Inohara N, Nunez G. Control of pathogens and pathobionts by the gut microbiota. Nat Immunol 2013;14:685-690.
19. Juncadella AC, Moss A. Fecal microbiota transplantation as a possible treatment of irritable bowel syndrome. Ann Transl Med 2017;5:506-507.
4
5
6
7
8
9
10
11
12
13
14
15
16
17
18
19
20
21
22
23
24
25
26
27
28
29
30
31
32
33
34
35
36
37
38
39
40
41
42
43
44
45
46
47
48
49
50
51
52
53
54
55
56
57
58
For Peer Review
20. Rivas MN, Burton OT, Wise P, Zhang YQ, Hobson SA, Lloret MG, Chehoud C, Kuczynski J, DeSantis T, Warrington J, Hyde ER, Petrosino JF, Gerber GK, Bry L, Oettgen HC, Mazmanian SK, Chatila TA. A microbiota signature associated with experimental food allergy promotes allergic sensitization and anaphylaxis. J Allergy Clin Immunol 2013;131:201-212.
21. Dubois D, Grare M, Prere MF, Segonds C, Marty N, Oswald E. Performances of the Vitek MS matrix-assisted laser desorption ionization-time of flight mass spectrometry system for rapid identification of bacteria in routine clinical microbiology. J Clin Microbiol 2012;50:2568-2576.
22. Mullineaux-Sanders C, Collins JW, Ruano-Gallego D, Levy M, Pevsner-Fischer M, Glegola-Madejska IT, Sagfors AM, Wong JLC, Elinav E, Crepin VF, Frankel G.
Citrobacter rodentium relies on commensals for colonization of the colonic mucosa.
Cell Rep 2017;21:3381-3389.
23. Zheng Y, Valdez PA, Danilenko DM, Hu Y, Sa SM, Gong Q, Abbas AR, Modrusan Z, Ghilardi N, de Sauvage FJ, Ouyang W. Interleukin-22 mediates early host defense against attaching and effacing bacterial pathogens. Nat Med 2008;14:282-289.
24. Soyka MB, Holzmann D, Basinski TM, Wawrzyniak M, Bannert C, Burgler S, Akkoc T, Treis A, Ruckert B, Akdis M, Akdis CA, Eiwegger T. The induction of IL-33 in the sinus epithelium and its influence on T-Helper cell responses. PLoS One
4
5
6
7
8
9
10
11
12
13
14
15
16
17
18
19
20
21
22
23
24
25
26
27
28
29
30
31
32
33
34
35
36
37
38
39
40
41
42
43
44
45
46
47
48
49
50
51
52
53
54
55
56
57
58
For Peer Review
2015;10:e0123163.
25. Bottcher MF, Haggstrom P, Bjorksten B, Jenmalm MC. Total and allergen-specific immunoglobulin A levels in saliva in relation to the development of allergy in infants up to 2 years of age. Clin Exp Allergy 2002;32:1293-1298.
26. Okai S, Usui F, Ohta M, Mori H, Kurokawa K, Matsumoto S, Kato T, Miyauchi E, Ohno H, Shinkura R. Intestinal IgA as a modulator of the gut microbiota. Gut Microbes 2017;8:486-492.
4
5
6
7
8
9
10
11
12
13
14
15
16
17
18
19
20
21
22
23
24
25
26
27
28
29
30
31
32
33
34
35
36
37
38
39
40
41
42
43
44
45
46
47
48
49
50
51
52
53
54
55
56
57
58
For Peer Review
Figure legends
Fig. 1 Establishment of food allergy model mice.
Time line of ovalbumin (OVA) sensitization and the induction of food allergy in mice (A).
The production of OVA-specific IgE antibodies in the sera of both groups of mice were measured by ELISA (B). OVA-specific food allergy symptoms were assessed by measuring the maximum change in rectal temperature after the oral administration of 50 mg of OVA.
Percentage changes after the oral administration of 50 mg of OVA based on before treatment are indicated. (C). Results are presented as the mean ± SD (n = 3), and they are representative of three independent experiments. N.D., not detected, *P < 0.05.
Fig. 2 Identification of fecal bacteria of ovalbumin (OVA)-specific food-allergic mice.
Feces from food-allergic (OVA/alum) and control (phosphate-buffered saline [PBS]/alum) mice were collected and analyzed using a VITEK MALDI-TOF-MS system. The numbers of identified fecal bacteria derived from each group of mice (OVA/alum group;
OVA/alum#1-OVA/alum#5, PBS/alum group; PBS/alum#1-PBS/alum#5) were indicated in the left bar graph. Results are presented as the mean ± SE (n = 5). *P < 0.05. The presence of Citrobacter sp. in all fecal samples from both groups of mice is indicated in the circle charts
on the right.
Fig. 3 In vitro interleukin-33 (il33) expression following stimulation by fecal bacteria isolated from ovalbumin (OVA)-induced allergic mice.
4
5
6
7
8
9
10
11
12
13
14
15
16
17
18
19
20
21
22
23
24
25
26
27
28
29
30
31
32
33
34
35
36
37
38
39
40
41
42
43
44
45
46
47
48
49
50
51
52
53
54
55
56
57
58
For Peer Review
Colon-26, a mouse colon epithelial cell line, was stimulated by four species of viable bacteria isolated from the feces of OVA allergic mice. il33 expression levels in each sample were normalized to those of a housekeeping gene (gapdh) and expressed as fold changes relative to that in a non-stimulated sample. Results are presented as the mean ± SD (n = 3), and they are representative of three independent experiments. *P < 0.05.
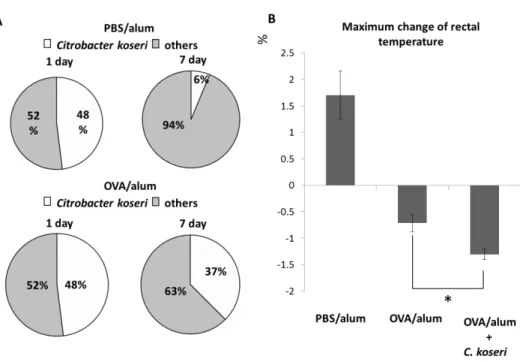
Fig. 4 Exacerbation of allergy symptoms by oral administration of Citrobacter.
After 1 week of antibiotic-mediated depletion of the endogenous microbiota, ovalbumin (OVA)/alum and phosphate-buffered saline (PBS)/alum mice were orally administered Citrobacter koseri (1 × 10
9colony-forming units per animal). Feces were collected 1 and 7 days after administration, and the resulting bacterial isolates were speciated using a VITEK MALDI-TOF-MS system. The occupancy rate of C. koseri among the identified fecal
bacteria was defined as the survival rate compared to that of the inoculum (A). The severities of OVA-specific allergic responses were compared by determining anaphylactic responses (assessed as the maximum change in rectal temperature following OVA challenge) in OVA/alum mice after the oral administration of C. koseri (B).
Fig. 5 The numbers of eosinophils infiltrated in the small intestines of ovalbumin
(OVA)/alum mice after the oral administration of Citrobacter koseri.
The numbers of eosinophils that infiltrated into the small intestine were visualized using May-Grünwald-Giemsa staining and evaluated via counting in a high-power field at ×400
4
5
6
7
8
9
10
11
12
13
14
15
16
17
18
19
20
21
22
23
24
25
26
27
28
29
30
31
32
33
34
35
36
37
38
39
40
41
42
43
44
45
46
47
48
49
50
51
52
53
54
55
56
57
58
For Peer Review
magnification. Tissue images are shown on the right. Arrows indicate eosinophils. The left graph shows the mean numbers of eosinophils calculated per three high-power fields.
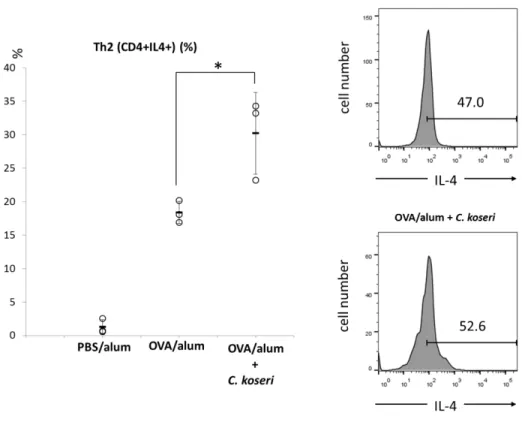
Fig. 6 Induction of Th2 cells in the small intestines of ovalbumin (OVA)/alum mice after the
oral administration of Citrobacter koseri.
Lymphocytes were obtained from the small intestinal lamina propria of OVA/alum mice and after the oral administration of C. koseri. The induction of CD4+IL-4+ (Th2) cells was analyzed by flow cytometry. In the left graph, circles represent separate mice, and lines denote means ± SDs (n = 3). The right histograms present the mean fluorescent intensities of IL4+ cells in OVA/alum and C. koseri-administrated OVA/alum mice. *P < 0.05.
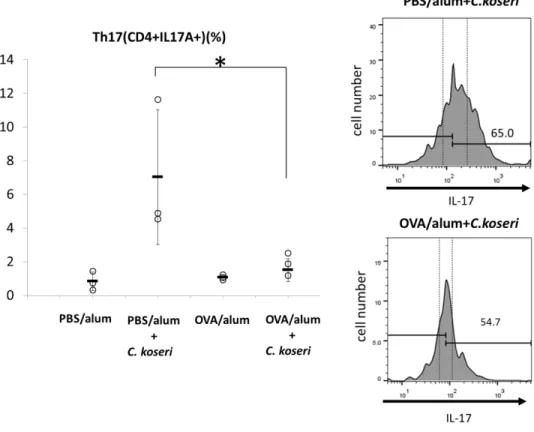
Fig. 7 Induction of Th17 cells in the small intestines of mice after the oral administration of Citrobacter koseri.
Lymphocytes were obtained from the small intestinal lamina propria of ovalbumin
(OVA)/alum and phosphate-buffered saline (PBS)/alum mice after the oral administration of C. koseri. Inductions of CD4+IL-17+ (Th17) cells were analyzed by flow cytometry. Right
histograms present the mean fluorescent intensities of CD4+IL17+ (Th17) cells in total lymphocytes derived from each group of mice. In the left graph, circles represent separate mice, and lines denote means ± SDs (n = 3). *P < 0.05.
Fig. 8 Quantification of hydrogen peroxide-producing bacteria and salivary IgA in the oral cavity of ovalbumin (OVA) allergic mice.
4
5
6
7
8
9
10
11
12
13
14
15
16
17
18
19
20
21
22
23
24
25
26
27
28
29
30
31
32
33
34
35
36
37
38
39
40
41
42
43
44
45
46
47
48
49
50
51
52
53
54
55
56
57
58
For Peer Review
Saliva was collected from OVA allergic (OVA/alum #1–#3) and control mice
(phosphate-buffered saline [PBS]/alum #1–#3) and inoculated onto three Prussian blue plates.
After an overnight anaerobic incubation, hydrogen peroxide-producing bacteria formed colonies with blue halos. The plates of OVA/alum #1 and PBS/alum #1 are presented (left).
The right graph shows the mean number of colonies with blue halos for the OVA/alum and PBS/alum groups (A). Percentage of detected genera of bacteria in both OVA/alum #1 and PBS/alum #1 were indicated by a horizontal bar graph (B). Saliva was collected from both OVA/alum and PBS/alum mice, and salivary IgA was quantified using an IgA ELISA kit (C).
Oral bacteria in the saliva of both groups of mice were stained using SYTO BC and goat anti-mouse IgA-Alexa Fluor
®647. The histogram presents the mean fluorescent intensities of IgA-Alexa Fluor
®647+ in SYTO BC+ oral bacteria from OVA/alum and PBS/alum mice.
Results are presented as the mean ± SD (n = 3), and they are representative of three independent experiments. *P < 0.05.
4
5
6
7
8
9
10
11
12
13
14
15
16
17
18
19
20
21
22
23
24
25
26
27
28
29
30
31
32
33
34
35
36
37
38
39
40
41
42
43
44
45
46
47
48
49
50
51
52
53
54
55
56
57
58
For Peer Review
Fig. 1 Establishment of food allergy model mice.
Time line of ovalbumin (OVA) sensitization and the induction of food allergy in mice (A). The production of OVA-specific IgE antibodies in the sera of both groups of mice were measured by ELISA (B). OVA-specific food allergy symptoms were assessed by measuring the maximum change in rectal temperature after the oral administration of 50 mg of OVA. Percentage changes after the oral administration of 50 mg of OVA based on before treatment are indicated. (C). Results are presented as the mean ± SD (n = 3), and they
are representative of three independent experiments. N.D., not detected, *P < 0.05.
254x190mm (150 x 150 DPI)
4
5
6
7
8
9
10
11
12
13
14
15
16
17
18
19
20
21
22
23
24
25
26
27
28
29
30
31
32
33
34
35
36
37
38
39
40
41
42
43
44
45
46
47
48
49
50
51
52
53
54
55
56
57
58
For Peer Review
Fig. 2 Identification of fecal bacteria of ovalbumin (OVA)-specific food-allergic mice.
Feces from food-allergic (OVA/alum) and control (phosphate-buffered saline [PBS]/alum) mice were collected and analyzed using a VITEK MALDI-TOF-MS system. The numbers of identified fecal bacteria
derived from each group of mice (OVA/alum group; OVA/alum#1-OVA/alum#5, PBS/alum group;
PBS/alum#1-PBS/alum#5) were indicated in the left bar graph. Results are presented as the mean ± SE (n
= 5). *P < 0.05. The presence of Citrobacter sp. in all fecal samples from both groups of mice is indicated in the circle charts on the right.
264x111mm (150 x 150 DPI)
4
5
6
7
8
9
10
11
12
13
14
15
16
17
18
19
20
21
22
23
24
25
26
27
28
29
30
31
32
33
34
35
36
37
38
39
40
41
42
43
44
45
46
47
48
49
50
51
52
53
54
55
56
57
58
For Peer Review
Fig. 3 In vitro interleukin-33 (il33) expression following stimulation by fecal bacteria isolated from ovalbumin (OVA)-induced allergic mice.
Colon-26, a mouse colon epithelial cell line, was stimulated by four species of viable bacteria isolated from the feces of OVA allergic mice. il33 expression levels in each sample were normalized to those of a housekeeping gene (gapdh) and expressed as fold changes relative to that in a non-stimulated sample.
Results are presented as the mean ± SD (n = 3), and they are representative of three independent experiments. *P < 0.05.
257x174mm (150 x 150 DPI)
4
5
6
7
8
9
10
11
12
13
14
15
16
17
18
19
20
21
22
23
24
25
26
27
28
29
30
31
32
33
34
35
36
37
38
39
40
41
42
43
44
45
46
47
48
49
50
51
52
53
54
55
56
57
58
For Peer Review
Fig. 4 Exacerbation of allergy symptoms by oral administration of Citrobacter.
After 1 week of antibiotic-mediated depletion of the endogenous microbiota, ovalbumin (OVA)/alum and phosphate-buffered saline (PBS)/alum mice were orally administered Citrobacter koseri (1 × 10⁹ colony- forming units per animal). Feces were collected 1 and 7 days after administration, and the resulting bacterial
isolates were speciated using a VITEK MALDI-TOF-MS system. The occupancy rate of C. koseri among the identified fecal bacteria was defined as the survival rate compared to that of the inoculum (A). The severities
of OVA-specific allergic responses were compared by determining anaphylactic responses (assessed as the maximum change in rectal temperature following OVA challenge) in OVA/alum mice after the oral
administration of C. koseri (B).
254x170mm (150 x 150 DPI)
4
5
6
7
8
9
10
11
12
13
14
15
16
17
18
19
20
21
22
23
24
25
26
27
28
29
30
31
32
33
34
35
36
37
38
39
40
41
42
43
44
45
46
47
48
49
50
51
52
53
54
55
56
57
58
For Peer Review
Fig. 5 The numbers of eosinophils infiltrated in the small intestines of ovalbumin (OVA)/alum mice after the oral administration of Citrobacter koseri.
The numbers of eosinophils that infiltrated into the small intestine were visualized using May-Grünwald- Giemsa staining and evaluated via counting in a high-power field at ×400 magnification. Tissue images are
shown on the right. Arrows indicate eosinophils. The left graph shows the mean numbers of eosinophils calculated per three high-power fields.
227x195mm (150 x 150 DPI)
4
5
6
7
8
9
10
11
12
13
14
15
16
17
18
19
20
21
22
23
24
25
26
27
28
29
30
31
32
33
34
35
36
37
38
39
40
41
42
43
44
45
46
47
48
49
50
51
52
53
54
55
56
57
58
For Peer Review
Fig. 6 Induction of Th2 cells in the small intestines of ovalbumin (OVA)/alum mice after the oral administration of Citrobacter koseri.
Lymphocytes were obtained from the small intestinal lamina propria of OVA/alum mice and after the oral administration of C. koseri. The induction of CD4+IL-4+ (Th2) cells was analyzed by flow cytometry. In the
left graph, circles represent separate mice, and lines denote means ± SDs (n = 3). The right histograms present the mean fluorescent intensities of IL4+ cells in OVA/alum and C. koseri-administrated OVA/alum
mice. *P < 0.05.
238x195mm (150 x 150 DPI)
4
5
6
7
8
9
10
11
12
13
14
15
16
17
18
19
20
21
22
23
24
25
26
27
28
29
30
31
32
33
34
35
36
37
38
39
40
41
42
43
44
45
46
47
48
49
50
51
52
53
54
55
56
57
58
For Peer Review
Fig. 7 Induction of Th17 cells in the small intestines of mice after the oral administration of Citrobacter koseri.
Lymphocytes were obtained from the small intestinal lamina propria of ovalbumin (OVA)/alum and phosphate-buffered saline (PBS)/alum mice after the oral administration of C. koseri. Inductions of CD4+IL-
17+ (Th17) cells were analyzed by flow cytometry. Right histograms present the mean fluorescent intensities of CD4+IL17+ (Th17) cells in total lymphocytes derived from each group of mice. In the left
graph, circles represent separate mice, and lines denote means ± SDs (n = 3). *P < 0.05.
242x197mm (150 x 150 DPI)