Who Uses FTAs?
著者 Hayakawa Kazunobu, Hiratsuka Daisuke, Shiino Kohei, Sukegawa Seiya
権利 Copyrights 日本貿易振興機構(ジェトロ)アジア
経済研究所 / Institute of Developing
Economies, Japan External Trade Organization (IDE‑JETRO) http://www.ide.go.jp
journal or
publication title
IDE Discussion Paper
volume 207
year 2009‑07‑01
URL http://hdl.handle.net/2344/851
INSTITUTE OF DEVELOPING ECONOMIES
IDE Discussion Papers are preliminary materials circulated to stimulate discussions and critical comments
Keywords: FTA; micro data; ASEAN JEL classification: F15; F53; O53
* Corresponding author: Kazunobu Hayakawa. Address: Economic Integration Studies Group, Inter-Disciplinary Studies Center, Institute of Developing Economies, 3-2-2 Wakaba, Mihama-ku, Chiba-shi, Chiba 261-8545 Japan. Phone: 81-43-299-9754; Fax: 81-43-299-9763. E-mail:
IDE DISCUSSION PAPER No. 207
Who Uses FTAs?
Kazunobu HAYAKAWA*, Daisuke HIRATSUKA, Kohei SHIINO,
Seiya SUKEGAWA July 2009
Abstract
It is noted that utilization of AFTA is low by international standards. In order to clarify the reasons for such low utilization, this paper investigates what kinds of Japanese affiliates in ASEAN are more likely to use FTAs in their exporting, by employing unique affiliate-level data.
Our findings are as follow. First, the larger the affiliate is, or the more diversified its procurements’ origins are, the more likely it is to utilize an FTA scheme in its exporting. Second, affiliates exporting actively to developing countries are more likely to use FTAs than those exporting to developed countries. Third, there are clear differences in FTA utilization depending on affiliates’ locations and sectors. These results afford a clue to the reasons for the low FTA utilization in East Asia.
The Institute of Developing Economies (IDE) is a semigovernmental, nonpartisan, nonprofit research institute, founded in 1958. The Institute merged with the Japan External Trade Organization (JETRO) on July 1, 1998.!!
The Institute conducts basic and comprehensive studies on economic and related affairs in all developing countries and regions, including Asia, the Middle East, Africa, Latin America, Oceania, and Eastern Europe.
The views expressed in this publication are those of the author(s). Publication does not imply endorsement by the Institute of Developing Economies of any of the views expressed within.
INSTITUTE OF DEVELOPING ECONOMIES (IDE), JETRO 3-2-2, WAKABA,MIHAMA-KU,CHIBA-SHI
CHIBA 261-8545, JAPAN
©2009 by Institute of Developing Economies, JETRO
No part of this publication may be reproduced without the prior permission of the
Who Uses FTAs?
Kazunobu HAYAKAWA# §
Institute of Developing Economies, Japan External Trade Organization, Japan Daisuke HIRATSUKA
Institute of Developing Economies, Japan External Trade Organization, Japan Kohei SHIINO
Overseas Research Department, Japan External Trade Organization, Japan Seiya SUKEGAWA
Overseas Research Department, Japan External Trade Organization, Japan
Abstract: It is noted that utilization of AFTA is low by international standards. In order to clarify the
reasons for such low utilization, this paper investigates what kinds of Japanese affiliates in ASEAN are more likely to use FTAs in their exporting, by employing unique affiliate-level data. Our findings are as follow. First, the larger the affiliate is, or the more diversified its procurements’ origins are, the more likely it is to utilize an FTA scheme in its exporting. Second, affiliates exporting actively to developing countries are more likely to use FTAs than those exporting to developed countries. Third, there are clear differences in FTA utilization depending on affiliates’ locations and sectors. These results afford a clue to the reasons for the low FTA utilization in East Asia.
Keywords: FTA; micro data; ASEAN JEL Classification: F15; F53; O53
# Corresponding author: Kazunobu Hayakawa. Address: Economic Integration Studies Group, Inter-Disciplinary Studies Center, Institute of Developing Economies, 3-2-2 Wakaba, Mihama-ku, Chiba-shi, Chiba 261-8545 Japan. Phone: 81-43-299-9754; Fax: 81-43-299-9763. E-mail:
§ This research was conducted as a part of the project of the Economic Research Institute for ASEAN and East Asia (ERIA) known as “Deepening East Asian Economic Integration.” We thank Mr. Hidehiro Ishiura and Mr. Mitsutoshi Okabe for their arrangement of the micro data used in this study. The opinions expressed in this paper are the sole responsibility of the authors and do not reflect the views of ERIA or the Japan External Trade Organization.
1. Introduction
Free Trade Agreements (FTAs) have proliferated in East Asia. Currently, there are more than thirty Regional Trade Agreements (RTAs) enforced involving East Asia, of which fourteen are intra-regional. Regionalism in East Asia has been led by ASEAN in particular; the ASEAN Free Trade Area (AFTA) is an agreement that will eliminate import duties on all products placed in the normal track in the ASEAN-6 (Brunei, Indonesia, Malaysia, the Philippines, Singapore, and Thailand). The new member countries, Cambodia, Laos, Myanmar, and Vietnam, will also eliminate tariffs in the normal track by 2015. Furthermore, regionalism in the ASEAN+6 region is exacerbating the hub-and-spoke FTA structure with ASEAN as the hub and other East Asian countries as the spokes; currently, a total of six ASEAN+1 FTAs are enforced or are under negotiation.1
However, such proliferation does not automatically increase the number of international transactions that utilize FTA schemes. In reality, all firms do not necessarily use the FTA scheme in their exporting or importing. Administrative costs for securing certificates of origin (COO), which certify that the exported goods were locally produced, play a key role in firms’ choice to use FTAs. In order to secure the COO for the goods they export, firms must prepare all documents required by the investigating authorities. Since such document preparation entails work that creates fixed costs, only firms that earn adequate operating profits to cover the fixed costs will choose to use an FTA scheme. In East Asia, there has been a tendency toward incremental increase in the number of FTAs which feature so-called rules of origin (ROO) that adopt the optional criterion or change in tariff classification criterion as criteria to determine the origin of goods.2 On the other hand, the “third-party certificate system” is often adopted as a procedure to certify origin; this is a system wherein third parties such as a relevant ministry or a chamber of commerce take a role in issuing a certificate of origin after reviewing applications filed by firms.3 Such ROO and procedures to certify origin result in a certain amount of fixed costs for firms using FTAs.
1 In this paper, FTA, RTA, and Economic Partnership Agreement (EPA) are used interchangeably.
2 There are four main types of criteria to determine the origin of goods: 1) the value-added content criterion, 2) the change in tariff classification criterion, 3) the optional criterion that allows firms a choice of whether to use the value-added content criterion or the change in tariff classification criterion, and 4) the dual criterion which requires firms to use both the value-added content criterion and the change in tariff classification criterion. For details of each criterion, see the WTO website.
3 There are three main procedures to certify the origin of goods: 1) the third-party certificate system, 2) the self-certificate system, and 3) a hybrid system of third-party certification and self-certification.
For details of each system, see the WTO website.
Particularly in East Asia, it is noted that the rate of FTA utilization remains at a fairly low level. Hiratsuka et al. (2008) point out that, to begin with, Japanese firms and their affiliates operating in ASEAN are not well aware of FTAs. The utilization of AFTA measured by the ratio of AFTA administrative records to total exports was low, at around 15% to 20%, during the period 2003-06. The utilization rate on the import side was around 11% to 16%, lower than the corresponding rate for the export side.
Furthermore, the utilization of AFTA observed for both exports and imports is low by international standards. Kohpaiboon (2008) pointed out that the AFTA utilization rates were lower than those of NAFTA; the NAFTA utilization rate by Mexican exports to the United States was around 60% in 2004-05. The utilization rate by Chilean exports to the United States was around 55% to 56% in 2005-06 (James 2006).
Against this backdrop, the aim of this paper is to clarify the reasons for the low rate of FTA utilization in East Asia by investigating what kinds of Japanese affiliates in ASEAN are more likely to use FTAs in their exporting. To the best of our knowledge, there are few previous studies investigating such firms’ attributes, perhaps due to the limited data.4 There are three important trial papers. Kohpaiboon (2008) analyzed AFTA implementation by Thai exporters for the period 2003-06, by using AFTA administrative records (collected by the Bureau of Preferential Trade, Department of Foreign Trade, Ministry of Commerce). He found that large conglomerate firms or firms in industries with a thin margin between general and preferential tariff rates tend to utilize the AFTA scheme. While Kohpaiboon (2008) presents sector-level analysis (HS four-digit), Takahashi and Urata (2008, 2009) examine FTA usage by Japanese firms at the firm level by means of a questionnaire survey. Their findings are as follow. First, large firms are more likely to use FTA schemes, as found by Kohpaiboon (2008) at the sector level.
Second, firms with close trade and FDI relationships with FTA partner countries tend to use FTA schemes.
In this paper, we employ a unique dataset. The Japan External Trade Organization (JETRO) has carried out an ongoing survey of Japanese affiliates operating in Asia for 22 years, since 1987. The survey was initially targeted at manufacturing companies, but in the wake of the growth of the service sector, inclusion of non-manufacturing companies began in 2007 (the 21st survey). The survey, named the “Survey of Japanese-Affiliated Firms in ASEAN, India, and Oceania,” has included questions on the affiliates’ FTA use particularly in the last three years. For example, it asks whether or not the affiliate currently uses any existing bilateral/multilateral FTAs or EPAs for
4 The impact of FTA on trade is often evaluated by estimating the well-known gravity equation. See, for example, Endoh (1999) and Baier and Bergstrand (2007).
import or export activities. In the survey, moreover, the basic information on affiliates’
activities, such as the breakdown of their export destinations and their procurement sources, is also collected. Therefore, this survey enables us to explore more characteristics which affect affiliates’ FTA usage than did the previous surveys.
Particularly in this paper, we mainly examine those attributes of firms which encourage use of FTAs in exporting. Such detailed analyses will contribute to the enhancement of our understanding of the mechanics of firms’ FTA use.
The organization of this paper is as follows. Section 2 introduces our dataset and presents an overview of Japanese affiliates’ FTA use in Asia. In Section 3, we present our hypotheses on the relationship between firms’ characteristics and their FTA use. Our empirical framework for examining such hypotheses is presented in Section 4. The empirical results are reported in Section 5, and our conclusion is presented in Section 6.
2. The Utilization of FTAs by Japanese Affiliates in East Asia
Employing the 22nd survey, this section introduces the usage of FTAs by Japanese affiliates. The survey, which was sent to 5,107 Japanese affiliates operating in the above thirteen countries, received 1,852 valid responses (36.3%). Of these, 1,354 were from ASEAN7 countries, 235 from Southeast Asia (SE Asia), and 263 from Oceania.
Although our main analysis presented in the following sections is devoted to usage of the FTAs for exporting in ASEAN, this section also refers, for the sake of completeness, to usage of FTAs for importing in ASEAN, SE Asia, and Oceania. We first examine FTA use in exporting and then in importing. Bottlenecks in firms’ FTA use are also noted.
Table 1 reports Japanese affiliates’ use of FTAs in exporting by their location.
From this table, we can see that 23.0% of Japanese affiliates with export operations in ASEAN nations take advantage of FTAs. The highest level of FTA usage is in Singapore (43.2%), followed by Indonesia (35.9%), and Thailand (22.5%). In contrast, in the Philippines and Vietnam, the ratio is around 10%. When we combine “already using” and “considering use” scores, the resulting shares for “firms interested in FTA/EPA” add up to 46.3%, nearly half, for ASEAN as a whole. High scorers include Singapore (59.1%), Indonesia (55.5%), and Thailand (49.6%).
=== Table 1 ===
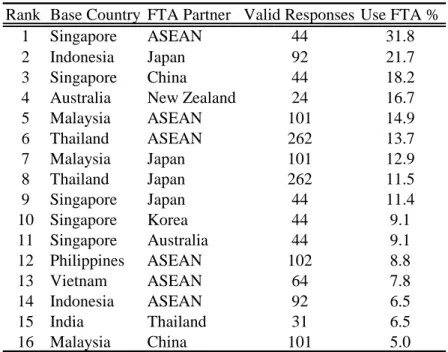
Let us take a look at exporters’ use of particular FTAs when ASEAN members are signatories (Table 2). The table reports only the agreements for which we have valid answers from 20 or more firms and usage rates of 5% or more. The most widely used FTA around the Pacific Rim is Singapore’s AFTA. Of Japanese manufacturing firms in Singapore, 31.8% make use of this agreement. The next most commonly used agreement, at 21.7%, is JIEPA, the EPA concluded between Japan and Indonesia. JIEPA went into effect in July 2008, and despite the fact that this survey was conducted only four months later, one firm in five was already utilizing it. The third most commonly used agreement, utilized by 18.2% of Japanese firms in Singapore, is ACFTA, the ASEAN-China FTA.
=== Table 2 ===
The JETRO survey also asks firms about their reasons for not utilizing FTAs/EPAs, and the results are reported in Table 3. The leading reason in the ASEAN region is that “importers are exempted from tariffs” (123 firms, 37.6%). As mentioned later, this also becomes a major reason for not using FTAs in importing. The second reason is that “there are no FTAs/EPAs with the countries to which we export” (75 firms, 22.9%). Third, some companies state that “tariffs are already low in the countries to which we export” (65 firms, 19.9%). As mentioned in the introductory section, when exporters make use of FTAs, they must secure the COO, which entails an unavoidable additional cost burden for certificate issuance, personnel, and processing. Thus, as explored in the next section, only when the preferential tariff margin gained by using an FTA/EPA is greater than such burden will firms consider utilizing FTAs. Indeed, of the 390 manufacturing firms in Asia and Oceania, the largest proportion (28.2%) state that they would consider using an FTA with a preferential tariff margin in the 3% to 5%
range (according to the 22nd Survey of Japanese-Affiliated Firms in ASEAN, India, and Oceania).
=== Table 3 ===
Turning to imports, we see in Table 1 that 19.7% of Japanese affiliates with import operations in ASEAN nations utilize FTAs for imports, slightly less than the 23.0% for exports. Use of FTAs for imports is especially prevalent in Oceania (33.3%), and next come firms doing business in Indonesia (28.7%) and Thailand (25.3%).
Combining firms considering making use of FTAs with firms already taking advantage
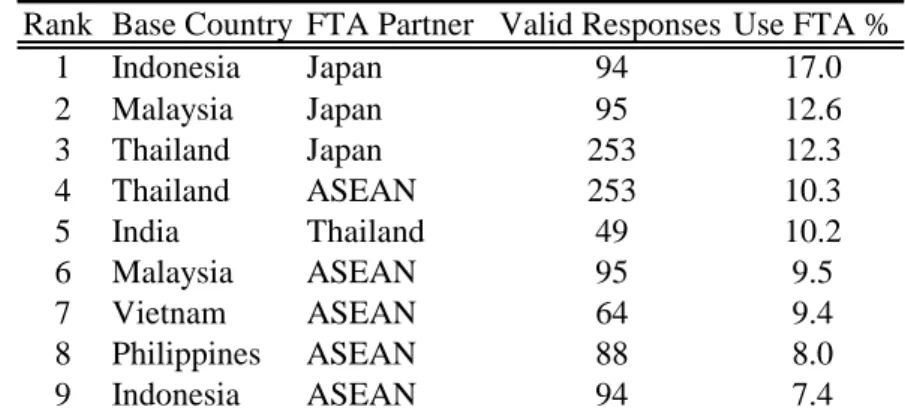
of FTAs, we see a slightly different result, with the proportion rising to about 45% for ASEAN as a whole. Table 4 reports that the agreement most often utilized is JIEPA, the Japan-Indonesia FTA, at 17%, followed by Japan’s EPA with Malaysia and Thailand.
Thus, the top three are EPAs with Japan, and most of the other agreements are within the ASEAN Free Trade Area.
=== Table 4 ===
As shown in Table 5, the leading reason why FTAs are neither employed nor considered in importing is that, in the ASEAN region, investment incentive schemes have already eliminated tariffs, and this reason is cited by 157 (48.9%) of the 351 firms that responded to the question. Actually in many ASEAN countries, incentives to promote inbound investment reduce or eliminate tariffs on materials or parts imported for assembly and exported as finished products. In these cases, there is no need to make use of FTAs/EPAs. Other reasons mentioned include “low levies on products sold domestically” (13.4%) and “no FTAs/EPAs with the countries from which we import”
(13.1%).
=== Table 5 ===
3. Hypotheses
This section presents our hypotheses, which are empirically tested in the following sections, on what kinds of firms use an FTA scheme in their exporting. For firms to use an FTA in exporting, two conditions must be satisfied. One is that the total profit from using the FTA must be greater than from not using it. If firms choose to use an FTA scheme, then they can export their products with the FTA preferential tariff rates, which are mostly zero percent. Otherwise, they must pay the general tariff rates, which are mostly most-favored nation rates (MFN rates). Use of the FTA scheme, however, will incur a certain level of administrative costs as mentioned in the introductory section, which become additional fixed costs for the companies. Therefore, for firms to use FTAs, it is necessary that the margin between FTA rates and general rates be sufficiently large compared with the additional fixed costs, i.e., administrative costs. This argument leads immediately to the following testable hypotheses.
Hypothesis 1. Firms that export to countries with the lower general tariff rates are less
likely to use FTAs.
Another condition is that total profits in the case of FTA use must be non-negative. That is, firms’ operating profits have to exceed the fixed costs, including the above-mentioned administrative costs. While the low preferential tariff rates increase the operating profits, there are also general elements affecting them.
Hypothesis 2. The more productive firms are more likely to use FTAs in their exporting.
If firms’ products are well differentiated, their operating profits are positively related to their productivity (see, for example, Baldwin et al., 2003, Appendix 2.A). Therefore, firms with high productivity can afford to pay administrative costs and are thus likely to use an FTA scheme.
Hypothesis 3. The more diversified the origins of firms’ procurements are, the more likely the firms are to use FTAs in their exporting.
This is the well-known love-of-variety nature in the procurement of intermediate products. Suppose that intermediate products are differentiated, and further, that firms prefer more varieties of intermediate products; the diversified origins of firms’
procurements lowers their input costs, resulting in the higher operating profits. In addition to this benefit from the horizontal nature of procurement, its diversified origins may yield benefits from vertical division of labor, i.e., international fragmentation.5 That is, input costs are lowered by sourcing each intermediate product from a country with location advantages in producing it. In sum, the more diversified the origins of firms’ procurements are, the lower their input costs are, and thus the larger their operating profits are. However, more diversified origins might substantially raise the administrative costs for FTA use. In certifying that the exported goods were locally produced, exporters must prepare a list of materials inputted for producing them. To complete the list, exporters need to request each materials supplier to issue an invoice or contract documents. Thus, higher document preparation costs are obviously entailed in sourcing materials from a larger number of suppliers. As a result, highly diversified
5 For a theoretical analysis on international fragmentation, see Arndt and Kierzkowski (2001) and Cheng and Kierzkowski (2001). For an empirical investigation on fragmentation in East Asia, see Kimura (2006).
origins of procurements could result in fixed costs large enough to discourage firms from using an FTA scheme.
4. Empirical Framework
This section explains the methodology used to investigate the three hypotheses presented in the previous section. The source of our data for estimation, as noted in Section 2, is the “Survey of Japanese-Affiliated Firms in ASEAN, India, and Oceania”
for 2006, 2007, and 2008. For our empirical analysis, we specify our index function as:
Γi = xi’β0 + εi, where εi ~ N(0, 1) and xi = (Exporti, Scalei, Variancei).
Γi is the difference in affiliate i’s total profits when comparing cases of FTA use and non-use (a time script is omitted). The observation rule for affiliate i is formalized as:
⎪⎩
⎪⎨
⎧
≥ Γ
<
= Γ
0 1
0 0
i i i
if if y
,
where yj is an indicator variable taking unity if affiliate j uses an FTA scheme in exporting and zero otherwise. As a result, our probability model by the probit is given by:
Pr (yi =1| xi) = Φ (xi’β),
where Φ(•) is the standard cumulative normal probability distribution. From our sample, we exclude the affiliates that answered “considering use” for the data item of FTA use in exporting because of their ambiguous standpoint in the choice of FTA use.
We introduce three kinds of affiliate characteristic variables. First, we examine the impact of the margin between FTA and general tariff rates in the countries to which affiliates export their products (Hypothesis 1). To this end, three kinds of FTAs in which a significant number of ASEAN countries are included as members are taken into consideration. Specifically, we introduce a vector Export, of which the elements are shares of exports to the other ASEAN countries (AFTA), exports to China (ASEAN-China FTA), and exports to Japan (bilateral FTA with Japan), in total sales.
For example, since general tariff rates are already low in Japan, all other things being equal, affiliates which export mainly to Japan will not be likely to use an FTA scheme.
On the other hand, those which export to China are obviously expected to use it, due to their high general tariff rates.
Second, we examine Hypothesis 2 by introducing Scalei, which is a log of total employment. Our dataset does not have any convincing productivity measures, i.e.,
value-added and so on, and even total sales are not available. From the theoretical point of view, firms’ productivity is not necessarily related positively to their employment;
however, from the empirical point of view, the productivity (TFP) usually has a positive correlation with the total employment (see, for example, Fukao and Kwon, 2006). Thus, the use of employment as a proxy for productivity may be plausible to some extent. As a result, the larger the affiliates’ scale, the more likely they would be to utilize an FTA scheme.
Next, in order to explore Hypothesis 3, we introduce Variancei, which captures a variety of sources of intermediate inputs. Our dataset has the shares of local procurement, imports from other ASEAN countries, imports from Japan, imports from other Asian countries excluding ASEAN and Japan, imports from the US, imports from Europe, and imports from other countries. The variable Variancei is constructed as a variance among the above seven categories. The love-of-variety nature of intermediate products and the benefits from vertical division of labor reduce affiliates’ input costs.
This reduction leads to higher operating profits and thus the positive estimator in Variancei. On the other hand, if the diversified sources of inputs result in a remarkable rise in the administrative costs for FTA use, the coefficient for Variancei may be estimated to be negative.
So far, we have not taken care of the ROO explicitly in the previous sections. As mentioned before, for the sake of FTA use, affiliates must secure the ROO of their goods. In order to control the extent of restrictiveness of ROO, we introduce both country fixed effects and sector fixed effects (or country-sector fixed effects) because the ROO differs according to not only FTAs but also sectors. Several other elements are also controlled by such fixed effects, such as differences in wages among countries, which affect firms’ operating profits. The differences in efficiency in obtaining the COO among countries are also captured by the estimates of the fixed effects. Moreover, those may include the differences in general tariff rates among sectors.
Before reporting estimation results, we should eliminate certain kinds of affiliates from our sample. First of all, we restrict our sample only to exporting affiliates because affiliates are unable to use FTA if they do not export.6 One may say that affiliates should be further excluded if they do not export to countries that have concluded FTAs with their host countries. To put it the other way around, affiliates should not be included if they export only to countries that have not concluded FTAs with their host countries.
The robustness checks on this issue are conducted later.
6 We also conduct some data cleaning. For example, we eliminate observations in which the sum of export shares plus the share of the supply to the local market exceeds 100%.
5. Empirical Results
In this section, we report the results of our empirical analyses. Basic statistics are provided in Table 6, and our probit results are presented in Table 7. The columns (I) and (II) in Table 7 show our baseline results, which are basically consistent with our expectations. The former includes country fixed effects and sector fixed effects separately, while the latter includes the country-sector fixed effects.
=== Tables 6 &7 ===
There are three points that are noteworthy. First, coefficients for Scale are estimated to be significantly positive, indicating that the larger the affiliate, the more likely it is to utilize an FTA scheme in its exporting. This result is consistent with that in Takahashi and Urata (2008, 2009). Second, coefficients for Variance are estimated to be significantly negative, showing benefits from the love-of-variety in inputs and/or from vertical division of labor exceed the rise in the administrative costs due to the diversion of procurement origins. In particular, it is interesting that firms which are actively engaged in international fragmentation are likely to use an FTA scheme in their exporting. Third, coefficients for export shares are all estimated to be significant and show an interesting order in their magnitude. The largest magnitude can be found in the coefficient for ExCHINA, while the lowest magnitude in that for ExJAPAN. As a result, we can say that firms exporting actively to developing countries are more likely to use FTAs than those exporting to developed countries. Furthermore, this order is consistent with the order in general tariff rates. In China, for example, since the tariff margin is large, affiliates can enjoy large benefits from using an FTA scheme in their exporting to China.
The results of fixed effects in the estimation of column (I) might be worth reporting particularly for policy makers. Column (I) in Table 8 reports the results of country fixed effects. We find that affiliates in the Philippines and Vietnam are less likely to utilize FTA schemes, while the most active use of FTA is found in affiliates in Singapore. Due to the fact that Singapore provides the most efficient procedures for obtaining the COO, these results might suggest that such procedures in the Philippines and Vietnam are more cumbersome than those in other ASEAN countries.7 The results
7 Also, this may reflect only the availability of FTA schemes for affiliates. Indeed, Singapore has concluded the largest number of FTAs among ASEAN countries, while there are relatively few FTAs
of sector fixed effects are reported in column (I) in Table 9. From this table, we can see that FTAs are less likely to be utilized in electric parts and components and precision machinery. This result is most likely due to the low general tariff rates in those sectors.
Indeed, the general tariff rates for most IT products are low or zero under the Information Technology Agreement (ITA).
=== Tables 8 & 9 ===
We conduct some robustness checks. First, as mentioned before, affiliates are excluded if they do not export to countries that conclude FTAs with their host countries.
Here, we again pay attention only to three kinds of FTAs; AFTA, ASEAN-China FTA, and bilateral FTAs with Japan. Specifically, we restrict our sample only to affiliates with positive exports to other ASEAN countries or China. Furthermore, affiliates in Singapore and Malaysia are also included if they export to Japan. Affiliates in Thailand and Indonesia are not excluded if they have positive exports to Japan in 2008.
The results produced by these restricted samples are reported in columns (III) and (IV) in Table 7. The coefficients for Scale and Variance are again significantly estimated with the expected signs. However, the results in export shares show little change. In particular, the coefficients for ExASEAN turn out to be insignificant. The results of fixed effects in (III) are reported in the corresponding columns in Tables 8 and 9, and the result in Vietnam is insignificant. Affiliates in the automobile industry are likely to use an FTA scheme in their exporting. Since there remain relatively high general tariff rates on automobiles, the contrasting results between electric parts and automobiles supports our previous view that results in the sector dummy depend heavily on the level of general tariff rates.
Second, in addition to such restrictions, we further take care of investment incentive schemes. As mentioned in Section 2, the major reason for not utilizing FTAs in ASEAN is that “importers are exempted from tariffs” (37.6%). If affiliates’ trading partners enjoy investment incentive schemes, such affiliates do not need to use FTAs in their exporting. Furthermore, such importers’ use of the incentive schemes is mostly out of the control of the exporters. Thus, such affiliates are dropped from our sample for the analysis of the exporters’ choice of FTA use. To this end, we use the data item on
“reasons for not using FTAs,” and we drop affiliates that answered “tariffs are exempted in the importer side” for that item.
in the Philippines and Vietnam compared with other ASEAN countries in the sample.
The results are reported in columns (V) and (VI) in Table 7. Scale and Variance have qualitatively the same results as before. The significant estimates in ExASEAN would indicate that active use of investment incentive schemes in ASEAN leads to the underestimation of the coefficients for ExASEAN in columns (III) and (IV); however, the magnitude in ExASEAN is still lower than that in ExJAPAN. This may be due to the inclusion of exports to Singapore, where general tariff rates, being zero for almost all products, are lower than those in Japan. The results of fixed effects in (V) are reported in the corresponding columns in Tables 8 and 9. Two points are noteworthy here. First, there is the robust result that affiliates in the Philippines are less likely to use an FTA scheme. Second, active use of investment incentive schemes in ASEAN leads to the underestimation of the fixed effect’s estimate in the automobile parts sector. Similarly, the estimate in electric parts decreases remarkably, but it is still negatively significant due to the low tariffs in the sector. These results imply that investment incentive schemes play an alternative role in the choice of FTA use.
6. Concluding Remarks
It is noted that utilization of AFTA is low by international standards. In order to clarify the reasons for such low utilization, this paper investigates what kinds of Japanese affiliates in ASEAN are more likely to use FTAs in their exporting. For this purpose, we employ a unique dataset from a survey of Japanese affiliates operating in Asia conducted by the Japan External Trade Organization. Our findings are as follow.
First, the larger the affiliate is, or the more diversified the origins of its procurements, the more likely it is to utilize an FTA scheme in its exporting. Second, affiliates that export actively to developing countries are more likely to use FTAs than those exporting to developed countries. Third, there are clear differences in FTA utilization depending affiliates’ locations and sectors.
These results suggest some reasons why FTA utilization in East Asia is low by international standards. One reason is the existence of fixed costs, for example the administrative costs due to the cumbersome procedures for obtaining the COO. The significant results in Scale and Variance imply the existence of a certain level of such fixed costs. If fixed costs are high in ASEAN compared to other regions, this would constitute a reason for low utilization of FTAs. Another reason is that the major trade in ASEAN is in electric parts and components, for which general tariff rates are already low. Consequently, it is obviously important for governments, particularly in the Philippines, to reduce the fixed costs entailed in FTA use. Moreover, the results in
Variance highlight the importance of reducing the service link costs, such as time consumed by customs formalities. The reduction of service link costs is one key to the development of international fragmentation, which encourages firms to utilize FTA schemes.
References
Arndt, S. W. and H. Kierzkowski, 2001, Fragmentation: New Production Patterns in the World Economy. Oxford University Press, Oxford.
Baier, S.L. and Bergstrand, J.H., 2007, Do Free Trade Agreements Actually Increase Members’ International Trade?, Journal of International Economics, 71(1):
72-95.
Baldwin, R., Forslid, R., Martin, P., Ottaviano, G., and Robert-Nicoud, F., 2003, Economic Geography and Public Policy, Princeton University Press, Princeton.
Endoh, M., 1999, Trade Creation and Trade Diversion in the EEC, the LAFTA and the CMEA: 1960-1994, Applied Economics, 31(2): 207-216.
Fukao, K. and Kwon, H., 2006, Why Did Japan’s Tfp Growth Slow Down in the Lost Decade? An Empirical Analysis Based on Firm-Level Data of Manufacturing Firms, Japanese Economic Review, 57(2): 195-228.
Hiratsuka, D., Isono, I., Sato, H., and Umezaki, S., 2008, Escaping from FTA Trap and Spaghetti Bowl Problem in East Asia: An Insight from the Enterprise Survey in Japan, In: Soesastro, H. (Eds.). Deepening Economic Integration in East Asia:
The ASEAN Economic Community and Beyond, ERIA Research Project Report 2007 No. 1-2, Chapter 16.
James, W., 2006, Rules of Origin in Emerging Asia-Pacific Preferential Trade Agreements: Will PTAs Promote Trade and Development, Asia-Pacific Research and Training Network on Trade Working Paper Series, No.19.
Jones, R. W., Kierzkowski, H., 1990. The Role of Services in Production and International Trade: a Theoretical Framework. In: Jones, R. W., Krueger, A. O.
(Eds.). The Political Economy of International Trade: Essays in Honor of R. E.
Baldwin, Oxford: Basil Blackwell: 31-48.
Kimura, F., 2006, International Production and Distribution Networks in East Asia:
Eighteen Facts, Mechanics, and Policy Implication, Asian Economic Policy Review, 1: 326–44.
Kohpaiboon, A., 2008, Export Creation of AFTA and the Response of the Private Sector: Evidence from Thai Manufacturing, mimeograph.
Takahashi, K. and Urata, S., 2008, On the Use of FTAs by Japanese Firms, RIETI Discussion Paper, 08-E-002.
Takahashi, K. and Urata, S., 2009, On the Use of FTAs by Japanese Firms: Further Evidence, RIETI Discussion Paper, 09-E-028.
Table 1. Utilization of FTAs
Use Intend No intention Use Intend No intention
to use to use to use to use
ASEAN 23.0 23.3 53.7 19.7 24.4 55.9
Indonesia 35.9 19.6 44.6 28.7 29.8 41.5
Singapore 43.2 15.9 40.9
Thailand 22.5 27.1 50.4 25.3 26.9 47.8
Philippines 11.8 24.5 63.7 8.0 19.3 72.7
Vietnam 9.4 26.6 64.1 12.5 25.0 62.5
Malaysia 23.8 17.8 58.4 20.0 19.0 61.1
SW Asia 18.0 18.0 63.9 12.5 22.5 65.0
India 9.7 22.6 67.7 16.3 28.6 55.1
Oceania 20.5 15.4 64.1 33.3 11.1 55.6
Exporter Importer
Source: Survey of Japanese-Affiliated Firms in ASEAN, India, and Oceania.
Table 2. Utilization of FTAs by FTAs: Exports
Rank Base Country FTA Partner Valid Responses Use FTA %
1 Singapore ASEAN 44 31.8
2 Indonesia Japan 92 21.7
3 Singapore China 44 18.2
4 Australia New Zealand 24 16.7
5 Malaysia ASEAN 101 14.9
6 Thailand ASEAN 262 13.7
7 Malaysia Japan 101 12.9
8 Thailand Japan 262 11.5
9 Singapore Japan 44 11.4
10 Singapore Korea 44 9.1
11 Singapore Australia 44 9.1
12 Philippines ASEAN 102 8.8
13 Vietnam ASEAN 64 7.8
14 Indonesia ASEAN 92 6.5
15 India Thailand 31 6.5
16 Malaysia China 101 5.0
Source: Survey of Japanese-Affiliated Firms in ASEAN, India, and Oceania
Table 3. Reasons for Not Using FTAs (%): Exports
ASEAN (n=327) 19.9 37.6 4.0 2.5 4.6 1.5 4.6 22.9 22.6
Indonesia (n=34) 17.7 38.2 2.9 8.8 5.9 2.9 5.9 26.5 35.3
Malaysia (n=55) 23.6 52.7 - - 1.8 - 1.8 14.6 14.6
Myanmar (n=4) - 75.0 25.0 - - - - 25.0 -
Philippines (n=61) 9.8 32.8 4.9 - 3.3 1.6 9.8 21.3 27.9
Singapore (n=15) 6.7 40.0 - 13.3 13.3 6.7 6.7 20.0 26.7
Thailand (n=122) 26.2 32.8 6.6 2.5 6.6 1.6 4.1 22.1 22.1
Vietnam (n=36) 19.4 33.3 - - - - - 38.9 16.7
SW Asia (n=37) 16.2 18.9 - - - 2.7 2.7 37.8 29.7
India (n=19) 10.5 5.3 - - - 5.3 - 42.1 42.1
Oceania (n=24) 12.5 29.2 - - - - - 41.7 25.0
COO procedures too complex High cost of
COO COO hurdle
too high
Low tariff Tariff exempt Many
different COO rules
No FTA/EPA with destination Unaware of
FTA/EPA
Other
Source: Survey of Japanese-Affiliated Firms in ASEAN, India, and Oceania
Table 4. Utilization of FTA by FTAs: Imports
Rank Base Country FTA Partner Valid Responses Use FTA %
1 Indonesia Japan 94 17.0
2 Malaysia Japan 95 12.6
3 Thailand Japan 253 12.3
4 Thailand ASEAN 253 10.3
5 India Thailand 49 10.2
6 Malaysia ASEAN 95 9.5
7 Vietnam ASEAN 64 9.4
8 Philippines ASEAN 88 8.0
9 Indonesia ASEAN 94 7.4
Source: Survey of Japanese-Affiliated Firms in ASEAN, India, and Oceania
Table 5. Reasons for Not Using FTAs (%): Imports
ASEAN (n=321) 48.9 13.4 2.2 0.3 12.8 4.1 13.1 15.9
Indonesia (n=35) 34.3 14.3 - - 11.4 5.7 17.1 31.4
Malaysia (n=55) 45.5 20.0 - 1.8 14.6 3.6 12.7 10.9
Myanmar (n=5) 20.0 60.0 20.0 - - - 40.0 -
Philippines (n=60) 61.7 8.3 3.3 - 5.0 - 8.3 16.7
Singapore (n=18) - 22.2 5.6 - 22.2 - 16.7 38.9
Thailand (n=113) 51.3 10.6 2.7 - 15.9 8.0 12.4 14.2
Vietnam (n=35) 68.6 8.6 - - 11.4 - 14.3 2.9
SW Asia (n=47) 29.8 4.3 4.3 - 2.1 4.3 42.6 14.9
India (n=23) 4.4 - 8.7 - 4.4 8.7 47.8 30.4
Oceania (n=14) - - - - 14.3 7.1 50.0 28.6
Investment incentive
scheme
Few domestic sales on which tariffs
levied
Procurement sources unaware of
FTA/EPA
Other FTA not
applicable to intermediary
trades
Ordinary tariffs low
No benefit from stepwise
FTA reduction
No FTA/EPA with source
Source: Survey of Japanese-Affiliated Firms in ASEAN, India, and Oceania
Table 6. Basic Statistics
Variable Obs Mean Std. Dev. Min Max
FTA 872 0.282 0.450 0 1
Scale 872 5.349 1.426 1.099 11.608
Variance 872 0.060 0.028 0.007 0.109
ExASEAN 872 0.129 0.206 0 1
ExCHINA 872 0.032 0.103 0 1
ExJAPAN 872 0.265 0.347 0 1
Table 7. Probit Results
(I) (II) (III) (IV) (V) (VI)
Scale 0.175*** 0.169*** 0.170*** 0.172*** 0.158*** 0.154***
[0.040] [0.040] [0.044] [0.045] [0.047] [0.049]
Variance -7.241*** -7.420*** -7.434*** -7.199*** -7.953*** -7.209***
[1.924] [1.942] [2.117] [2.154] [2.370] [2.444]
ExASEAN 0.611** 0.632** 0.321 0.315 0.660** 0.621*
[0.252] [0.251] [0.262] [0.265] [0.315] [0.325]
ExCHINA 1.016** 1.018** 0.802* 0.726 1.032* 0.851
[0.437] [0.437] [0.458] [0.463] [0.533] [0.539]
ExJAPAN 0.348* 0.384** 0.670*** 0.696*** 0.809*** 0.842***
[0.178] [0.178] [0.211] [0.212] [0.238] [0.243]
Year Dummy YES YES YES YES YES YES
Sector Dummy YES NO YES NO YES NO
Country Dummy YES NO YES NO YES NO
Sector*Country NO YES NO YES NO YES
Observations 872 872 674 674 494 493
Pseudo R2 0.1343 0.1423 0.1299 0.1516 0.1311 0.1622
Notes: ***, **, and * indicate 1%, 5%, and 10% significance, respectively. Figures in parentheses
represent the White consistent standard error. The sample in columns (I) and (II) is restricted solely to exporting affiliates. In columns (III) and (IV), the sample is restricted to affiliates with positive exports to other ASEAN countries or China, affiliates in Singapore and Malaysia with positive exports to Japan, and affiliates in Thailand and Indonesia with positive exports to Japan in 2008. In addition to such restrictions, in columns (V) and (VI), we drop affiliates who answered “importers are expempted from tariffs” as “reasons for not using FTAs.”
Table 8. Results of Country Dummy: Thailand as a Base
(I) (III) (V)
Malaysia 0.052 -0.051 0.114 [0.145] [0.155] [0.174]
Singapore 0.490** 0.451** 0.314 [0.193] [0.203] [0.221]
Indonesia 0.026 0.095 0.15 [0.161] [0.180] [0.202]
Philippines -0.548*** -0.430** -0.396*
[0.160] [0.190] [0.220]
Vietnam -0.670*** -0.395 -0.329 [0.255] [0.300] [0.341]
Notes: ***, **, and * indicate 1%, 5%, and 10% significance, respectively. Figures in parentheses represent the White consistent standard error. The results of the other variables are reported in the corresponding columns in Table 7.
Table 9. Results of Sector Dummy: Food Sector as a Base
(I) (III) (V)
Wearing apparel 0.641 0.750 0.875 [0.440] [0.541] [0.605]
Wood products 0.125 0.453 0.101
[0.470] [0.506] [0.529]
Furniture -0.954
[0.626]
Paper products -0.308 -0.295 0.318 [0.563] [0.562] [0.788]
Chemicals -0.17 -0.057 0.108
[0.285] [0.294] [0.313]
Petroleum products 0.575 0.701 1.090*
[0.556] [0.558] [0.635]
Plastic products -0.462 -0.406 -0.192 [0.306] [0.318] [0.344]
Rubber products -0.232 -0.218 -0.058 [0.347] [0.368] [0.397]
Glass and glass products -0.303 -0.210 -0.312 [0.376] [0.416] [0.419]
Basic iron and steel -0.337 -0.200 0.073 [0.344] [0.357] [0.382]
Non-ferrous metals -0.139 0.004 0.381 [0.326] [0.346] [0.385]
Metal products -0.369 -0.286 -0.005 [0.290] [0.304] [0.329]
General machinery -0.368 -0.275 0.001 [0.342] [0.361] [0.394]
Electric machinery -0.363 -0.238 -0.092 [0.278] [0.293] [0.311]
Electric parts -0.938*** -0.963*** -0.681**
[0.297] [0.306] [0.332]
Automobile 0.646 0.918* 1.177**
[0.425] [0.495] [0.541]
Automobile parts 0.314 0.304 0.718**
[0.276] [0.289] [0.317]
Precision machinery -0.889* -0.804 -0.753 [0.524] [0.551] [0.569]
Others -0.459* -0.302 -0.151
[0.271] [0.288] [0.302]
Notes: ***, **, and * show 1%, 5%, and 10% significance, respectively. In parenthesis is a White consistent standard error. The results in the other variables are reported in the corresponding columns in Table 7.


![Table 8. Results of Country Dummy: Thailand as a Base (I) (III) (V) Malaysia 0.052 -0.051 0.114 [0.145] [0.155] [0.174] Singapore 0.490** 0.451** 0.314 [0.193] [0.203] [0.221] Indonesia 0.026 0.095 0.15 [0.161] [0.180] [0.202] Philippines -0.548*** -0.430](https://thumb-ap.123doks.com/thumbv2/123deta/9910622.1378331/23.892.290.600.181.413/table-results-country-thailand-malaysia-singapore-indonesia-philippines.webp)
![Table 9. Results of Sector Dummy: Food Sector as a Base (I) (III) (V) Wearing apparel 0.641 0.750 0.875 [0.440] [0.541] [0.605] Wood products 0.125 0.453 0.101 [0.470] [0.506] [0.529] Furniture -0.954 [0.626] Paper products -0.308 -0.295 0.318 [0.563] [0.](https://thumb-ap.123doks.com/thumbv2/123deta/9910622.1378331/24.892.247.639.183.979/results-sector-sector-wearing-apparel-products-furniture-products.webp)
