INVITED PAPER Special Section on Wireless Distributed Networks for IoT Era
Incremental Environmental Monitoring for Revealing the Ecology of Endangered Fish
Yoshinari SHIRAI†a), Yasue KISHINO†, Shin MIZUTANI†, Yutaka YANAGISAWA†, Takayuki SUYAMA†, Takuma OTSUKA†, Tadao KITAGAWA††,Nonmembers,andFutoshi NAYA†,Member
SUMMARY This paper proposes a novel environmental monitoring strategy, incremental environmental monitoring, that enables scientists to reveal the ecology of wild animals in the field. We applied this strategy to the habitat of endangered freshwater fish. Specifically, we designed and im- plemented a network-based system using distributed sensors to continuously monitor and record the habitat of endangered fish. Moreover, we developed a set of analytical tools to exploit a variety of sensor data, including envi- ronmental time-series data such as amount of dissolved oxygen, as well as underwater video capturing the interaction of fish and their environment.
We also describe the current state of monitoring the behavior and habitat of endangered fish and discuss solutions for making such environmental monitoring more efficient in the field.
key words: environmental monitoring, sensor networks, annotation tools, computational ethology
1. Introduction
Advances in the technologies of sensing devices and net- works have allowed scientists to more effectively monitor an- imals in the field. Such improved monitoring of animals and their habitats has enabled scientists to quantitatively analyze the relevant natural ecologies. Several ecological research works[1],[2]have monitored animals under controlled labo- ratory conditions; however, ecological systems are naturally embedded within various environmental landscapes, such as streams, coral reefs, and the forest floor, that are considerably more complex than environments replicated in a laboratory [3]. The ability to carry out tracking in the field is critical because environmental drivers in the natural context — such as light, temperature, physical habitat, and spatial dimen- sionality — have a profound influence on behavior and thus ecosystem organization[3].
To reveal the ecology of wild animals in the field, sci- entists need to monitor both the target animal’s behavior and environmental factors in the habitat. We define the former type of monitoring as “target behavior monitoring” and the latter type as “habitat monitoring” in this paper. Investigat- ing the animal’s ecology, such as the relationship between the season of starting propagation and cumulative temperature or that between the frequency of spawning and temperature,
Manuscript received December 10, 2017.
Manuscript revised February 13, 2018.
Manuscript publicized April 13, 2018.
†The authors are with NTT Communication Science Laborato- ries, NTT Corporation, Kyoto-fu, 619-0237 Japan.
††The author is with Faculty of Agriculture, Kindai University, Nara-shi, 631-8505 Japan.
a) E-mail: [email protected] DOI: 10.1587/transcom.2017NEI0003
becomes possible only after conducting both target behav- ior monitoring and habitat monitoring. Such investigations in the field have been actively conducted in the ecological research community, while several investigation processes in conventional approach, such as counting certain animals and measuring environmental factors, are not automated[4].
Current environmental monitoring and image-based behav- ioral analysis technologies can help automate such process to investigate the animal’s ecology more quantitatively.
However, monitoring systems that can satisfy the re- quirements of both types of environmental monitoring tend to be so complex and large that an excessively long time is needed from design to deployment. Moreover, the obtained data might not be useful for revealing the animal’s ecology, since the appropriate factors for revealing certain character- istics of animals are not known in advance. For example, even scientists do not fully understand which environmental factor, such as temperature, humidity, or light, may trigger the egg-laying behaviors of certain species, or where and how the target animals prefer to lay eggs in the habitat.
We argue that rapidly deploying an improvised monitor- ing system in the field, gathering the data, and providing the data to scientists are important stages in revealing an animal’s ecology. As we experienced in several efforts at environmen- tal monitoring, professionals (e.g. scientists studying certain animals) can find interesting insights through monitoring data and evaluating analytical results that are not yet refined.
Based on these insights, we could set our next monitoring aims, including what kinds of data should be monitored in which location and how, toward understanding the animal more deeply.
The purpose of this paper is to share our experiences in conducting a practical environmental monitoring experi- ment and to address the issues involved with the design and development of systems for monitoring habitat and target behaviors. We conducted environmental monitoring of a biotope and a fish farm, habitats of endangered fish, located at Kindai University, Nara Prefecture, Japan[5]. The moni- toring project aims to reveal the ecology of endangered fish in a natural context. To achieve this, we decided to moni- tor both the habitat factors and the behaviors of endangered fish. However, we implemented the project in stages by first launching only habitat monitoring to measure such environ- mental factors as water temperature and amount of dissolved oxygen (DO). Next, we began monitoring target behavior by recording underwater video to better understand the behav- Copyright © 2018 The Institute of Electronics, Information and Communication Engineers
iors of endangered fish in the field. Currently, we are testing new sensor nodes that automatically detect fish behaviors and transmit only behavioral data to the remote server. By incrementally building our evolving monitoring system, we can develop it more efficiently and enable scientists to un- derstand the ecology of endangered fish in a step-by-step manner.
The contributions of the paper are as follows:
• an incremental environmental monitoring strategy for efficiently constructing a system that monitors both en- vironmental factors and target behaviors;
• practical experiments on incremental environmental monitoring;
• monitoring support tools and a method of efficiently constructing training data for detecting target behaviors;
• a thorough discussion on the effectiveness and novelty of our approach to incremental environmental monitor- ing.
The rest of the paper is organized as follows. Section 2 introduces the characteristics of endangered fish and their habitat. Section 3 describes the design of our incrementally phased strategy for constructing a complex environmental monitoring system that can reveal the ecology of endan- gered fish. This strategy consists of three phases, and their conditions of environmental monitoring are overviewed in Sects. 4, 5, and 6, respectively. We discuss the effectiveness of our strategy in Sect. 7, present related work in Sect. 8, and give our conclusions in Sect. 9.
2. Endangered Fish and Their Habitat
We started environmental monitoring aimed at clarifying the ecology of Japanese rosy bitterling, an endangered fish, in 2013. Japanese rosy bitterling is a species endemic to Japan.
It has widely dwelled in rivers and reservoirs in western Japan. However, recent agricultural modernization has be- gun to destroy its habitat, and hybridization with continental rosy bitterling has also reduced the population of Japanese rosy bitterling.
In order to protect this species, it is necessary to pre- serve its existing habitat and to expand this habitat by im- proving the environmental quality of the ponds where no bitterling yet lives. However, our understanding of the ecol- ogy of rosy bittering is still insufficient, especially for work in the field.
This section describes the characteristics of Japanese rosy bitterling and the habitat where we conducted environ- mental monitoring.
2.1 Japanese Rosy Bitterling
Japanese rosy bitterling is a small freshwater fish, with a length of about 5 cm. The fish reproduces within a specific ecology: It lays its eggs inside a particular kind of mussel.
However, since this mussel is susceptible to low levels of dissolved oxygen and high temperatures, propagation of both
the mussels and the fish is difficult. Consequently, we must protect this entire ecological system in order to save the Japanese rosy bitterling from extinction.
2.2 Monitoring Field
At Kindai University, two reservoirs are provided as con- trolled habitats for the bitterling. First, the biotope is a pond with dimensions of about 10 x 20 m. Its depth is mostly continuous but varies from 0 to 1 m, depending on the point in the pond. A wide variety of species, such as killifish, cru- cian carp and crayfish, live in the biotope. The temperature variation is extreme, with temperatures sometimes falling below freezing point in winter.
The fish farm, the university’s second bitterling habitat, is a small artificial pond with dimensions of about 2 x 4 m.
The depth varies from 30 to 50 cm, depending on the weather.
Some other species, such as killifish, live in the fish farm, but the number of species is few compared to the biotope.
A hut is constructed about 15 m away from the fish farm, and it houses a power supply for the monitoring systems. On the other hand, no power supply is available in the area surrounding the biotope.
2.3 Requirements for Monitoring Systems
In environmental monitoring for investigating wild animal’s ecology, it is quite important to stably keep collecting sensor data over a long period of time. Thus, monitoring systems should stably keep supplying power to all sensors and sensor nodes and maintain stable wireless connection throughout the year. When the monitoring system supplies the power to sensors and sensor nodes by batteries, the capacity of the batteries should be determined in light of the maintenance schedule. For instance, if maintenance staff can replace bat- teries only once every three months, it is necessary to select batteries that can continuously supply the power for more than three months. The system designer should also decide the wireless communication method, the type of antenna, and its installation site so that stable data transmission can be maintained throughout the year.
In our project, our monitoring system’s maintenance (e.g. battery replacement) should not have to be more fre- quent than monthly. As it happens, students of Kindai University normally conduct monthly maintenance in these reservoirs, making it possible for them to easily handle our experimental system’s maintenance. Looking toward the fu- ture, the ideal maintenance schedule would be only once a year in winter, considering the rosy bitterling’s spring- autumn spawning cycle.
The monitoring equipment, such as sensor nodes, can be placed on the bank around the reservoirs. Taking the size of these reservoirs into consideration, an IEEE802.15.4 link is adequate for communication between the two ends of the pond. Note that weeds grow high on the banks of the reservoirs in summer and thus sometimes interfere with the wireless communication. In that case, it is necessary to use
a long-range wireless module and/or to install the antenna at a high position.
3. Designing Environmental Monitoring to Reveal Japanese Rosy Bitterling’s Ecology
Monitoring systems that can successfully monitor both the habitat and the behavior of endangered fish are too com- plex to design, develop and deploy in a practical timeframe.
Moreover, if a great deal of time were needed for monitor- ing, it would be difficult to clarify the biological findings.
Therefore, we first started environmental monitoring with a simple monitoring system and then incrementally expanded it to obtain useful data in a step-by-step manner. This section describes our incremental strategy of environmental moni- toring.
3.1 Difference between Habitat Monitoring and Target Be- havior Monitoring
One of our interests in the ecology of the bitterling is de- termining what environmental factors influence its propa- gation behaviors in the wild. Consequently, we decided to measure temperature, humidity, light, water temperature, and dissolved oxygen (DO) amount as environmental fac- tors of the bitterling’s habitat. We also decided to monitor propagation-related behaviors such as approaching mussels and spawning.
While existing sensors are able to directly measure the values of environmental factors (e.g. water temperature sen- sors), sensors that can measure values of bitterling behav- iors are not currently available. Therefore, we decided to record underwater video of the pond with an underwater camera, extract instances of target bitterling behaviors from the recorded video, and count these behaviors.
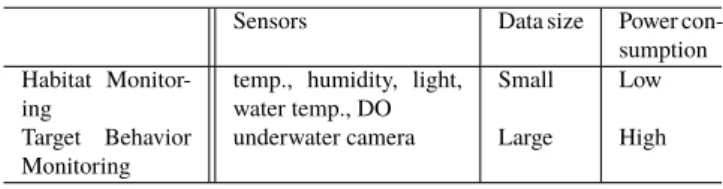
Table 1 compares the sensors used for our habitat mon- itoring and target behavior monitoring. The size of the data measured by habitat monitoring sensors is small enough to send via wireless sensor networks (WSN). A sensing device typically consumes little energy, and thus small, low-power- consuming sensor nodes can measure the environmental val- ues and transmit them. On the other hand, the size of the data captured by an underwater camera is quite large be- cause high-resolution sequential images (e.g. video recorded at 1280 x 720, 30 fps in our project) are required to capture the propagation-related behaviors. Regarding power con- sumption, underwater cameras consume considerably more energy, needed for capturing images, than do habitat mon-
Table 1 Comparison of sensors for habitat monitoring and target behavior monitoring.
Sensors Data size Power con-
sumption Habitat Monitor-
ing temp., humidity, light,
water temp., DO Small Low
Target Behavior
Monitoring underwater camera Large High
itoring sensors. That is, higher-performance sensor nodes are required for capturing images and transmitting them to a remote storage device.
We assume that a monitoring system capable of satis- fying the requirements of both types of monitoring would be too complex to design, develop and deploy all at once. Based on the comparisons discussed above, sensor nodes with dif- ferent specifications are required for habitat monitoring and for target behavior monitoring. Moreover, it is necessary to design purpose-specific communication and power supply methods. However, if the envisaged dual-purpose monitor- ing system required an extraordinarily long time from design to deployment, our efforts to better understand the ecology under study would be delayed accordingly. Furthermore, excessive delays in deployment create difficulties for ongo- ing improvement of the monitoring system. Therefore, a phased-in deployment of prototype monitoring systems in the field would enable developers to collect suitable data for understanding how to improve the system[6].
In order to deploy monitoring systems at a more produc- tive pace, we decided to start habitat monitoring in advance of launching target behavior monitoring. This approach was taken because the constraints of power supply and data trans- mission in habitat monitoring are looser than those in target behavior monitoring, thus making it relatively easy to design, develop and deploy the monitoring system. It is also impor- tant to grasp the environmental factors of ponds where the bitterling actually live, since such data is useful in promoting conservation.
3.2 Target Behavior Detection
All of the habitat monitoring sensors we selected for use are able to return numerical values related to a particular environmental factor. These values can be used for statis- tical analysis without complex preprocessing. In contrast, camera-based target behavior monitoring requires prepro- cessing before analysis. That is, we have to isolate bitterling behaviors such as approaching mussels and spawning in the images captured by the underwater camera before conduct- ing statistical analysis.
In real-world investigation of the relationship between egg-laying behavior and various environmental factors, the sensor node connected to the underwater camera does not actually need to send all of the captured images to the remote server. Images of egg-laying behavior and/or the events that indicate the occurrence of egg-laying are sufficient to examine the relationship between egg-laying behavior and environmental factors. Rather than transmitting the entire collection of captured images, gathering only images with relevant information (i.e. target behavioral data) contributes to reducing the communication traffic.
Nevertheless, we assume that the target behavior mon- itoring system should gather all images at the beginning.
First, our understanding of how the bitterling behaves in re- lation to egg-laying is still insufficient, especially in the field.
To explore and clarify the bitterling’s behavior in the field,
watching video and confirming the kinds of characteristic behaviors the bitterling performs is crucial.
Second, automated image-based detection of the bitter- ling’s behavior is needed to selectively transmit only egg- laying images/events. Deep neural networks (DNN) show significant accuracy and speed for general purpose object detection from images, and they are potentially useful as a way to detect the bitterling’s behaviors. However, such frameworks require a large dataset of training images, which must be gathered in the field.
Consequently, we decided to first construct a target be- havior monitoring system that continuously records under- water images to understand the bitterling’s behavior in the field and to prepare a training dataset for the automated de- tection of bitterling behavior.
3.3 Incremental Environmental Monitoring Framework for Revealing the Ecology of Endangered Fish
Based on the above considerations, we have designed an incremental environmental monitoring strategy for revealing the ecology of endangered fish. The strategy is carried out in three phases:
Phase 1 Rapidly Launching Habitat Monitoring Habitat monitoring is deployed prior to the target be- havior monitoring. Constraints on power supply and data transmission are relatively loose, so users can flex- ibly explore which place is appropriate for deploying the sensor node by trial and error. This experience also helps users to design, develop and deploy the tar- get behavior monitoring. For clarifying the ecology of endangered fish, scientists can investigate the environ- mental factors of the ponds in which Japanese rosy bit- terling actually live, bodies of water that form a unique environment.
Phase 2 Starting Target Behavior Monitoring in parallel with Habitat Monitoring
Target behavior monitoring is deployed in the habitat after setting a design plan through the lessons learned in the habitat monitoring experience. A target behavior monitoring system in this phase continuously captures high-resolution images. In order to accumulate such images stably, sensor nodes connected to an underwater camera send images via wired cables, or images are even gathered manually. Capturing images requires much power, so an external power source is needed to feed power to the sensor nodes.
For understanding the bitterling’s behaviors, scientists can watch these sequential images and confirm the kinds of characteristic behaviors the bitterling performs. In addition, the captured images can be used to construct the training dataset for a DNN used to detect the bitter- ling’s behavior.
Phase 3 Integrating Target Behavior Monitoring and Habitat Monitoring
After automated bitterling-behavior detection becomes
possible, the sensor nodes are made to act as target behavior sensors within the habitat monitoring setup.
Specifically, sensor nodes connected to underwater cameras do not send all of the captured images but only the target behavioral data (e.g. egg-laying occur- rences) to the remote server. The target behavioral data are detected by the sensor nodes using a discriminative model of a DNN trained by the training dataset (i.e. ‘la- beling images’ discussed below) constructed in Phase 2.Accordingly, the amount of target behavioral data de- tected is small enough to send via a cellular network.
This implies that the remote server can receive the be- havioral data as quickly as other environmental data monitored by habitat monitoring and that scientists can immediately utilize these data. In this phase, the bitter- ling’s behavior is automatically detected so that scien- tists can analyze the relationship between this behavior and the environmental values quantitatively. Further- more, if scientists want to confirm other behavioral data, they can prepare another discriminative model and use it to replace the one in the sensor node.
Figure 1 depicts the transition of the sensor network used in our incremental environmental monitoring strategy. In Phase 1, the sensor nodes connected to the habitat sensor collect environmental values such as water temperature and DO and transmit them to the remote server via the gate- way. A wireless sensor network with small sensor nodes is sufficient to operate the monitoring process. In Phase 2, sen- sor nodes connected to the underwater cameras are installed in the habitat. Here, the sensor network for target behav- ior monitoring is separated from that for habitat monitoring, since an external power source and a wired cable are required for sensor nodes used to monitor target behavior. In Phase 3, sensor nodes for target behavior monitoring detect the bitter- ling’s behavior and send only behavioral data to the server.
The amount of behavioral data is small enough to send via WSN. Thus, both habitat values and target behavior values are accumulated using WSN. Although the sensor nodes con- nected to the underwater cameras still consume much power, operating them without an external power source is the ideal condition.
Our environmental monitoring system for revealing the ecology of endangered fish has been conducted by follow- ing an incremental environmental monitoring strategy. The habitat monitoring began in 2013. The recording of under- water images at the fish farm started in 2016. The monitoring system for Phase 3 is still being tested in our laboratory, but we plan to deploy it in the habitat in 2018 to construct the sensor network. Sections 4, 5, and 6 describe each phase in detail.
4. Phase 1: Endangered Fish Habitat Monitoring Based on the incremental environmental monitoring strategy, we started habitat monitoring in 2013. This section describes
Fig. 1 Incremental environmental monitoring strategy for revealing ecology in the field.
habitat monitoring in the biotope, where the endangered fish live.
4.1 Overview of Endangered Fish Habitat Monitoring We used multipurpose sensor node hardware and CILIX, a virtual machine for small sensor devices, to develop the endangered fish habitat monitoring system. The hardware we developed enables us to rapidly start several environ- mental monitoring projects [7]. We embedded tempera- ture, humidity, and light sensors in the sensor node hard- ware because these sensors are frequently used in environ- mental monitoring[7]. The multipurpose I/O ports on our sensor node include digital I/O, analog-to-digital converter (ADC), inter-integrated circuit (I2C), inter-IC sound (I2S), serial peripheral interface (SPI), and universal asynchronous receiver/transmitter (UART). These ports handle a wide va- riety of environmental sensors. The sensor node hardware is fed by various electrical power supplies and adopts 2.4-GHz wireless communication.
CILIX is a common intermediate language virtual ma- chine (CILVM) that only requires an 8-16-bit CPU, 4-KB RAM, and 32-KB program memory[7]. CILIX allows sen- sor node software programmers to quickly develop a mini- mum set of software using familiar programming language (e.g. C#) with popular IDEs (e.g. Microsoft Visual Studio).
The abstraction of smart devices by CILIX provides pro- gram portability and frees developers from the complicated memory management and register control required for cer- tain devices. Thus, developers can easily relocate programs
to virtual machines, since the programs have become smaller and are separated from the hardware. More details are given in a previous work[8]. We quickly developed sensing soft- ware by modifying a greenhouse monitoring program, which was also used in the outdoor environmental monitoring we conducted in Nagano Prefecture, Japan[7]. As a result, we started preliminary sensing about a week after the project had launched.
Specifications of the sensor node are shown in Fig. 2.
Endangered fish habitat monitoring initially involved sensors of only air temperature, water temperature, humidity and light. Then, we increased the number of sensor nodes and the kinds of sensors, such as DO and water-level, in a step- wise manner. Moreover, we frequently updated the sensor node programs to adjust the nodes’ behaviors depending on the surrounding situation and the maintenance requirements, such as adjusting the sensitivities of sensors, changing the interval of monitoring, and adding a sleep function to reduce the frequency of battery replacement. Relocating such pro- grams is quickly done using the CILIX functions after the need for adjustment arises.
Figure 3 shows an overview of the current sensor net- work installed in the studied biotope. We installed three sensor nodes on the banks of the biotope. Two water tem- perature and dissolved oxygen (DO) sensors are connected to each sensor node. In addition, one sensor node with air temperature, light, and humidity sensors is installed near the biotope.
Each sensor node sends readings to the gateway approx- imately every 15 seconds via an IEEE 802.15.4 link. The
Fig. 2 Multipurpose sensor node hardware with CILIX.
Fig. 3 Overview of sensor network in biotope.
gateway sends them to a remote server via cellular-phone networks approximately once an hour. All sensor nodes installed in the environment are fed by small rechargeable lithium polymer (LiPo) batteries (3200 mAh). Currently, we need to replace batteries about once every 40 days. A solar panel feeds power to the gateway’s rechargeable battery, so we do not need to replace it.
The states of accumulating sensor data can be checked with a visualization tool called PondlogViewer (Fig. 3). This shows the status of each sensor node, such as power (on/off), warnings about outliers, latest measurement times, and read- ings. PondlogViewer also charts the transitions in the read- ings of each sensor at the bottom. While this tool normally shows the latest information, it can also provide previous information through a playback function. These functions allow users to monitor trouble with sensors as well as the states of endangered fish habitat in both current and past timeframes.
4.2 Findings of Endangered Fish Habitat Monitoring By analyzing the data accumulated in the biotope, we learned
Fig. 4 Sensor data in habitat monitoring.
the characteristics of the endangered fish habitat. Figure 4 shows sensor data obtained in August 2013. The value of DO repeats a rise-and-fall cycle every day due to phytoplankton photosynthesis. Although the DO values were manually measured once a week to check the pond’s water quality, such characteristics of the biotope were not revealed until we conducted the habitat monitoring.
We also used water-proof interval cameras to take pic- tures around the mussel and manually counted the number of fish to roughly investigate the relationship between fish count and the environmental factors. In comparing fish- count data with illuminance sensor data, we found that the rosy bitterling is active in the morning and in the evening, while the illuminance value is highest at noon. This suggests that the rosy bitterling lays its eggs while avoiding the peak of illuminance[5].
5. Phase 2: Endangered Fish Habitat and Behavior Monitoring
Since the bitterling lays its eggs inside a mussel, we decided to take recordings around the mussel. We put the mussel into a small planter to restrict its movement and recorded it with two underwater cameras: one located on top of the planter and the other located in front of the planter. We explored the optimum location for installing the underwater camera by examining the value of water temperature and DO, and we ensured photographic reliability by using water-proof cameras. As a result, the captured images were unfortunately not clear and insufficient for behavioral analysis due to the low transparency of the water. Consequently, we installed the system in a fish farm, another habitat of Japanese rosy bitterling at Kindai University. The recording of underwater images in the fish farm started from the beginning of 2016.
5.1 Overview of Endangered Fish Habitat and Behavior Monitoring
Figure 5 shows an overview of the system installed in the fish farm. Images captured by the underwater cameras are received by two gateway PCs via a 15-m HDMI cable. The system recorded the image around the mussel every day from 4:00 am to 8:00 pm. To investigate the relationship between propagation behaviors and environmental factors, we also in- stalled two sensor nodes, one for monitoring air temperature, light, and humidity and the other for monitoring water tem- perature and DO. As with the sensor networks of the biotope, readings were accumulated via IEEE802.15.4 and cellular networks. Broadband networks are unavailable around the fish farm, so we manually brought captured images to our server approximately once a month.
In terms of power supply, we fed power to the system using an external power source installed in a hut located about 15 m away from the fish farm, since the underwater camera we installed there consumes a great amount of electric power.
The sensor nodes use this power source as well.
Fig. 5 Overview of sensor network in a fish farm.
As of November 2017, approximately 8,500 hours (6.9 TB) of underwater video had been recorded into our HDD. To help scientists analyze the ecology of endangered fish and their habitat characteristics, we have developed anal- ysis support tools. PondSync enables users to synchronously play video frames and readings from the habitat. VideoAn- notator allows users to freely annotate descriptions on por- tions of the video. Consequently, scientists can intensively label videos with VideoAnnotator by, for instance, annotat- ing memos on the video frames in which distinctive behav- iors occur. Then, PondSync can be used to determine the natural context before and after such behaviors.
5.2 Incremental Training Data Generation
We have tried to detect the bitterling’s behaviors using deep neural networks (DNN). DNN such as YOLO9000[9]and Single Shot Multibox Detector (SSD)[10]show significant accuracy and speed for general purpose object detection.
Such detection frameworks are available for position and attribute detection for a variety of specific animals, as long as the users prepare labeling images for training them. Since the number of labeling images (i.e. training data) the frameworks require is quite huge, we have designed tools that help users construct the labeling images efficiently.
TrajectoryMaker enables users to generate trajectories of objects that appear in sequential images. Users can man- ually modify bounding boxes of object candidates and their trajectories with the tool to generate accurate trajectories of objects. The object candidates are detected by background subtraction in each video frame. The tool links them across frames to form trajectories.
RACRA enables professionals to annotate labels on the trajectories of objects generated by TrajectoryMaker. To allow professionals to quickly check a large number of object trajectories, it plays a video composed of multiple trajectories of objects. A professional can tag trajectories by selecting a certain object on the video and choosing a label he/she previously defined. A certain key is assigned to each label such as name, attribute, and action of the species so that the user can quickly tag the target object’s trajectory by simply pushing a key. The tool does not require users to perform video-seeking operations such as fast-forward and rewind.
Trajectories are iteratively played, and the next trajectory is automatically composed after completing the tagging for a certain trajectory of the object.
The two tools allow users to incrementally generate training data for detecting the behaviors of species, as well as to analyze monitoring data (Fig. 6). Trajectories labeled by RACRA can be used as training data for DNN-based de- tection frameworks. Figure 6(d) shows the results of detec- tion by SSD. Japanese killifish and Japanese rosy bitterling are detected in the video. Professionals can use detection results for analyses of ecology, such as investigating the re- lationship between the number of times the rosy bitterling approaches the mussel and the DO value. Detection results can also be used as object candidates in TrajectoryMaker.
Fig. 6 Incremental labeling and detection cycle.
Users can use such detection results instead of those by background subtraction to increase the number of accurate object trajectories, which improves the accuracy of detection and reduces the operations needed to modify the positions of object candidates and their trajectories. Therefore, the more users execute the cycles of labeling and detecting, the faster the users increase the amount of accurate training data for image-based behavioral analysis.
5.3 Findings on Egg-Laying Behavior
Figure 7 shows the number of egg-laying behaviors for three days each in late spring and mid-summer. The graph implies that fish will start spawning as the water temperature rises.
While the bitterling does not perform egg-laying behavior until 10:00 am in late spring, they frequently do it from early morning in mid-summer.
It is also interesting that the time of intensively laying eggs is different on 5/9 and on 5/20. While water tempera- ture did not rise all day and egg-laying behaviors were not performed until evening on 5/9, on 5/20 fish started spawning at 10:00 am as the water temperature rose. This also implies that there is a relationship between egg-laying behaviors and water temperature values.
Although more quantitative analysis is required to con- firm the relationship between egg-laying behaviors and water temperature, the recorded video provides valuable informa- tion to scientists.
Aside from such qualitative analysis, scientists can gain interesting viewpoints for analysis through watching the video. For instance, a male bitterling sometimes releases sperm when no female is around, but females do not release eggs when no male is around. Scientists became interested in the difference in such behaviors through observation of the images. Such findings have not yet been sufficiently confirmed but still provide valuable insights for future mon- itoring and analysis.
Fig. 7 Number of egg-laying behaviors in late spring and midsummer.
The line graph shows the water temperature. In order to count behav- iors accurately, we selected three days in each season when the water was particularly clear.
6. Phase 3: Seamless Integration of Target Behavior Monitoring and Habitat Monitoring
To accelerate the clarification of ecologies in the field, we have been trying to sensorize the sensor node connected to the underwater camera as a sensor for detecting rosy bit- terling behavior. Specifically, sensor node software detects the rosy bitterling through images and sends the position of rosy bitterling if detected. Implementing the detection pro- cess in sensor nodes allows professionals to rapidly confirm the preliminary results of behavioral analysis. Currently, we have to regularly replace the HDDs in which the underwater images are stored because the captured images are too large to send to our remote server via cellular networks. A similar situation often happens in field monitoring, and this delays analysis. Sending the detection results instead of the image data is one solution to this. If the sensor nodes detect several
Table 2 Conditions in each phase of incremental environmental monitoring.
Phase Sensors Sensor nodes Power sup-
ply for sen- sor nodes
Communication
to gateway Gateway Power supply
for gateway Communication to server Phase 1 Temp., Humid-
ity, Light, Water temp., DO
TWE-001, TWE-
STRONG LiPo IEEE 802.15.4 Mbed LiPo, Solar panel Cellular net-
work Phase 2 Temp., Humid-
ity, Light, Water temp., DO
TWE-001 LiPo IEEE 802.15.4 PC AC Cellular net-
work
Camera - - HDMI cable PC AC Manual copy
Phase 3
(planned) Temp., Humid- ity, Light, Water temp., DO
TWE-001 LiPo IEEE 802.15.4 FPGA sensor node
(sensor node for camera/gateway)
AC (LiPo if
possible) Cellular net- work
Camera - - -
behaviors of the target, such as rosy bitterling approaching the mussel and laying eggs inside the mussel, the behavioral data are useful for a preliminary examination of the animal’s ecology and can be sent even via narrow-band networks.
To integrate detection mechanisms into the sensor nodes, we have been developing and testing FPGA-based sensor nodes. These sensor nodes contain common HDMI and 4ch analog audio interfaces. Although we still do not deploy the sensor node in the endangered fish habitat, we plan to implement a discriminative model for rosy bitterling behavior detection in the sensor nodes and deploy them in the field of endangered fish behavior monitoring.
7. Discussion
7.1 Effectiveness of Incremental Environmental Monitor- ing
Table 2 summarizes our endangered fish habitat and behavior monitoring experiments in each phase. We believe that our incremental monitoring strategy is effective for monitoring both endangered fish behavior and their habitat in terms of an incremental understanding of the ecology and an efficient evolution of the monitoring system.
• incremental understanding of the ecology
One of the advantages of incremental environmental monitoring is that scientists can reveal the ecology step by step in accordance with the current phase of the strat- egy. As mentioned in Sects. 4.2 and 5.3, monitoring in each phase provides useful data to scientists. Although the monitoring in Phase 3 has not yet been conducted, we believe that the monitoring data from Phase 3 will enable scientists to quantitatively confirm the hypothe- sis derived in Phase 2.
• efficient evolution of monitoring systems
In terms of improving the monitoring system, each phase contributes to constructing the monitoring sys- tems in the next phase. The trial-and-error experience in Phase 1 provides useful information for deciding how to install underwater cameras. For instance, some DO sensors become buried under sludge as time passes in habitat monitoring. Furthermore, the value of the wa-
ter temperature sensor varied with the occurrence of direct sunlight. These experiences helped us to un- derstand how to install the underwater camera and at which locations. In Phase 2, our labeling tools help sci- entists understand the bitterling’s behaviors, and at the same time, labels annotated by the scientists are used as training data for automated detection of the bitter- ling’s behavior. This reduces the cost of creating the discriminative models used in Phase 3.
Although it is difficult to compare it with other approaches, we argue that our three-phase strategy is effective for evolv- ing an environmental monitoring system, at least for the task of revealing the ecology of endangered fish.
7.2 Toward Making Environmental Monitoring More Scal- able
There remains the important issue of reducing the power consumption of the FPGA sensor node, which consumes much less power than a PC but still requires an external power source. If the FPGA sensor node did not require an external power source, laying down cables for the power supply would no longer be needed and scientists would have more flexibility in choosing where to install cameras.
In reality, sustainably feeding adequate power to a sen- sor node embedded in the field is quite difficult. This is a major issue in designing systems for monitoring wild ani- mals. Although the movement range of the rosy bitterling is here restricted within the biotope and the fish farm, in nature sea fish, insects, and other animals move freely through their relatively large habitats. In such cases, monitoring requires a large number of sensor nodes installed in the field, where replacing batteries is an infeasible burden.
While we have also studied efficient data gathering for wireless sensor networks[11], there is demand for technolo- gies that allow wireless distributed networks (WDN) to op- erate in the field with reduced power consumption. A typical scenario would be efficiently accumulating data and reduc- ing the amount of transmitted data by deploying cooperative sensor nodes. WDN technologies such as dynamic cluster- ing protocols for reducing total energy consumption of the sensor networks[12],[13]and transmission cost minimiza-
tion algorithms utilizing the correlation structure of the data gathered by sensors[14],[15]are strongly recommended to implement the system for monitoring wild animals which move around in relatively large habitats. Reducing power consumption by taking into account the known behaviors of a target animal might be also useful for monitoring wild animals. For example, some sensor nodes/gateways could reduce the frequency of monitoring in a specific time period depending on the activity rhythms of the target animal.
8. Related Work
8.1 Wildlife Monitoring
Several environmental monitoring schemes have been con- ducted to reveal wildlife ecology. As for habitat monitoring, a variety of environmental factors have been accumulated, including temperature[6],[16], humidity[6],[16]and light [16]. As for target behavior monitoring, the several be- haviors studied and captured by camera have included the existence of the target animal[17], its movements[18]–[20], and specific actions[1].
In target behavior monitoring in the field, monitor- ing approaches can be classified into two types. The bio- logging/telemetry approach[21]enables scientists to track target animals by attaching small tags (e.g. RFID tag) or de- vices (e.g. GPS) to them. The second approach accumulates the target behavioral data by capturing them with sensors (e.g. Radar, Geophones, Cameras) installed in certain loca- tions.
The former approach is designed to retrieve specific spatio-temporal data types at high quality[22]. However, there are constraints in terms of the physiological properties, size, and weight of the animal, which make marking and tagging hardly possible for some species[22]. For instance, there is a rule-of-thumb that a device attached to a bird should weigh 3-5% or less of the animal’s mass[23]. Consequently, the bio-logging/telemetry approach is difficult to apply to the monitoring of smaller animals’ behavior.
The latter approach has no such restrictions and can be applied to small-animal behavior monitoring, although it is more difficult to extract behavioral data than with the bio- logging/telemetry approach. Several types of sensors have been used, such as radar, geophones, microphones, thermal cameras, and image cameras[22].
The target behavior monitoring in our incremental en- vironmental monitoring strategy takes the latter approach, especially when using cameras as behavior monitoring sen- sors. Cameras are convenient in that the restrictions on the installation location and the target animal are relatively low.
For instance, thermal cameras are unsuitable for monitor- ing poikilothermic reptiles and animals in the water, micro- phones are unsuitable for animals that do not make calls, etc.
In addition, images captured by camera provide information on not only animals’ presence, identity, species type, and location but also animals’ activities, behavior and mutual interaction[22]. Therefore, cameras have been widely used
for target behavior monitoring[17],[24],[25].
As with our monitoring project, some research works have conducted both habitat monitoring and target behav- ior monitoring simultaneously to further investigate wildlife ecology. Naumowicz et al. monitored the temperature and humidity inside and outside a burrow of Manx Shearwater, a highly pelagic seabird on Skomer Island[18]. They also used RFID tags to monitor the identity of individual birds and passive infrared sensors to monitor their movements at the entrance of the burrow. Dyo et al. attached active RFID tags embedded within a small lightweight collar on Eurasian badgers to monitor their activities[6]. They also deployed temperature and humidity sensors in the badgers’ habitat.
While these research works monitored target behav- ior using the bio-telemetry approach, few have reported a system that conducts both habitat monitoring and target be- havior monitoring, in which the latter is done using cameras installed at specific locations. We assume that monitoring systems that satisfy the requirements of both habitat moni- toring and camera-based target behavior monitoring tend to be so complex that such dual-purpose monitoring becomes infeasibly difficult.
Our incremental environmental monitoring approach enables users to construct monitoring systems in a stepwise way and thus overcome such difficulties. Incremental en- vironmental monitoring is suitable for revealing relatively small animals’ ecology, and it is particularly suitable at loca- tions where the target animals’ characteristic behaviors are limited but frequently occurring. For example, it is generally easy to use fixed cameras to capture sea fish that use corals as a hideaway, birds that make and live in fixed nests, and insects that intensively gather at the source of a specific sap.
Recent work by Elias et al. constructed wildlife mon- itoring systems using motion-triggered cameras [17]. To reduce the amount of data transmitted to a remote site, their system performs classification of wildlife images near IoT sensing devices (cameras). They also devised a technique for automatically constructing a training dataset for auto- mated wildlife detection by combining a small number of empty images from camera traps with images of animals of interest taken from Google Images. Their approach is also effective in reducing some of the obstacles to constructing systems for monitoring both habitat and target behaviors.
8.2 Rapid Deployment and Incremental Evolution Zhang et al.[19]and Naumowicz et al.[18]made a wildlife monitoring system that evolved multiple times to improve the reliability of data collection, thus reducing energy con- sumption and noise. Dyo et al. first developed a prototype monitoring system for Eurasian badgers and then incremen- tally improved their software and hardware to reduce main- tenance costs[6]. Based on their long-term environmental monitoring experiences, they argued that rapid prototyping allowed them to collect suitable data to understand how they could improve the system as a whole. No amount of simula- tion or laboratory testing is equivalent to problem solving in
real deployments[6]. We agree with the rationale of these efforts. Rapidly deploying a monitoring system and incre- mentally expanding it will eventually result in more efficient improvement of the system. In addition, our incremental strategy helps scientists to understand, in a stepwise way, the target animal’s ecology in synchrony with the system’s evolution.
9. Conclusion
This paper introduced the design and current status of the system to monitor simultaneously endangered fish habitat and target behavior. Incremental environmental monitor- ing strategy helps users to gradually construct systems for studying both wildlife behavior and habitat, although such monitoring systems normally tend to be complex and large.
For our aim of monitoring endangered fish habitat and fish behavior, we designed and implemented a network-based system of distributed sensors to continuously monitor and record the habitat of endangered fish as well as a set of an- alytical tools that exploit a variety of sensor data, including time-series environmental data such as amounts of dissolved oxygen, and underwater video capturing the interaction of fish and their surrounding environment. Currently, we are also conducting environmental monitoring of the nests of Japanese honey bees[26]. Future work will involve con- firming the effectiveness of our strategy through several such environmental monitoring studies to reveal the ecologies of wild animals.
Acknowledgements
We wish to thank Ms. Hinako Matsumoto, Faculty of Agri- culture, Kindai University, who helped with the analysis of video in Phase 2.
References
[1] W. Hong, A. Kennedy, X.P. Burgos-Artizzu, M. Zelikowsky, S.G.
Navonne, P. Perona, and D.J. Anderson, “Automated measurement of mouse social behaviors using depth sensing, video tracking, and machine learning,” Proc. National Academy of Sciences, vol.112, no.38, pp.E5351–E5360, 2015.
[2] T. Fukunaga, S. Kubota, S. Oda, and W. Iwasaki, “Grouptracker:
Video tracking system for multiple animals under severe occlusion,”
Computational Biology and Chemistry, vol.57, no.Supplement C, pp.39–45, 2015.
[3] A.I. Dell, J.A. Bender, K. Branson, I.D. Couzin, G.G. de Polavieja, L.P. Noldus, A. Perez-Escudero, P. Perona, A.D. Straw, M. Wikelski, and U. Brose, “Automated image-based tracking and its application in ecology,” Trends in Ecology & Evolution, vol.29, no.7, pp.417–428, 2014.
[4] W.J. Sutherland, Ecological Census Techniques: A Handbook, Cam- bridge University Press, 2006.
[5] Y. Kishino, Y. Yanagisawa, Y. Shirai, S. Mizutani, F. Naya, and T. Kitagawa, “A habitat-monitoring system for an endangered fish using a sensor network,” Proc. International Joint Conference on Pervasive and Ubiquitous Computing (UbiComp2015), pp.133–136, 2015.
[6] V. Dyo, S.A. Ellwood, D.W. Macdonald, A. Markham, N. Trigoni, R. Wohlers, C. Mascolo, B. Pásztor, S. Scellato, and K. Yousef,
“Wildsensing: Design and deployment of a sustainable sensor network for wildlife monitoring,” ACM Trans. Sen. Netw., vol.8, pp.29:1–29:33, 2012.
[7] Y. Kishino, Y. Yanagisawa, Y. Shirai, S. Mizutani, T. Suyama, and F. Naya, “Agile environmental monitoring exploits rapid prototyping and in situ adaptation,” IEEE Pervasive Comput., vol.16, no.2, pp.61–
71, 2017.
[8] Y. Yanagisawa, Y. Kishino, T. Suyama, T. Terada, M. Tsukamoto, and F. Naya, “A CIL virtual machine for wireless sensor network applications,” Proc. 2014 International Conference on Parallel and Distributed Processing Techniques and Applications (PDPTA’14), pp.248–254, 2014.
[9] J. Redmon and A. Farhadi, “YOLO9000: Better, faster, stronger,”
2017 IEEE Conference on Computer Vision and Pattern Recognition (CVPR), pp.6517–6525, 2017.
[10] W. Liu, D. Anguelov, D. Erhan, C. Szegedy, S. Reed, C.Y. Fu, and A.C. Berg, “SSD: Single shot multibox detector,” Proc. 14th European Conference on Computer Vision (ECCV 2016), pp.21–37, 2016.
[11] Y. Kishino, Y. Sakurai, K. Kamei, Y. Yanagisawa, T. Maekawa, and T. Okadome, “Data gathering in high-density wireless sensor net- works using hierarchical clustering,” IEEE International Symposium on Wireless Communication Systems, pp.547–551, 2008.
[12] W.R. Heinzelman, A. Chandrakasan, and H. Balakrishnan, “Energy- efficient communication protocol for wireless microsensor net- works,” Proc. 33rd Annual Hawaii International Conference on Sys- tem Sciences, 2000.
[13] O. Younis and S. Fahmy, “HEED: A hybrid, energy-efficient, dis- tributed clustering approach for ad hoc sensor networks,” IEEE Trans.
Mobile Comput., vol.3, no.4, pp.366–379, 2004.
[14] J. Liu, M. Adler, D. Towsley, and C. Zhang, “On optimal commu- nication cost for gathering correlated data through wireless sensor networks,” Proc. 12th Annual International Conference on Mobile Computing and Networking, MobiCom’06, pp.310–321, 2006.
[15] R. Cristescu, B. Beferull-Lozano, and M. Vetterli, “Networked Slepian-Wolf: Theory, algorithms, and scaling laws,” IEEE Trans.
Inf. Theory, vol.51, no.12, pp.4057–4073, 2005.
[16] A. Mainwaring, D. Culler, J. Polastre, R. Szewczyk, and J. Anderson,
“Wireless sensor networks for habitat monitoring,” Proc. 1st ACM International Workshop on Wireless Sensor Networks and Applica- tions, WSNA’02, pp.88–97, 2002.
[17] A.R. Elias, N. Golubovic, C. Krintz, and R. Wolski, “Where’s the bear? - Automating wildlife image processing using IoT and edge cloud systems,” 2017 IEEE/ACM Second International Conference on Internet-of-Things Design and Implementation (IoTDI), pp.247–
258, 2017.
[18] T. Naumowicz, R. Freeman, H. Kirk, B. Dean, M. Calsyn, A. Liers, A. Braendle, T. Guilford, and J. Schiller, “Wireless sensor network for habitat monitoring on skomer island,” IEEE Local Computer Network Conference, pp.882–889, 2010.
[19] P. Zhang, C.M. Sadler, S.A. Lyon, and M. Martonosi, “Hardware design experiences in zebranet,” Proc. 2nd International Conference on Embedded Networked Sensor Systems, SenSys ’04, pp.227–238, 2004.
[20] D. Anthony, W.P. Bennett, M.C. Vuran, M.B. Dwyer, S. Elbaum, A. Lacy, M. Engels, and W. Wehtje, “Sensing through the continent:
Towards monitoring migratory birds using cellular sensor networks,”
2012 ACM/IEEE 11th International Conference on Information Pro- cessing in Sensor Networks (IPSN), pp.329–340, 2012.
[21] S.J. Cooke, S.G. Hinch, M. Wikelski, R.D. Andrews, L.J. Kuchel, T.G. Wolcott, and P.J. Butler, “Biotelemetry: A mechanistic approach to ecology,” Trends in ecology & evolution, vol.19, no.6, pp.334–
343, 2004.
[22] M. Baratchi, N. Meratnia, P. Havinga, A. Skidmore, and A. Toxopeus,
“Sensing solutions for collecting spatio-temporal data for wildlife monitoring applications: A review,” Sensors, vol.13, no.5, pp.6054–
6088, 2013.
[23] J. Bäckman, A. Andersson, L. Pedersen, S. Sjöberg, A.P. Tøttrup, and T. Alerstam, “Actogram analysis of free-flying migratory birds:
New perspectives based on acceleration logging,” J. Comparative Physiology A, vol.203, no.6, pp.543–564, 2017.
[24] A.J. Garcia-Sanchez, F. Garcia-Sanchez, F. Losilla, P. Kulakowski, J. Garcia-Haro, A. Rodríguez, J.V. López-Bao, and F. Palomares,
“Wireless sensor network deployment for monitoring wildlife pas- sages,” Sensors, vol.10, no.12, pp.7236–7262, 2010.
[25] M. Zeppelzauer, “Automated detection of elephants in wildlife video,” EURASIP Journal on Image and Video Processing, vol.2013, no.1, p.46, 2013.
[26] M. Sugahara, T. Yamamoto, and Y. Kishino, “Microenvironment maintenance mechanism (temperature and relative humidity) of the brood area in an artificial open nest of apis cerana japonica,” The 87th Annual Meeting of the Zoological Society of Japan, 2016.
Yoshinari Shirai is a Senior Research Sci- entist at NTT Communication Science Laborato- ries, NTT Corporation. His research interests in- clude history-enriched environments, ubiquitous computing, and interaction design. He received a Ph.D. in engineering from the Graduate School of Engineering at the University of Tokyo. He is a member of HIS, VRSJ, and IPSJ.
Yasue Kishino is a Senior Research Scientist at NTT Communication Science laboratories in Kyoto, Japan. She received the B.E. degrees, the Master of information science and technology degrees, and the Ph.D. in information science and technology from Osaka University in 2002, 2004, and 2007, respectively. She joined NTT Communication Science Laboratories in 2007.
Her research interests include ubiquitous com- puting and sensor networks. She is a member of ACM and IPSJ.
Shin Mizutani is a researcher at NTT Com- munication Science Laboratories in Kyoto from 1998. He received the B.S. degree in physics from Science University of Tokyo in 1990. In 1992, he also received the M.E. degree in Osaka University. In the same year, he joined NTT Human Interface Laboratories. He received the Ph.D. degree in science from Osaka University in 1999. His research interests are the informa- tion processing mechanisms in neural networks and sensor systems from a viewpoint of nonlin- ear science.
Yutaka Yanagisawa is a visiting researcher at NTT Communication Science Laboratories.
His research interests include programming lan- guages to develop middleware and operating sys- tems for small wireless devices.
Takayuki Suyama is a Senior Research Scientist, Supervisor of Learning and Intelligent Systems Research Group, NTT Communication Science Laboratories. He received the B.E. and M.E. degrees in mechanical engineering from Osaka University in 1990 and 1992, respectively, and the Ph.D. degree in informatics from Kyoto University in 2007. He joined NTT Commu- nication Science Laboratories in 1992. During 1999–2003, he worked for the Research and De- velopment Center of NTT WEST Corporation.
He returned to NTT Communication Science Laboratories in 2003. Then, He joined Advanced Telecommunications Research Institute International (ATR) in 2014. He was a Head of Dept. of Dynamic Brain Imaging, ATR and studied Brain machine interface for real environment. His research interests are sensor network systems, distributed systems, ubiquitous com- puting and brain machine interface. He is a member of IEEE, ACM, IEICE and IPSJ.
Takuma Otsuka received B.E., M.Inf., and Ph.D. degrees from Kyoto University, Kyoto, Japan, in 2009, 2011, and 2014 respectively.
He has been a Researcher at NTT Communi- cation Science Laboratories, NTT Corporation, Kyoto, Japan, since 2014. His research inter- ests include statistical machine learning, prob- abilistic models, audio signal processing, and pattern recognition. He received the Best pa- per award of IEA/AIE-2010, NEC C&C Young Researcher Paper Award in 2010, the Best paper award of IWSEC-2013, and Best paper award of Advanced Robotics in 2016.
Dr. Otsuka is a member of IEEE, JSAI, and IPSJ.
Tadao Kitagawa is an Associate Professor of Faculty of Agriculture, Kindai University. He received the B.S., M.S., and Ph.D. degrees in Bioresources from Mie University, Mie, in 1996, 1998, and 2001, respectively. He joined Kindai University in 2003. He is a biologist researching about population genetics and phylogeography of freshwater fishes. He has a strong interest in conservation of endangered fish species, as well as invasive alien species problem.
Futoshi Naya received a B.E. in electri- cal engineering, an M.S. in computer science, and a Ph.D. in engineering from Keio Univer- sity, Kanagawa, in 1992, 1994, and 2010. He joined NTT Communication Science Laborato- ries in 1994. From 2003 to 2009, he was with In- telligent Robotics and Communication Labora- tories, Advanced Telecommunications Research Institute International (ATR). Currently, he is an Executive Research Scientist, Research Planning Section, NTT Communication Science Labora- tories. His research interests include communication robots, sensor net- works, pattern recognition, and data mining in cyber physical systems. He is a member of the Institute of Electrical and Electronics Engineers (IEEE), the Society of Instrument and Control Engineers, and the Institute of Elec- tronics, Information and Communication Engineers (IEICE).