Art Management Activities of the Japanese General Travel Agencies
一般旅行業者の文化マネジメント性
● 渡辺康洋/富山大学芸術文化学部
WATANABE Yasuhiro / The Faculty of Art and Design, University of Toyama
● Art Management, Culture Management, Tourism, Travel Marketing
1. Motivation of the Research
This is my first research on the art management activities of the Japanese general travel agent. The following is how I came about studying this new topic.
In the governmental movement of uniting national universities existing within a same prefecture, the college I belonged to merged with other two universities to become the Faculty of Art and Design of the University of Toyama in October 2005. Along with this change, new research on the art management activities of tourism industry was added to my current areas of tourism and business English. The promoters of the new faculty advised me that tourism plays an important role in the art and culture management, and that a researcher such as myself who has first-hand experience in the tourism business has a big chance of contributing to the development of this field.
However, for a researcher of international tourism marketing, the art and culture management was a totally new area of study. I therefore had to start my research from the very basic position. My first concern was whether or not tourism can actually be regarded as one wing of the art and culture management. As such view generally came from the art related domain, I needed to verify if it still held true when seen from the tourism domain.
Motivated from such concern, in this paper, I will examine the extent of art management activities of the Japanese tourism industry, especially those of the general travel agencies.
2 Subjects of Study 2.1 General Travel Agencies
The total of 10,000 plus travel agencies in Japan is categorized into two types of registrations; one for
travel agents and the other for travel sub-agents. The travel agents are further divided into three following categories *
1:
1) 1st Category Travel Agents: Companies that organize and sell both overseas and domestic tours, and also make travel arrangements for the clients as agents. Business registration for this category is made to the Minister of Land, Infrastructure and Transport.
(784 companies are registered as of 2004.)
2) 2nd Category Travel Agents: Companies that organize only domestic tours and sell domestic and overseas tours, and also make travel arrangements for the client as agents. Business registration for this category is made to the governor of prefectural government. (2,765 companies as of 2004.)
3) 3rd Category Travel Agents: Companies that sell overseas and domestic tours, and also make travel arrangements as agents. Business registration for this category is made to the governor of prefectural government. (6,259 companies as of 2004.)
The word “organize” in the context “organize overseas tours” refers to the act of planning and outlining the tour itinerary and work out the travel conditions including the tour price. The word “sell”
in the context “sell overseas tours” refers to the act of printing the brochure of organized tours or advertising them. Under this classification, the planning of tours are done by 1st and 2nd category travel agents only, with 2nd category authorized to solely plan domestic tours.
The main services provided by travel agents are;
reservation and sales of transports or accommodations, organizing of packaged tours, foreign exchange and sales of travel vouchers. While some travel agents concentrate on providing limited services, the general
一般論文 平成 18 年5月 18 日受理
travel agencies cater to all services. These general travel agencies, naturally the 1st category travel agents, include, JTB, Kinki Nippon Tourist, Nippon Travel Agency, HIS or Hankyu Express.
With this restriction on the activities of travel agencies, and with the fact that more than half of the overseas travelers are handled by the 1st category travel agents, this paper will study the activities of the 1st category agents only.
2.2 Art and Cultural Management
It has been understood that the field of art and culture consists of two groups: the group of artists who perform or practice art and cultural activities, and the other group of people who come into contact with such work of art and culture produced by the first group to appreciate them. Within this understanding, the artists produced the works and then they are received by the appreciators.
However, in the recent years, in addition to these two groups, a third group came into light: a group of art/culture managers that connects the preceding two groups. Indeed in reality, the appreciators quite seldom visit the artists to receive their work of art. Instead, the appreciators in general would visit museums or galleries to enjoy the fine arts, or they would attend a concert held in a theater to appreciate the work of musicians. In such examples, what are the functions of museums, galleries or theaters? They are providing a space or an occasion for the work of art and the appreciators to meet. Their roles as a go-between are those of the art managers or culture managers, and their tasks are called art management or culture managements. *
2The history of concept of art management is new.
In the United States, which has the longest history, National Endowments for the Arts, an independent federal organization, was established in 1965 to broaden the access of the citizens to art and its activities, and to support the production of art. This is understood as the first art/culture management. In Japan, the history is shorter. In the last two decades of the 20th century, when the economy boosted rapidly, the administration was busy building halls or theaters elsewhere in Japan. This policy was bitterly criticized as a poor “hardware” production *
3as it gave little consideration to the promotion of the production of
art and culture. Under such situation, in 1994, Showa Academia Musicae ( Showa ongaku daigaku ) started a department with a major in art management, and other educational institutions followed. We can consider this movement to be the start of art management.
In the contemporary society, following institutions are practicing art/cultural management:
1) art galleries, museums - connect the works of art and the appreciators.
2) concert halls, theaters, event halls - connect the work by musicians, stage performers, event producers and the appreciators.
3) publishers, mass-communication firms - connect artists and readers, audiences by art publications or broadcast programs.
4) administrative works, mainly cultural policy making - policy makers or planners of art/culture facilities create an environment where citizens have access to works of artists.
5) tourism industry - creates through travel the opportunities for the travelers to visit art management facilities or cultural events located or held beyond their quarters of daily life.
Art management is an activity whose objects are works of art, while culture management is an activity whose objects are all ranges of culture, including works of art. In this discussion the two managements are treated equally.
3. Art/Culture Management and Tourism
As previously noted, the tourism industry is considered as one segment of the art/culture management. However, such view is taken mainly from the art and culture field, not the tourism side.
Japan Association for Arts Management states in
its charter that, to integrate the theory and practice of
arts management, “discussions are essential through
multidimensional and interdisciplinary approach
with not only professionals in the art and culture
field but with experts in public administration, urban
planning and development, tourism, and regional
management.” In the homepage of Keio University's
Art Management Class *
4, Yoshio Miyama talks about
the relation of art management and tourism as “those
included in the domain of art management, together
with volunteer or NPO activities, cultural diplomacy,
and town planning.” Arts Management Course, Faculty
of Art and Design, University of Toyama teaches art/culture management for the fields of regional vitalization policy, tourism and production of cultural events, and encourages its graduates to exert their ability in the tourism and hospitality industries.
Advisory Council on Culture to the Ministry of Education, Culture, Sports and Technology in its 2005 Report*
5suggests art and cultural organization to liaise with tourism organizations in order to contribute to the promotion of the local culture.
In the United Kingdom, Department of National Heritage, a government section that is responsible for the promotion of culture, oversees tourism as well as museums, galleries, motion pictures and crafts.*
6Thus the organizations of the artists, who are the producers of art and culture, regard tourism as a necessity for the promotion their works. Such a promotional activity is indeed an art management and a culture management.
4. Tourism Asset of the Travel Industry
Now, let us view how cultural tourism is positioned in the travel industry. Cultural tourism is one segment of tourism whose objective of the travel is the
appreciation of art and culture.
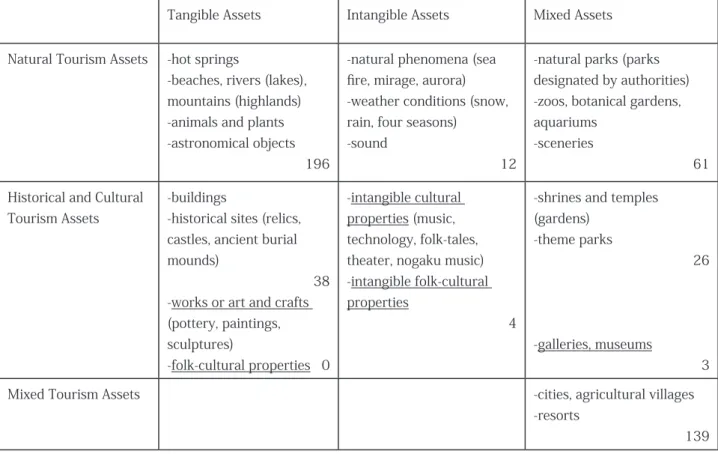
According to Hiroshi Suda*
7, the tourism assets are categorized as below:
The underscored assets listed in Table 1 are the works created by artists, or those displayed for the appreciation of visitors. Such assets are categorized under “Historical and Cultural Tourism Assets,” and are in forms of tangible, intangible or mixture of the two. Since travel agencies generally provide service for the travelers to access any of the tourism assets, the fact that these works of art and culture, and galleries or museums that exhibit those works are listed and categorized in tourism asset simply shows that travel industry is art/culture management.
In Table 1, the Historical and Cultural Tourism Assets include buildings, historical sites, shrines and temples. These assets are naturally the objects of art/
culture management just as well as the underscored assets. However, in this study these are not regarded as objects of art/culture management by the tourism industry as, to the travelers, the sense that the assets are the works of a human, or a known artist, is not so evident in buildings, historical sites, etc., as in paintings or sculptures, or theaters.
Table 1: Grouping of Tourism Assets
Tangible Assets Intangible Assets Mixed Assets
Natural Tourism Assets -hot springs
-beaches, rivers (lakes), mountains (highlands) -animals and plants -astronomical objects
-natural phenomena (sea fire, mirage, aurora) -weather conditions (snow, rain, four seasons)
-sound
-natural parks (parks designated by authorities) -zoos, botanical gardens, aquariums
-sceneries
Historical and Cultural Tourism Assets
-buildings
-historical sites (relics, castles, ancient burial mounds)
-works or art and crafts (pottery, paintings, sculptures)
-folk-cultural properties
-intangible cultural properties (music, technology, folk-tales, theater, nogaku music) -intangible folk-cultural properties
-shrines and temples (gardens)
-galleries, museums -theme parks
Mixed Tourism Assets -cities, agricultural villages
-resorts
“New Theory of Tourism Assets ” , Kotsu Shimbunsha, 2003 (underscore by Watanabe)
5. Estimation of Commitment of Travel Agencies as Art Managers
5.1 Travel Agencies' Effect on the Appreciators
As we have seen in the previous chapter, the travel industry indeed possesses a function to bring works of art and culture to the appreciators, and thus can be regarded as an art/culture manager. However, what needs to be verified here is to what degree in practice such activities as an art manager is exercised. In this concern, this chapter will try to measure how much the underscored assets in Table 1 are actually being marketed as tourism products.
I will analyze the all 479 packaged tours, both domestic and international, listed to be sold in the October 2005 issue of “Tabi no Tomo” magazine distributed by Club Tourism Co., which is one of the most influential travel agencies specializing in the so- called media sales of travel products. I will examine each and every packaged tour and judge which tourism assets in Table 1 the tour is offering. The key for the judgment is tour title, or subtitle; the name of the tourism assets included in the words of the title of the tour. If tourism assets do not appear in the titles, then
the photographs shown, or the assets that appear in the itinerary are judged.
As a result of the judgment and count, in the October 2005 issue of the “Tabi no Tomo” travel magazine by Club Tourism, only seven *
8out of 479 tour packages had art/culture assets as their travel objectives. It was a surprisingly small portion of the tour packages. October edition of the magazine featured the oncoming autumn travel season, with emphasis on the natural assets topped by red leaves watching. Despite such seasonal trend, the art/culture tours were in fact fewer than intangible natural assets tour (such as aurora, 12 products.), and about the same as animals and plants tour (5 products) in the tangible natural assets. The art and cultural assets taken out from the Historical and Cultural Tourism Assets (the underscored assets in Table 1) accounted for a mere 1.5% of the total tourism assets.
The overall examination revealed that more than half of the packaged tours had natural assets as tour objectives. Historical and cultural assets only accounted for 15% although it includes the popular
Table 2: Number of Packed Tours
Tangible Assets Intangible Assets Mixed Assets
Natural Tourism Assets -hot springs
-beaches, rivers (lakes), mountains (highlands) -animals and plants -astronomical objects
196
-natural phenomena (sea fire, mirage, aurora) -weather conditions (snow, rain, four seasons)
-sound
12
-natural parks (parks designated by authorities) -zoos, botanical gardens, aquariums
-sceneries
61 Historical and Cultural
Tourism Assets
-buildings
-historical sites (relics, castles, ancient burial mounds)
38 -works or art and crafts (pottery, paintings, sculptures)
-folk-cultural properties 0
-intangible cultural properties (music, technology, folk-tales, theater, nogaku music) -intangible folk-cultural properties
4
-shrines and temples (gardens)
-theme parks
26
-galleries, museums
3
Mixed Tourism Assets -cities, agricultural villages
-resorts
139
“New Theory of Tourism Assets”, Kotsu Shimbunsha, 2003 “Tabi no Tomo, Oct. 2005”, Club Tourism, 2005
theme parks. The tours to appreciate the works of artists were a small 1.5%.
This study revealed that more than half of the tourism assets marketed by a travel agency are natural assets. Approximately a third of the remaining assets are cities or resorts. Their tours whose objectives are the appreciation of the historical sites or art and cultural works are only about half of cities and resorts.
Most of all, the tours where tourists enjoy the works of the artists make up for only 1.5%. This study quite plainly shows that currently, the most important tourism asset for the travel agencies is “nature.”
We have so far discussed how much the travel agencies offer art/culture assets in their packaged tours. Now, on the other side of the marketing chain, to what extend do the tourists desire the art/culture asset as their purpose of travel? The following data Table 3: Breakdown of Tourism Assets
“Tabi no Tomo, October 2005”
Mixed 29.4%
Art/cultural 1.5%
Historical 13.5%
Natural 55.6%
“Tabi no Tomo, October 2005” , Club Tourism, 2005
come from the analysis of only the overseas travel by the Japanese. Therefore, a fair comparison with that of the tour packages in the “Tabi no Tomo” magazine, which contains both domestic and overseas, cannot be fully expected, however, the data in JTB Report 2005 show that 19.6% of the expected travelers said they wish to visit art galleries or museums in their next trip. In their responses, we can note that 4.8%
say they wish to enjoy concerts, live-house music or musicals, which are also cultural assets. These tour objectives of fine art and performing art together make up for approximately 25% of the wishes of the travelers.*
9This ratio is unchanged in the recent five years. For our interest, the largest portion of 65% said they wish to enjoy natural sceneries. This percentage agreeably coincides with the figure of the proportion of the natural asset tours in “Tabi no Tomo” magazine.
Nature is followed by “famous historical sites and buildings,” (39.4%) which is equivalent to “historical sites” in Table 1. In comparison, in the Magazine, only 13.5% of the tours had this asset.
Additional survey in this report shows that, out of 2,833 who have traveled overseas, 50.2% took part in historical/cultural activity during their trip. And, 31.8% visited art galleries or museums, while 11.3%
enjoyed theater, concert or cinema. This fact indicates that more travelers actually engage in art/cultural activity during the trip than those who plan to do so before the trip.
Table 4: Desired Activities
“JTB Report 2005” Tourism Marketing Institute, 2005
0.0watch natural sceneries watch historical sites relaxing enjoy local food shopping experience exotic activities visiting art galleries, museum visiting people playing marine sports staying at good hotels studying going to concerts attending events, or carnivals playing tennis, golf
10.0 20.0 30.0 40.0 50.0 60.0 70.0
5.2 Effect of Travel Agentsユ Activity on Artist
Art/Culture managers provide opportunities for the people to enjoy the work of art and culture. But their task should not be limited to such activity only; they should also work on the artists. The basic contribution the art/culture managers can perform for the artists is to create good appreciators of their work of art and culture. One indication of such contribution is to increase in quality and/or quantity of the appreciators.
Enhancement, or increase of good appreciators will motivate the creativity of the artists and will serve to promote the level of art and culture.
Then, how can we evaluate the contribution of travel industry to the increase of quality and quantity of the appreciators? As a trial of such evaluation, this study will quantify the effect of travel agencies in increasing the number of spectators to an intangible folk-culture asset, which is a collective effort by artists.
Owara Kaze no Bon Festival is a traditional event of Toyama Prefecture, Japan, that is featured in many tour packages by travel agencies including Club Tourism, the operator of “Tabi no Tomo” magazine tours. The festival takes place in Yatsuo Town every year from September 1 to 3. Its history dates back to the mid-Yedo Period of 18th century. The festival is categorized as a bon odori dance festival that normally is characterized by loud, lively music. But Owara Kaze no Bon Festival is very unlike other bon odori festivals.
The dancers (the citizens of the town) dance from evening to mid-night to a slow, quiet and melancholic music. With its unique beauty, it gained a great popularity all over the nation. During the three nights of the festival, tens of thousands of people visit the small town of Yatsuo that has only 3,000 inhabitants.
This intangible folk-culture asset is a work of Yatsuo townspeople who sing and dance for the festival. The appreciators of the asset are the spectators that come to this town from in and outside the Prefecture to watch this cultural work.
The Yatsuo Administration Center, Toyama (Yatsuo Sogo Gyosei Center) has been publicizing the compiled statistics of the Owara Kaze no Bon Festival since 1989.
The Center announces that in 1989, approximately 160,000 people watched the dance, and in 2000, the spectator crowd reached 300,000. However, since then the total number stabled at around 250,000. This
is probably because the town has placed a limit on the number of tour busses entering the festival premises, to avoid the excessive traffic congestion, and perhaps to mitigate the complaints from both the spectators and the artists arising from the congestion.
Table 5 shows the changes of the total number of spectators to Owara Kaze no Bon Festival since 1989 and the number of tour busses that made prior booking to park and then actually parked. This parking reservation is required of any tour busses that park in the lot during the Festival, however, it is virtually for the travel agencies. Therefore the number of busses can be considered to indicate the number of tour packages organized by the travel agencies. The statistics of the tour busses are available only from 1991.
In Table 5, the bar graph shows the number of
spectators, and the line graph shows the number
of tour busses. Naturally these two elements have
changed in positive correlation. Especially since
1997, a strong correlation is evident. When more
tour packages are operated, more people in total
watched the festival. However, this is no evidence
of travel agenciesʼ contribution to the increase of the
total volume of the spectators. If the total number of
spectators increased by 10% over previous year, and
the tour package also 10%, it could simply mean that
the increased portion of the spectators bought the tour
package. To ascertain the effect of the travel agencies
Pic. 1: Owara Kaze no Bon Poster, 2005
on the artists as an art/culture manager, a firm evidence in necessary that the number of spectators is growing in a rate greater than that of packaged tours, or that the number of spectators who are not on tour package has grown as a result of expansion of tour packages.
Now, when we focus on the changes of the bar graph of Table 5, we notice some peaks and valleys are clearly evident. The peaks are seen in year 1990, 1995, 2000 and 2005. The intervals are all five years. This interval has close relation with the days of the week, i.e., which days the festival days fall on. As previously mentioned, Owara Kaze no Bon festival is held every day from evening till late night. It is a night event. On some nights, the dances are played until almost dawn. Thus it is naturally expected that more people would turn out on nights when the following day is a holiday. Probably on Friday festival nights and Saturday festival nights, more people would visit Yatsuo. In 1990, September 1, 2 and 3 were Saturday, Sunday and Monday. In years 1995 and 2000, the Festival was held on Friday, Saturday and Sunday.
Because the number of spectators is changing in regular intervals, a fairer study can be made possible by analyzing the number by treating them as a group of five years rather than single year.
Table 6 shows the added number of spectators and busses of the five years in each year group. The following is made evident by its comparison of the three year groups.
1) The changes of the number of spectators from the 1st group to 3rd group are 1.08 and 1.09. The ratio
shows constant growth.
2) The number of busses changed from 1st group to 2nd group by 1.33. This is far greater than the growth of spectators. However, from 2nd to 3rd, the growth rate shrinks to 1.03; smaller than that of spectators.
What we can speculate from the above is that: in the 2nd year group of years 1995 to 1999, the travel agencies extensively organized and marketed tour packages to visit Yatsuo for the Owara Kaze no Bon.
So the number of busses grew by 1.33 over the 1st group, while during this period, the spectatorʼs growth is 1.08. The ratio of visitors who came by tour bus in the 2nd group is 16.0%.*
10However in the 3rd group, years 2000 to 2004, the bus growth decreased to 1.03. This indicates that the number of tour packages was unchanged. In other words, the promotion by the travel agencies was unchanged. Here, growth of busses is smaller than that of the spectators. Bus passenger ratio went down to 14.7%.
In the 2nd group, we can assume, the travel agencies made various efforts in promoting tour packages 33% more than the previous group. This promotional effort had influence on the years in the Yatsuo Administration Center 2005
Table 6: Spectators and Busses in Year Groups
Yatsuo Administration Center Data, 2005
year group 90-94 95-99 00-04
spectators (in 000) 1050 1130 1230 bus passenger ratio 13.3 16.0 14.7
busses 669 888 911
spectators change 1.08 1.09
busses change 1.33 1.03
89
Year
350300 250 200 150 100 50 0
1400 1200 1000 800 600 400 200 0
sp ec ta ro es in 0 00 bu ss es
90 91 92 93 94 95 96 97 98 99 00 01 02 03 04 05