九州大学学術情報リポジトリ
Kyushu University Institutional Repository
タンパク質立体構造情報を用いた正の選択の解析
小田, 浩之
http://hdl.handle.net/2324/1937590
出版情報:Kyushu University, 2018, 博士(システム生命科学), 論文博士 バージョン:
権利関係:
Analysis of Positive Selection with Protein Structural Information.
by
Hiroyuki Oda
1. Japanese Foundation for Cancer Research, 3 Chome-8-31 Ariake, Koto, Tokyo, Japan
Abstract
The amino acid residues of a protein have been substituted during the course of the
molecular evolution. The rate and the pattern of the substitutions are different from site to site,
which are considered to be determined by the mixture of various constraints specific to each site.
One of the major constraints is derived from the maintenance of the tertiary structure of the
protein, whereas the constraint to keep the biochemical function of the protein often deviates of
the rate and pattern of the amino acid substitution specified by the structural constraint at the site. It
is known that the amino acid substitutions are accelerated at a site of a protein, when the site has
evolved under positive selection. However, the relationship between the substitution patterns at
positively selected sites and the constraints has not been fully understood. The progress in
computational biology have enabled us to divide the mixture of the constraints into the structural
constraint and the remainings by comparing two types of profiles. One of the profiles is generated
from a multiple amino acid sequence alignment, which represents the mixture of constraints. The
other is generated from the tertiary structure of a protein, which represents the structural
constraints. I applied the profile comparison method to proteins under positive selection to
examine the relationship between the positive selection and constraints. The results suggested that
the constraint at a site under positive selection tends to be subject to the functional constraint at the
site.
Contents
1. Introduction ………..………5
1.1. Positive Selection……..………5
1.2. Structural and Functional Constraints at a Site………..……..8
1.3. Profile Comparison…..……….…...9
1.4. Analysis of Positive Selection by Profile Comparison…………...12
2. Materials and Methods ………14
2.1. Dataset ………...14
2.1.1. Enzymes ………...………14
2.1.2. Proteins under Positive Selection with Available Coordinates.16 2.2. Profile Comparison ……….18
2.3. Estimation of Positively Selected Codon Sites ………..…….21
2.4. Statistical Evaluation for Detection of Functional Constraints.25 2.4.1. Wilcoxon rank sum test ………25
2.4.2 Meta-analysis ………...26
3. Results ……….30
3.1. Validation of Profile Comparison as a Method to Detect the Functional Constraints ……….……….. ………30
3.2. Examination of the constraints at the positively selected sites by profile comparison ………..37
4. Discussion ………..46
Acknowledgments………..56
References ………...57
1. Introduction
1.1. Positive Selection
Amino acid sequences of proteins have changed by substitution, insertion and
deletion during the course of the molecular evolution. However, the rate and the pattern
of the change are different from site to site, according to the constraints working at the
sites. For example, when amino acid residues are conserved, the corresponding sites are
considered to be under strong structural and/or functional constraint. Such residue
conservation is maintained by purifying selection or negative selection. That is, the
individual with the mutations at such sites are eliminated rapidly from the population if
the mutated residues do not fit the constraints at the sites. As a consequence, the
residues at such sites have been conserved. The catalytic residues of enzymes are
conserved by this mechanism. Contrary to that, positive selection is known as a driving
force to accelerate amino acid substitutions, resulting in divergence at the sites under
positive selection. Quite a few examples of diverged sites under positive selection have
been reported in various proteins (Fitch et al., 1997, Lynch, 2007, Tian et al., 2008,
Yang and Swanson, 2002, and Yang, 2006). A well-known example is the variation at
the antigenic determinant sites of pathogenic antigens (Agileta et al., 2009). Such sites
are recognized by the immune system of the hosts. Amino acid substitution at the sites
could increases survival rate of the pathogen by escaping from the attacks by the host’s
immune system. Thus, the rate of amino acid substitutions at the antigenic determinant
sites has been accelerated. As described above, the relationship between the negative
selection and the constraints at a site has been well understood. However, the
understanding about the relationship between the positive selection and the constraints
has not been fully investigated. In this manuscript, I focus on this problem.
To date, various phylogenetic methods to detect positively selected sites have
been developed, which are roughly classified into two approaches. One of the
approaches uses the ratio as a measure for the positive selection (Fitch et al., 1997;
Nielsen and Yang, 1998; Suzuki and Gojobori, 1999; Yang et al., 2000; Kosakovsky
Pond and Frost, 2005; Massingham and Goldman, 2005). The ratio is defined as the
ratio of non-synonymous substitution rate to synonymous substitution rate. The
synonymous substitution is a nucleotide substitution in a codon, which does not change
the amino acid residue encoded by the codon. Therefore, the synonymous substitution is
regarded as neutral at protein level. On the other hand, the non-synonymous substitution
is a nucleotide substitution in a codon, which changes the encoded amino acid residue.
The greater than 1.0 indicates that the amino acid substitution is accelerated
comparing to the neutral change. Therefore, the site with > 1.0 is considered to have
evolved under positive selection. In the other approach, positively selected sites are
detected based on the assumption that the changes in physicochemical character of
amino acid residues at positively selected sites are larger than those at the remaining
sites (Hughes et al., 1990; Rand et al., 2000; Zhang, 2000; Suzuki, 2007). They divide
amino acid substitutions into two groups, “conservative” and “radical”, based on the
physicochemical properties of the amino acid residues. The former is the change
between the residues with similar properties, such as the substitution within charged
residues. Whereas the latter is the change between the residues with different
physicochemical properties, such as the substitution between neutral residues (e.g.
leucine) and charged residues (e.g. arginine). Currently, the approach with the ratio is
widely utilized for the detection of positively selected sites, and many sophisticated
statistical methods have been developed for the approach (Yang and Nielsen, 2002;
Wilson and McVean, 2006; Dutheil et al., 2012; Gharib et al., 2013; Redelings, 2014;
Zaheri et al., 2014; Angelis et al., 2014).
1.2. Structural and Functional Constraints at a Site
It is well known that the tertiary structures of proteins have been more
conserved than the amino acid sequences during the course of molecular evolution
(Chothia and Lesk, 1986; Russel and Barton, 1994). This observation suggested that the
constraint to maintain protein folds is one of the major factors in the evolution of
proteins, and hereafter they are referred to as “structural constraint”. For example, the
residues constituting the hydrophobic cores of globular proteins are subjected to strong
structural constraints. On the other hand, it is also known that the constraints on the
amino acid sites critical for the protein functions often deviate from the structural
constraint (Elcock AH., 2001; Ota et al., 2003). Such examples can be found in the
catalytic sites of enzymes. The amino acid residues constituting the catalytic sites are
often polar or charged, even when these residues are located in the hydrophobic cavity.
Despite the disadvantages from the structural viewpoint, such catalytic sites in the
hydrophobic environment are invariant among the homologues (Ota et al., 2003). This
means that the catalytic sites are subjected not only to structural constraint, but also to
functional constraints. In actual situation, the amino acid substitutions at each site in the
primary structure of a protein are considered to have occurred by the influences of both
the structural and the functional constraints during the evolutionary process, but the
relative intensities of these constraints are considered to differ from site to site. In this
manuscript, I investigate the relationship between the site specific constraints and
positive selection at the site.
1.3. Profile Comparison
Two groups have independently developed methods to evaluate the
deviation of the constraint from the structural constraint at each site, by comparing two
types of profiles. In the approach developed by Chelliah et al. (2004), both profiles are
calculated from a multiple amino acid sequence alignment and take the same form, a
matrix with the size of 20 x L, where L represents the alignment length. The (i, j)
element of the matrix is the frequency of the i-th amino acid residue at the alignment
site j. The elements of one of the profiles are directly calculated as the residue
frequencies at each alignment site, whereas the elements of the other profile are
calculated by taking the average of the substitution pattern of 20 amino acids over the
residue type and the structural environment at the alignment site. The substitution
pattern for a residue type and a structural environment is derived from the environment-
specific substitution tables designed for local structural environments such as secondary
structures and the accessibility of water molecules of the protein structure under
consideration (Overington, et al., 1992; Chelliah, et al. 2004). A column of the former
profile represents the mixture of the constraints at the corresponding alignment site,
whereas the corresponding column of the latter profile represents the structural
constraints at the site. The deviation between the constraints at each alignment site is
evaluated by the modified Kullback-Leibler divergence of the residue frequencies
between the corresponding columns of the two profiles. On the other hand, Cheng et al.
(2005) calculated two profiles as the position specific scoring matrices (PSSM), by the
method used for PSI-BLAST (Altschul et al., 1997). One of the PSSMs is calculated
from a multiple amino acid sequence alignment of homologous proteins. The other
PSSM is calculated from an alignment of amino acid sequences, which are generated to
fit a given tertiary structure by Rosetta Design (Kuhlman and Baker, 2000). A column
of the former PSSM represents the mixture of the constraints at the alignment site,
whereas a column of the latter PSSM represents only the structural constraints at the
corresponding site. The deviation between the constraints at a site is evaluated by the
Euclidian distance between the corresponding columns of the two PSSMs. Hereafter,
this approach, which compares two types of profiles, is referred to as “profile
comparison”. Both groups applied their methods for the prediction of active sites (which
includes catalytic sites and ligand binding sites). In their applications, the groups
predicted that the sites with large deviations from the structural constraints would be
active sites. However, the predictions with only the information about the deviations
from the structural constraint did not show high performance. Chelliah et al. (2004)
recognized this problem and described in their paper as follows: Enzymes often include
sites under the other types of constraints, in addition to the active sites. For example,
such sites include the residues involved in metal ion binding to maintain the local
conformations of proteins, and those forming interfaces for protein-protein interactions.
These sites are also subjected to the constraints related to the functions as well as
structural constraints, although the reports about such sites are rare, comparing to those
about the active sites. The situation is considered to be the cause of the false positives of
their prediction (Chelliah et al., 2004). Therefore, the two groups included other
measures, such as residue conservation and free energy, to improve the prediction
performance. However, the profile comparisons are useful as a tool to evaluate the
deviation from the structural constraints. So, I applied the method to the analyze the
positive selection and the constraints. The deviation from structural constraint is
considered to be caused by the requirement of biochemical functions such as catalytic
activity or ligand binding. In this manuscript, therefore, the deviation is referred to as
functional constraint.
1.4. Analysis of Positive Selection by Profile Comparison
As described above, the negative selection to generate residue conservation is
associated with structural and/or functional constraints. Lynch et al. (2007) recently
suggested that the positive selection to generate residue divergence is associated not
with structural constraints but with functional constraints. However, the relationship
between the site specific constraint and the positive selection has not been systematically
investigated.
To understand the relationship between the site specific constraint and the positive
selection, I applied the profile comparison method as a tool to evaluate the functional
constraint at each alignment site, rather than to predict active sites. Moreover, I have
developed a new profile comparison method, and applied it to the characterization of
the positively selected sites. At first, I examined whether my method can actually detect
the functional constraint from the structural one, by applying the method to enzymes. I
subsequently applied the method to proteins under positive selection. The positively
selected sites were identified based on the ratio. I found that the constraints at the
amino acid sites under positive selection tend to deviate from the structural constraints,
as compared to the sites unrelated to the positive selection. If the amino acid
substitutions according to the structural constraint are regarded as “conservative”, and
those that deviate from the structural constraints as “radical”, then my study can be
considered to connect the two approaches for the detection of positive selection, the
approaches with the ratio (Fitch et al., 1997; Nielsen and Yang, 1998; Suzuki and
Gojobori, 1999; Yang et al., 2000; Kosakovsky Pond and Frost, 2005; Massingham and
Goldman, 2005) and those with the radical-conservative ratio (Hughes et al., 1990;
Rand et al., 2000; Zhang, 2000; Suzuki, 2007).
2. Materials and Methods
2.1. Dataset 2.1.1. Enzymes
I used the enzymes registered in the Catalytic Site Atlas (CSA,
http://www.ebi.ac.uk/thornton-srv/databases/CSA/, Porter et al., 2004), a database for
the active sites of enzymes with available coordinates data. To construct reliable
PSSMs, I selected the enzymes based on the number of available putative orthologous
sequences. For the selection, I performed a BLAST search through the KEGG GENE
DATABASE (http://www.genome.jp/kegg/genes.html, Kanehisa and Goto, 2000) with
the amino acid sequence of each enzyme from CSA as a query. The putative orthologs
were defined by the following four criteria: (1) The E-value is less than 0.01. (2) The
percent sequence identity is greater than 30 %. (3) The coverage of the aligned region is
greater than 75 % of the full length of the query. (4) When multiple sequences
satisfying the above conditions are obtained from a source organism, the sequence with
the lowest E-value is selected as a putative ortholog from the source. In this study, only
the enzymes with at least 100 putative orthologs were selected. Even though the above
conditions were satisfied, the enzymes were excluded from the analysis, if any of their
structures have not been determined at resolutions higher than 2.5Å. The number of
selected enzymes was 87. The putative orthologs thus obtained were aligned with the
query by MAFFT (Katoh et al., 2002; Katoh and Toh, 2008). The coordinates data were
obtained from the PDB (http://www.rcsb.org/pdb/home/home.do, Berman et al., 2000).
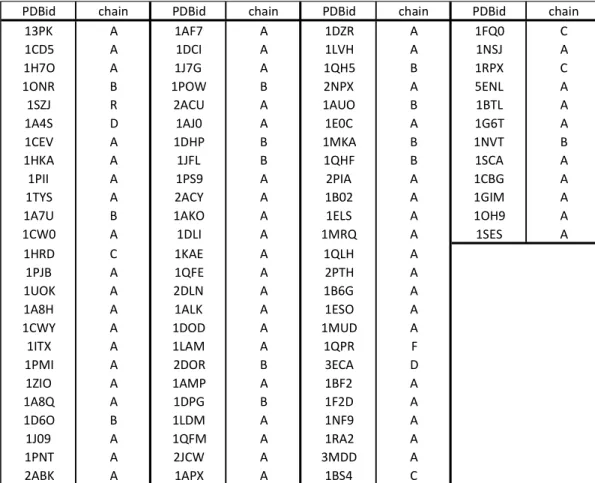
The PDB IDs and chains of the enzymes used in this study are listed in Table 1.
Table 1. The PDB IDs and chains of the enzymes used in this study.
2.1.2. Proteins under Positive Selection with Available Coordinates
The proteins used for this study should satisfy the following two conditions:
(1) The detection of positively selected sites have been conducted by using an alignment
consisting of at least 10 nucleotide sequences. (2) The coordinates data for at least one
sequence are available for the construction of the 3D-profile. The X-ray structures with
PDBid chain PDBid chain PDBid chain PDBid chain
13PK A 1AF7 A 1DZR A 1FQ0 C
1CD5 A 1DCI A 1LVH A 1NSJ A
1H7O A 1J7G A 1QH5 B 1RPX C
1ONR B 1POW B 2NPX A 5ENL A
1SZJ R 2ACU A 1AUO B 1BTL A
1A4S D 1AJ0 A 1E0C A 1G6T A
1CEV A 1DHP B 1MKA B 1NVT B
1HKA A 1JFL B 1QHF B 1SCA A
1PII A 1PS9 A 2PIA A 1CBG A
1TYS A 2ACY A 1B02 A 1GIM A
1A7U B 1AKO A 1ELS A 1OH9 A
1CW0 A 1DLI A 1MRQ A 1SES A
1HRD C 1KAE A 1QLH A
1PJB A 1QFE A 2PTH A
1UOK A 2DLN A 1B6G A
1A8H A 1ALK A 1ESO A
1CWY A 1DOD A 1MUD A
1ITX A 1LAM A 1QPR F
1PMI A 2DOR B 3ECA D
1ZIO A 1AMP A 1BF2 A
1A8Q A 1DPG B 1F2D A
1D6O B 1LDM A 1NF9 A
1J09 A 1QFM A 1RA2 A
1PNT A 2JCW A 3MDD A
2ABK A 1APX A 1BS4 C
better than 2.5 Å resolution were used for the analyses, except for 1OZ6 (2.6 Å).
Accordingly, six proteins were selected: (a) haemagglutinin (HA) of influenza A virus
(PDB ID: 2VIU), (b) group I snake phospholipase A2 (PLA2, PDB ID: 1A3D), (c) group
II snake PLA2 (PDB ID: 1OZ6), (d) scorpion -toxin (PDB ID: 2ASC), (e) scorpion -
toxin (PDB ID: 2I61), and (f) class I major histocompatibility protein (MHC, PDB ID:
3MRG). The positive selections of the proteins were reported as follows: HA of
influenza A virus (Fitch et al., 1997), groups I and II snake PLA2 (Lynch, 2007),
scorpion -toxin (Weinberger et al., 2010), scorpion -toxin (Tian et al., 2008), and
class I MHC (Yang and Swanson, 2002). I re-identified the positively selected sites of
the proteins, as described below. Group I PLA2 is homologous to group II PLA2.
However, they constitute distinctive groups in the snake venoms, based on the large
sequence variation, the distinct patterns of disulfide bridges, and the different source
organisms (Davidson and Dennis, 1990). Therefore, they were treated as different data.
The -toxin is also homologous to the -toxin (Rodríguez de la Vega and Possani,
2005), but their sequences and structures have highly diverged. Therefore, the two
scorpion toxins were treated as different data, like the two groups of PLA2.The
nucleotide sequences for the homologs of the proteins, except for the class I MHC
protein, were collected from NCBI (http://www.ncbi.nlm.nih.gov/nuccore) based on the
reports about each protein (Fitch et al., 1997; Lynch, 2007; Tian et al., 2008;
Weinberger et al., 2010). The sequence data for the class I MHC protein were obtained
from the data included in the PAML package
(http://abacus.gene.ucl.ac.uk/software/paml.html, Zhang et al., 2005). The amino acid
sequence data were generated by translating the nucleotide sequences. Since the number
of sequences of HA used in Fitch et al. (1997) was too large to be subject to PAML, I
selected the 88 sequences, so that every pair of the 88 sequences had synonymous
nucleotide distance equal to or more than 0.02. The pairwise distance was calculated by
the Nei-Gojobori method (Nei and Gojobori, 1986), using MEGA 4.0.2
(http://evolgen.biol.metro-u.ac.jp/MEGA/, Tamura et al., 2007).
2.2. Profile Comparison
A multiple amino acid sequence alignment was constructed for each protein by
MAFFT v6.2240 with the accurate option L-INS-i (Katoh et al., 2002; Katoh and Toh,
2008). The PSSM generated from the multiple amino acid sequence alignment was used
as the sequence profile in this study. The PSSM constructed by the method used in PSI-
BLAST (Altschul et al., 1997) was widely utilized for various bioinformatics
investigations (e.g. Ho et al., 2007; Huang and Yuan, 2013). I also adopted the method
to construct a PSSM from a multiple sequence alignment in this study. The Henikoff-
Henikoff sequence weight (Henikoff and Henikoff, 1994) was introduced to account for
the taxonomic bias. The pseudo count was also used for the calculation of residue
frequencies, although , the parameter for the pseudo count weight, was set to 0.1 in
this study.
The 3D-profile of a structure was used as the structure profile in this study,
and was generated by the method to evaluate the structural stability (Ota et al., 2001).
Three knowledge-based potential energies in the program, side-chain packing
(including side-chain and main-chain interactions), hydration, and local conformational
functions, were used to calculate the energy scores, and their simple summation
provided the total energy score. To construct the column of the 3D profile at a residue
position, the original amino acid was virtually substituted with other amino acids at the
position in the protein structure (Godzik et al., 1992). The potential energies of each
substituted residue and the original residue was then calculated. The side-chain packing
was considered by calculating the energy at each rotamer and preventing the virtually
substituted residue from bumping into the other residues within the structural
environment of the position. The best score among the rotamers of an amino acid
provided the score of the amino acid. The potential energies thus calculated were
assigned to 20 rows in the column, corresponding to the 20 residues.
The elements of both the 3D-profiles and PSSMs have the structure of log-
odds of the estimated frequency to the background frequency. Therefore, I directly
compared the corresponding columns of the two profiles, to evaluate the difference as
the Pearson’s correlation coefficient.
20
1 2
2 2 20
1 1
1 1
20 1
2 2 2 2 20
1
2 1 1 1 20
1
2 2 2 1
1 1
) , ( 20 3
1 ), , 20 (
1
) )
, ( 3
( ) )
, ( (
) )
, ( 3
)(
) , ( ( t
coefficien orrelation
i i
i i
i
j i ofile D j
j i PSSM j
j j
i ofile D j
j i PSSM
j j
i ofile D j j
i PSSM
Pr
Pr Pr
c
In this equation, PSSM(i,j1) is the element of PSSM for an amino acid i at an
alignment site j1. 3DProfile(i,j2) is the element of the 3D-profile for amino acid i at an
amino acid position j2, which corresponds to an alignment site j1. 1(j1) is the average of
the elements of PSSM at the alignment site j1. 2(j2) is the average of the elements of
the 3D-profile at the amino acid position j2. When more than 30 % of the sequences
were occupied by gaps at an alignment site, the profile comparison was skipped at the
site.
Figure 1 shows a schematic overview of the profile comparison in my study.
Figure 1. A schematic overview of the profile comparison in my study.
2.3. Estimation of Positively Selected Codon Sites
As described above, the six proteins used in this study are known to have
evolved under positive selection (Fitch et al., 1997; Yang and Swanson, 2002; Lynch,
2007; Tian et al., 2008; Weinberger et al., 2010). In each protein, the codon sites that
have been subjected to positive selection were estimated by the following procedure. (1)
The nucleotide sequences were translated into the amino acid sequences. A multiple
amino acid sequence alignment was constructed for each protein with the translated
sequences, using MAFFT v6.2240. (2) A nucleotide sequence alignment was made, in
which the gap positions were consistent with those in the corresponding amino acid
sequence alignment. The codon sites including gaps were neglected from the
subsequent analyses. (3) Based on the nucleotide sequence alignment made by MAFFT,
a phylogenetic tree for each protein was constructed by the neighbor-joining method
Saitou and Nei, 1987). MEGA 4.0.2 (http://evolgen.biol.metro-u.ac.jp/MEGA/, Tamura
et al., 2007) was used for the tree construction. (4) The tree thus obtained and the
nucleotide sequence alignment were used as input data for the CODEML module of
PAML ver. 4.3 (Yang, 2007), to identify the positively selected codons. The analysis of
positive selection by CODEML consisted of two steps. The first step is to examine
whether the sites under positive selection are included in the given alignment by the
likelihood ratio test. The likelihood ratio test uses the built-in models of PAML, such as
M7 and M8, as the null and alternative hypotheses, respectively. In the models, a
parameter denoted as is introduced, which indicates the ratio of non-synonymous
substitution rate to synonymous substitution rate. The non-synonymous and
synonymous substitutions are defined as the nucleotide substitutions in a codon, which
change and do not change the amino acid encoded by the codon, respectively. If there is
no positive selection to accelerate the amino acid substitutions, is less than 1.0, since
the synonymous substitution is free from the selection at protein level whereas the
change of amino acid by the non-synonymous substitution somehow affects the
structure and/or function of the protein. When the coding region is free from the
constraints at protein level, equals to 1.0. Such is observed for pseudogenes. The
acceleration of amino acid substitutions by positive selection is captured by evaluating
the acceleration of the non-synonymous substitution rate, comparing to the synonymous
substitution rate, that is, > 1.0. The null hypothesis M7 assumes that the distribution
of follows beta distribution and that all of the alignment sites fall into one of the ten
categories of < 1. In contrast, M8 has the additional category of > 1, which
indicates positive selection, as well as the ten categories used in M7. If the null
hypothesis M7 is rejected, then the proteins encoded by the nucleotide sequences are
regarded as undergoing positive selection. When M7 is rejected, I go to the second step,
where each codon site was examined by the Bayes Empirical Bayes (BEB) method
under the M8 model. In BEB, the posterior probabilities for the 11 categories of were
calculated for each codon site. When the posterior probability for the >1 category was
greater than 0.95, the site was regarded as undergoing positive selection in this study.
For more details, see Yang et al. (2005) and Yang (2007). Thus, the PAML can indicate
the codon sites under positive selection. In this study, however, amino acid sequences
were used for the profile comparison. So, I marked the amino acid sites corresponding
to the positively selected codon sites (see Table 5), instead of marking on nucleotide
sequences.
All six proteins used in this study have previously been reported to be under
positive selection (Fitch et al., 1997; Yang and Swanson, 2002; Lynch, 2007; Tian et
al., 2008; Weinberger et al., 2010). However, the sequence data used in this study were
not always the same as those used in the literature. Therefore, I began my study from
scratch to reconfirm that the collected sequences are subject to positive selection. The
null hypothesis M7 was rejected for all cases examined here, and the presence of
positively selected sites was suggested for the six proteins.
2.4. Statistical Evaluation for Detection of Functional Constraints 2.4.1. Wilcoxon rank sum test
The Wilcoxon rank sum test was used to evaluate (i) the difference in the
distribution of the correlation coefficients between the active and non-active sites and
(ii) that between the positively selected sites and the remaining sites (non-positively
selected sites). The test was applied to the distribution of the correlation coefficients for
each protein. The null hypothesis for (i) was that the median of the distribution of the
active sites is the same as that for the non-active sites. The null hypothesis for (ii) was
that the median of the distribution of the positively selected sites is the same as that for
the remaining sites. The significance level of both tests was controlled for FDR (false
discovery rate) of 0.05 by the Benjamini-Hochberg (BH) method (Benjamini and
Hochberg, 1995).
2.4.2 Meta-analysis
I obtained the results of the Wilcoxon rank sum test for each protein. As described
below, however, it was difficult to derive a general tendency from the Wilcoxon rank sum test.
Therefore, I carried out data synthesis by the Mantel-Haenszel method (Mantel and Haenszel,
1959), the Peto method (Yusuf et al., 1985), the DerSimonian-Laird method
(DerSimonian and Laird, 1986; DerSimonian and Laird, 2015) and the Restricted
maximum-likelihood method (Corbeil and Searle, 1976). At first, I constructed a 2 x 2
contingency table for each protein (see Figure 2). For problem (i), Categories 1 and 2 indicate the
active and non-active site. In the case of problem (ii), the two categories correspond to the
positively selected sites and the remaining sites. The columns correspond to the division of the
sites, based on the correlation coefficient. The first and second columns are the categories of the
sites with correlation coefficients < and > , respectively. A weak and negative correlation
coefficient is considered to indicate functional constraint. Therefore, I examined 0.0, 0.1, 0.2 and
0.3 as . The symbols “a” and “c” in Figure 2 indicate the numbers of sites with correlation
coefficients < , which belong to Categories 1 and 2. Likewise, the symbols “b” and “d” indicate
the numbers of sites with correlation coefficients > , which belong to Categories 1 and 2. The
meta-analyses were performed by integrating the contingency table for every protein family.
There are two types of meta-analysis. One of them assumes the homogeneity of the data, whereas
the assumption of homogeneity is not required for the others. I therefore evaluated homogeneity
of the data under consideration by the Cochran Q-test (Cochran, 1954) to determine which type of
the meta-analyses should be used for this study. I also calculated I2 value for evaluating the
heterogeneity (Higgins et al., 2003). I2 is calculated:
I2=100×(Q − df)/Q
Where Q is Cochran's heterogeneity statistic, and df indicates the degrees of freedom. Q is
dependent on the meta-analysis method to be used. I used the metafor package to calculate Q.
Negative values of I2 are treated as zero in order to keep I2 between 0% and 100% (Higgins et
al., 2003.). In this study, I2 < 25 % was adopted as a criterion of low heterogeneity,
which is often used as a rule of thumb (Hatala et al., 2005). As described below, the
some cases. After the check of the homogeneity of the data, the synthesis of the data was carried
out by the Mantel-Haenszel method, the Peto method, the DerSimonian-Laird method
and the Restricted maximum-likelihood method. The significance level was set to 0.05 for
both problems. Both the statistical test by the meta-analyses and the test of homogeneity were
performed with a meta-analysis package of R, metafor. A schematic overview of statistical tests
employed in my study is shown in Figure 3.
Figure 2. Outline of the meta analysis.
Figure 3. A schematic overview of individual analyses and the synthesis employed in this study.
The plots in the central panel indicate individual analyses by Wilcoxon rank sum test. Categories 1
and 2 correspond to the two items separated by “vs” in the left side of Figure 3. The circles in a
category correspond to correlation coefficients obtained by the profile comparison at the sites
belonging to the category of each protein. The data of the correlation coefficients of each protein is
transformed into a contingency table, and the logarithm of the pooled odds ratio is subject to the
synthesis.
3. Results
(Meta-Analysis)
3.1. Validation of Profile Comparison as a Method to Detect the Functional Constraints
The object of this manuscript is to examine the relationship between the substitutions at
positively selected sites and the functional constraints. Before the analysis, I examined
whether my profile comparison method can actually detect functional constraints. For
the examination, I used enzymes, since several studies (Elcock AH., 2001; Ota et al.,
2003) suggested that the constraints at the catalytic sites of enzymes deviate from the
structural one. Representative distributions of the correlation coefficients calculated
from several enzymes (alkaline phosphatase (PDB ID, 1ALK chain A), aminoacyl-
tRNA synthase (PDB ID, 1A8H chain A), Alanine dehydrogenase (PDB ID, 1PJB chain
A), L-asparaginase II (PDB ID, 3ECA chain D)) are shown in Figure 4. As shown in
Figure 4, the distributions are skewed to the positive sides. Since the correlation
coefficient is the Pearson’s correlation coefficient between the PSSM and the 3D-
profile, the skew indicates that the evolution of many sites has mainly been dominated
by the structural constraints. In contrast, every protein has a long tail, which extends to
the negative side. The correlation coefficient in the tail region indicates the low
correlation between the corresponding columns of the PSSM and the 3D profile.
Therefore, it is considered that the alignment sites constituting the tail have been
subjected to other constraints than structural constraints.
Figure 4. Representative examples of the correlation coefficient
distributions.
To examine whether the functional residues have lower correlation
coefficients corresponding to those of the tail region, I performed the following
statistical tests. I used the active sites of the 87 enzymes, registered in the Catalytic Site
Atlas (CSA, Porter et al., 2004), as the residues under strong functional constraints. The
correlation coefficients of all of the sites in the enzymes were calculated by my profile
comparison. The correlation coefficients were then divided into two sets: one
corresponding to the active sites, and the other comprising the remaining sites. Thus, the
latter set does not include the active sites, but may include the residues under functional
constraints, such as the sites corresponding to the ligand binding residue and the
interface residues for protein-protein interactions, which are not been registered as
active site in CSA. I assumed that the number of such sites is relatively small in the
latter set. Under this assumption, the distribution of the correlation coefficients for the
latter set is considered to approximately reflect that of the non-active sites. I applied the
Wilcoxon rank sum test to each enzyme family, to evaluate the difference in the
distribution of correlation coefficients between the two sets. The p-values were
corrected by the BH method. Among the 87 cases, 33 showed that the median of the
correlation coefficients of the active sites is lower than that of the non-active sites, with
statistical significance. Thus, it was difficult to determine whether the functional
constraints actually cause the deviation from the structural constraints by the analysis of
each enzyme family, although the correspondence between the low correlation
coefficient and the existence of the function was observed in about 38% of the
examined families. Therefore, I performed a meta-analysis, by regarding the 87 cases as
independent studies. To construct a contingency table for the test, I examined four
threshold values for correlation coefficient, 0.0, 0.1, 0.2 and 0.3, to divide the alignment
sites into two groups. For each threshold value, the 87 contingency tables were
examined by the Fisher's exact test as other individual studies, before the meta-analysis.
Out of 87 enzyme families, however, only a few enzyme families showed statistical
significance (data not shown). Thus, no clear result was obtained by the individual
studies, like the results by the Wilcoxon rank sum test. Therefore, I examined the meta-
analysis with the contingency tables. Each result of the meta-analyses by the Mantel-
Haenszel method, the Peto method, the DerSimonian-Laird method and the Restricted
maximum-likelihood method is shown in Table 2. As shown in Table 2, the results of
the four examinations were the same. Even the tests without the assumption of the
homogeneity such as the DerSimonian-Laird method and the Restricted maximum-
likelihood method supported the results of the Mantel-Haenszel tests. So, I describe the
result for the threshold value of 0.1. No significant heterogeneity of the logarithm of the
pooled odds ratio was observed among the 87 protein families (See Table 3.).
Therefore, I applied the Mantel-Haenszel method to the protein families. The logarithm
of the pooled odds ratio was 1.76, and its p-value was less than 0.001. The confidence
interval was (1.52, 2.00), which did not include 0. These results suggested that the
frequency of the residues with a correlation coefficient < 0.1 in the set of active sites is
greater than that in the set of non-active sites, with statistical significance. I also
examined the meta-analysis by the Peto method (Yusuf et al., 1985), the DerSimonian-
Laird method (DerSimonian and Laird, 1986; DerSimonian and Laird 2015), and the
restricted maximum-likelihood method (Corbeil and Searle, 1976). Like the results of
the Mantel-Haenzel test, the p-value was less than 0.001 and the confidence interval did
not include 0, even when the threshold value was set to 0.0, 0.2 or 0.3. The details of the
two cases were summarized in Table 2. All of the results from these methods, except for
the result of the Cochran Q-test and I2 for Peto method, were the same as those obtained
from the Mantel-Haenszel method using 0.1 as a threshold for (See Table 2 and Table
3.).
Table 2. The results of meta-analyses for the 87 protein families (enzymes) by the DerSimonian-Laird method, the Restricted maximum-likelihood method, the Peto method and the Mantel-Haenszel method.
Mantel-Haenszel method
logarithm of the pooled odds ratio confidence interval p-value
0.0 1.73 1.49-1.98 <.0001
0.1 1.76 1.52-2.00 <.0001
0.2 1.84 1.58-2.10 <.0001
0.3 1.84 1.56-2.12 <.0001
Peto method
logarithm of the pooled odds ratio confidence interval p-value
0.0 2.89 2.53-3.24 <.0001
0.1 2.54 2.23-2.85 <.0001
0.2 2.21 1.94-2.48 <.0001
0.3 1.86 1.61-2.10 <.0001
DerSimonian-Laird method
logarithm of the pooled odds ratio confidence interval p-value
0.0 1.79 1.52-2.06 <.0001
0.1 1.71 1.44-1.97 <.0001
0.2 1.64 1.37-1.90 <.0001
0.3 1.49 1.21-1.77 <.0001
Restricted maximum-likelihood method
logarithm of the pooled odds ratio confidence interval p-value
0.0 1.79 1.52-2.06 <.0001
0.1 1.71 1.44-1.97 <.0001
0.2 1.64 1.37-1.90 <.0001
0.3 1.49 1.21-1.77 <.0001
Table 3. Assessment of heterogeneity for the 87 protein families (enzymes) by the Mantel-Haenszel method, the Peto method, the DerSimonian-Laird method and the Restricted maximum-likelihood method.
*: A symbol Q indicates Cochlan's Q, which was calculated by an R package, ‘metafor’
(Viechtbauer, W., 2010).
**: A symbol df indicates the degrees of freedom for each statistical evaluation.
***: I2 =100%× (Q − df)/Q. When I2 takes a negative value, the I2 is treated as zero in order for I2 to be restricted between 0% and 100% (Higgins et al., 2003.).
3.2. Examination of the constraints at the positively selected sites by profile comparison
Mantel-Haenszel method
Q* df** I2 *** p-value
0.0 67.3498 86 0 0.9317
0.1 70.9639 86 0 0.8789
0.2 66.5828 86 0 0.9403
0.3 63.2038 86 0 0.9692
Peto method
Q* df** I2 *** p-value
0.0 230.5213 86 63 < .0001
0.1 184.8006 86 53 < .0001
0.2 129.5104 86 34 0.0017
0.3 89.5603 86 4 0.4041
DerSimonian-Laird method
Q* df** I2 *** p-value
0.0 67.1880 86 0 0.9336
0.1 70.8111 86 0 0.8815
0.2 64.3222 86 0 0.9612
0.3 57.0546 86 0 0.9932
Restricted maximum-likelihood method
Q* df** I2 *** p-value
0.0 67.1880 86 0 0.9336
0.1 70.8111 86 0 0.8815
0.2 64.3222 86 0 0.9612
0.3 57.0546 86 0 0.9932
As described in section 3.1, my profile comparison method can detect
functional constraints. Therefore, I applied the method to examination of the
relationship between the substitutions at positively selected sites and the functional
constraints. I applied the profile comparison to six protein families, which reportedly
evolved under positive selection, and calculated the correlation coefficient between the
two profiles at each alignment site (see Materials and Methods). At first, I applied the
profile comparison to the six protein families. The distributions of the correlation
coefficients are shown in Figure 5. The shapes of the distributions are similar to those
shown in Figure 4. In particular, the skew to the positive side and the long tail to the
negative side are observed in the distributions. Next, I identified the codons under
positive selection, by using PAML (Yang, 2007). The likelihood ratio tests suggested
that all of the examined proteins include codon sites under positive selection (the results
of the likelihood ratio tests are shown in Table 4). The results of the analysis are
summarized in Table 5, in which the positively selected sites, or the amino acid sites
corresponding to the codons under positive selection, are indicated by the residue
positions in the PDB structures used in this study. The locations of the positively
selected sites in the distributions of the correlation coefficients are indicated by the
arrows over the bars in Figure 5.
Figure 5. Distributions of the correlation coefficients for the six protein
families under positive selection.
Table 4. The result of likelihood ratio tests.
I examined whether a difference existed in the distribution of the correlation
coefficients between the positively selected sites and the remaining sites of each protein,
by the Wilcoxon rank sum test. The p-values were corrected by the BH method. Out of
the six protein families, the corrected p-values for four protein families were less than
0.05 (see Table 6). As in the analysis of the enzymes, however, it was difficult to derive
an apparent conclusion from the Wilcoxon rank sum test. Therefore, I regarded the
analysis of each protein family as an independent study, and re-examined the six protein
families by the meta-analysis. Like the analysis of the enzymes described above, I used
each of four threshold values of the correlation coefficient, 0.0, 0.1, 0.2 and 0.3, to
construct a contingency table. Before the analysis of the logarithm of the pooled odds
ratio, I examined the statistical significance of each contingency table of the six protein Protein name M7(l0) M8 (l1) 2(l1-l0) p-value
HA -5902.809 -5866.836 71.947 >0.001
Group I PLA2 -6708.212 -6537.673 341.077 >0.001 Group II PLA2 -7338.229 -7188.751 298.956 >0.001
-toxin -3183.430 -3152.503 61.853 >0.001
-toxin -791.538 -784.847 13.384 0.001
MHC -8036.603 -7559.384 954.438 >0.001
families by the Fisher's exact test as other individual studies. Out of six protein families,
however, no family showed statistical significance under any threshold value (data not
shown). Then, I examined the meta-analysis with the contingency tables.
Before carrying out meta-analyses, I evaluated heterogeneity of the data under consideration by
the Cochran Q-test and I2 (See Table 7.) to select an appropriate method of data synthesis. The
Cochran Q-test did not suggest significant heterogeneity among the six proteins (p-
value >0.05) for either the Mantel-Haenszel method or the Peto method. Either I2
calculated for the Mantel-Haenszel method or the Peto method was 0% under =0.0,
0.1, and 0.2. When was set to 0.3, the I2 calculated for the Mantel-Haenszel method
was 13% and that for the Peto method was 25%. Ordinarily, I2 < 25 % is used as a
criterion for the low heterogeneity and 25% < I2 < 50 % is used as a criterion for
moderate heterogeneity (Hatala et al., 2005). Thus, the homogeneity among the data
was assumed, and then the synthesis of the data was carried out by Mantel-Haenszel method for
either threshold value of . The results of Mantel-Haenszel test with four threshold
values were the same. So, I here describe only the case of the threshold value of 0.1.
The details of the other threshold values were summarized in Table 8. The logarithm of
the pooled odds ratio was 1.01, with a p-value less than 0.001. The 95 % confidence
interval of the logarithm of the pooled odds ratio was (0.53, 1.49). The lower bound of
the interval is more than 0.0, suggesting that the frequency of the residues with a
correlation coefficient < 0.1 in the set of positively selected sites is greater than that in
the set of remaining sites, with statistical significance. I also examined the meta-
analysis by the Peto method, the DerSimonian-Laird method, and the restricted
maximum-likelihood method. The results were the same as those by the Mantel-
Haenszel method. The results with the four threshold values are summarized in Table 8.
As shown in Table 8, all the examinations indicated the same conclusion, that is, the
sites under positive selection tend to have low correlation coefficient between the
profiles.
-toxin 11(11) 18(18) 21(22) 25(26) 28(29) 33(34) 38(39) 40(41) 42(43) 61(62)
-toxin 15(20) 16(21) 26(31) 27(32)
Group I PLA2
3(30) 6(33) 7(34) 10(37) 15(43) 17(45) 18(46) 19(47) 22(50)30(58) 46(74) 52(80) 58(86) 59(87) 61(94) 64(97) 65(98) 66(99) 68(101) 70(103)
72(105) 73(106) 74(107) 75(110) 77(112) 81(116) 83(118) 84(119) 86(121) 88(123)
102(137) 108(143) 110(145) Group II
PLA2
18(33) 19(34) 20(35) 24(39) 31(46) 34(49) 36(51) 70(77) 77(84) 81(88) 110(117) 118(126) 119(127) 121(131) 122(132) 128(138) 129(139) HA 135(135) 138(138) 156(156) 159(159) 186(186) 193(193) 226(226)
MHC
9(9) 24(24) 63(63) 67(67) 69(69) 70(70) 71(71) 77(77) 80(80) 81(81) 82(82) 83(83) 95(95) 97(97) 114(114) 116(116) 151(151) 152(152) 156(156)
163(163) 167(167)
Table 5. Amino acid positions corresponding to positively selected sites.
aThe numbers outside the parentheses indicate the residue positions in the tertiary structure used in this study. The numbers in the parentheses indicate the alignment sites.
Sites with a correlation coefficient < 0.1 are indicated by bold font.
-toxin -toxin group I PLA2
group II PLA2
HA class I MHC p-value* 0.235 0.030 0.158 0.024 0.030 0.024
Table 6. The p-values estimated by the Wilcoxon rank sum test for the six protein families.
*The number indicates p-value corrected by BH method.
Table 7. Assessment of heterogeneity for the six protein families under positive selection by the Mantel-Haenszel method, the Peto method, the DerSimonian-Laird method and the Restricted maximum-likelihood method.
*: A symbol Q indicates Cochlan's Q, which was calculated by an R package, ‘metafor’
(Viechtbauer, W., 2010).
**: A symbol df indicates the degrees of freedom for each statistical evaluation.
***: I2 =100% × (Q − df)/Q. When I2 takes a negative value, the I2 is treated as zero in order for I2 to be restricted between 0% and 100% (Higgins et al., 2003.)
Mantel-Haenszel method
Q* df** I2 *** p-value
0.0 0.2723 5 0 0.9981
0.1 0.7753 5 0 0.9786
0.2 1.5500 5 0 0.9072
0.3 5.7373 5 13 0.3326
Peto method
Q* df** I2 *** p-value
0.0 0.3630 5 0 0.9963
0.1 1.0312 5 0 0.9600
0.2 1.7286 5 0 0.8853
0.3 6.6639 5 25 0.2469
DerSimonian-Laird method
Q* df** I2 *** p-value
0.0 0.2722 5 0 0.9981
0.1 0.7751 5 0 0.9786
0.2 1.5490 5 0 0.9073
0.3 5.6200 5 11 0.3450
Restricted maximum-likelihood method
Q* df** I2 *** p-value
0.0 0.2722 5 0 0.9981
0.1 0.7751 5 0 0.9786
0.2 1.5490 5 0 0.9073
0.3 5.6200 5 11 0.3450
Table 8. The results of the meta-analyses for the six protein families under positive selection by the DerSimonian-Laird method, the Restricted
maximum-likelihood method, the Peto method and the Mantel-Haenszel method.
4. Discussion
As described in the introduction, each site in a protein is subject to a mixture
of several constraints. When we use profile comparison, we can distinguish structural
constraint and the remaining ones in the mixture of constraints. The remaining
constraints are considered to be related to the biochemical functions at each site such as Mantel-Haenszel method
logarithm of the pooled odds ratio confidence interval p-value
0.0 1.25 0.72-1.78 <.0001
0.1 1.01 0.53-1.49 <.0001
0.2 1.00 0.54-1.47 <.0001
0.3 0.97 0.49-1.44 <.0001
Peto method
logarithm of the pooled odds ratio confidence interval p-value
0.0 1.55 0.92-2.17 <.0001
0.1 1.15 0.62-1.68 <.0001
0.2 1.06 0.58-1.54 <.0001
0.3 0.94 0.49-1.39 <.0001
DerSimonian-Laird method
logarithm of the pooled odds ratio confidence interval p-value
0.0 1.25 0.72-1.78 <.0001
0.1 1.01 0.54-1.49 <.0001
0.2 1.00 0.53-1.46 <.0001
0.3 0.91 0.381.45 0.0009
Restricted maximum-likelihood method
logarithm of the pooled odds ratio confidence interval p-value
0.0 1.25 0.72-1.78 <.0001
0.1 1.01 0.53-1.49 <.0001
0.2 1.00 0.53-1.46 <.0001
0.3 0.91 0.38-1.45 0.0008
therefore referred to as functional constraints. The relative intensities of the structural
constraints and the functional constraints differ from site to site. The active sites
registered in CSA did not always have low correlation coefficient. In such sites, the
structural constraint may be consistent with the functional constraint. Despite the
inconsistency among the sites, the integrated analysis by the meta-analysis suggested
that the active sites tend to have low correlation coefficients. Likewise, the correlation
coefficients of some positively selected sites did not fall into the tail region. For some
sites, the acceleration of amino acid substitutions along the structural constraints may be
enough for the positive selection. For example, the substitution of an amino acid residue
to a physicochemically similar residue at the antigenicity determining site may be
effective to escape from the recognition by antibody. However, the meta-analyses
suggested that the correlation coefficients for the positively selected sites tend to have
lower values than those for the non-positively selected sites. In other words, the
acceleration of the amino acid substitutions at the positively selected sites tends to occur
in a manner that is subject to the functional constraints.
The positively selected sites, which are listed in Table 5, are mapped on the
tertiary structures of -toxin,-toxin, Group I PLA2, Group II PLA2, HA and MHC (see
Figure 6). In the figures, the positively selected residues with the correlation
coefficients between two profiles < 0.1 are colored red. The residues colored red are
basically concentrated at the same face, in any case except for the analysis with -toxin
(see Figure 6). As for the -toxin, four residues corresponding to the residue positions
11, 18, 38 and 40 of PDB ID:2ASC are colored red (see Figure 6 (A)). Out of them,
residues at the positions 11, 18 and 40, have been reported to affect the toxin activity
(Gordon et.al. 2007, Weinberger et al. 2010.). Furthermore, it is reported that the
residue position 40 is involved in the toxin selectivity as well as toxin activity
(Weinberger et al. 2010). Only two residues corresponding to the residue positions 15
and 16 of PDB ID:2I61 were detected for the -toxin by my analysis. The residues are
also colored red in Figure 6 (B). The residues have been reported to be important for
both toxin activity and selectivity to the insect voltage-gated sodium channel (Karbat et
al., 2007; Tian et al., 2008.). Most of the residues colored red are located around the
active sites (blue sites) for either Groups I or II PLA2 (See Figure 6 (C) and (D)). Both
groups of enzymes are used as toxins by the snakes. It is suggested that the positive
selection is considered to be related to the adaptation to the change of the prey in the
different habitats (Lynch, 2007). In addition, some of the residues detected from Group
II PLA2 are also present near or at the C-terminal region (see Figure 6 (D)). The C-
terminal region, which corresponds to the residue positions 115-133 of PDB ID:1OZ6,
have been reported to be involved in the toxin action (Prijatelj et al., 2000; Ivanovski et
al., 2000; Fujisawa et al., 2008). Three residues of HA are colored red (see Figure 6
(E)). Out of them, two residues corresponding to the residue positions 156 and 159 of
PDB ID:2VIU are present in the antigenic region B1. The region, which consists of the
residue positions 150-170 of PDB ID:2VIU, have been reported to play an important
role for evacuating antibody’s attack (Sato et al., 2004). The most of the residues
colored red of MHC are located at or around the ligand binding sites in the tertiary
structure (see Figure 6 (F)). Thus, the individual exploration about the positively
selected residues with the correlation coefficient < 0.1 suggested that the substitutions
under the constraint different from structural one are effective for such adaptation or
selectivity.
As described above, the sites under positive selection do not always have the
low correlation coefficient between profiles. Therefore, it would be difficult to apply
this tendency to the prediction of positively selected sites. Rather, my method seems to
connect the two schools for the detection of positive selection. Several different
methods are available to detect positive selection at a single amino acid site in proteins.
Roughly speaking, the methods are classified into two approaches. One of the methods
uses the ratio of non-synonymous to synonymous substitution rates or estimate the
ratio as an indicator of positive selection, and has been developed by introducing
statistical approaches (Fitch et al., 1997; Nielsen and Yang, 1998; Suzuki and Gojobori,
1999; Yang et al., 2000; Kosakovsky Pond and Frost, 2005; Massingham and Goldman,
2005). The PAML program package (Yang, 2007) used in this study is a representative
tool for the identification of codons under positive selection. In contrast, there are
different approaches in which the ratio of the radical to conservative amino acid
substitution rates is used as a measure for positive selection (Hughes et al., 1990; Rand
et al., 2000; Zhang, 2000; Suzuki, 2007). Dagan et al. (2002) suggested that the ratio of
radical to conservative substitutions may not be a good indicator of positive selection,
since the ratio is affected by the transition-transversion rate ratio and the amino acid
compositions. In addition, the radical and conservative substitutions are defined based
on the physicochemical characteristics of the amino acid residues in the approaches.
However, the structural aspects have been neglected in these studies. Even the
substitutions of amino acids belonging to the same physicochemical group may be
radical, and the substitutions between amino acids in different physicochemical groups
may be conservative, depending on the structural context. In this study, I examined the
amino acid replacements under positive selection indicated by the ratio, in which
neither radical-conservative substitutions nor structural-functional constraints are taken
into account. In spite of the exclusion of such aspects, the profile comparison study
suggested that the amino acid substitutions under positive selection may have occurred
in a manner that the substitution pattern deviates from structural constraints. If the
amino acid substitutions according to the structural constraints at a site are regarded as
conservative, and those that deviates from structural constraints as radical, then my
study can be considered as an attempt to connect the approaches with the ratio to
those with the radical-conservative ratio. The key is the introduction of the structural
information. Recently, Suzuki (2013) extended his work by using structural
information, in which the thermodynamic stability obtained by an in silico method is
used, instead of the physicochemical group. Considering the accumulation of the
coordinate data of proteins, the use of structural information will shed light on studies of
positive selection.
Figure 6. Mapping of the amino acid residues corresponding to positively
selected sites.
The positively selected sites are mapped on the tertiary structures of -toxin (A), -
toxin (B), Group I PLA2 (C), Group II PLA2 (D), HA (E) and MHC (F). The residues
corresponding to positively selected sites with a correlation coefficient < 0.1 are colored
red, whereas the residues corresponding to the positively selected sites with a
correlation coefficient > 0.1 are colored yellow. The residues colored blue indicate the
catalytic sites for Group I and II PLA2. The ligands of MHC are represented as green
sticks. Two structures are shown in each row. They are the illustrations of the same
structure. The structure at the left side is arranged to exhibit the residues colored red as
many as possible, which is rotated around the Z-axis running from the bottom of the
page to the top by approximately 180 degrees to be shown at the right side.
Finally, I’d like to conclude this manuscript by describing a possible extension of my
profile comparison as future works. Recently, several groups including us have
investigated positive selection from structural viewpoint, although the number of such
studies is still small. For example, Meyer et al. (2013) and Echave et al. (2016)
described a possibility that even positively selected codon sites have dS/dN < 1.0 due to
structural constraints. It means ordinary approaches with ratio cannot be applicable to
the detection of such codon sites. Echave et al. (2016) insisted that a structural baseline
is required to detect such positively selected sites. If the substitution rate at a site is
greater than the base line, the site is regarded as a positively selected site, although there
is no concrete method to generate such base line at this stage. During the research
described in this manuscript, I found that some positively selected sites identified in this
study seem to be under the relatively strong structural constraint, since the correlation
coefficient of profile comparison at such sites were 0.5 or more. The observation is
inverse to the case suggested by Echave et al. (2016). That is, amino acid substitution
could be accelerated according to the structural constraints. There are two
interpretations for my observation. Consider antigenicity determinants of an antigen for
the first interpretation. If the object of the amino acid substitution is to avoid the
detection by the host antibodies, the replacement according to the structural constraint
would be enough for the survival of the pathogens. The second interpretation may be
related to a report by Dasmeh et al. (2014), in which the relationship between the
protein stability and the dN/dS ratio is examined with the simulated evolution of
myoglobulin in silico. In their simulation, they observed that positive selection would
occur to maintain the structural stability under the condition of the low structural
stability. The positively selected sites with high correlation coefficients detected in this
study may contribute to the structural stability as suggested by Dasmeh et al. (2014).
The profile comparison could be used to further investigate the mechanism of the
positive selection with high correlation coefficients between the profiles. The study of
positive selection from structural viewpoint has been just begun. The introduction of
structural information would shed light on the study of positive selection and other
topics of molecular evolution.
Acknowledgments
I would like to show my greatest appreciation to my supervisor, Professor
Hiroyuki Toh for providing me the opportunity to conduct this research and guidance
from the beginning to the completion of this research. My heartfelt appreciation goes to
Professor Motonori Ota for giving me a program to calculate the 3D profile of this study
and useful advice. I owe my deepest gratitude to Professor Daisuke Kohda for advising
me as a chief investigator and giving me the opportunity to conduct this research from
April 1 to September 30, 2011 in his laboratory. I am very grateful to everyone