Thermal Conductivity of Synthetic Rubber
* * **
Sadahisa Imura , Eisyun Takegoshi and Takao Nagamoto
* Dept. of Mech. Engg., Toyama University, Nakagawa-sono 1 - 1 , Takaoka, Toyama
* * Dept. of Mech. Engg., Ishikawa Technical College,
Kitacyujyo, Tzubata, Isikawa
The thermal conductivity of synthetic rubber, where the amount of compounding ingredients is changed, is obtained by the comparative method with a steady heat flow.
The thermal conductivity increases with the increase 'Clf the amount of vulcanizing agent, reinforcing agent and other agents, and slightly decreases with temperature rise when the amount of the compounding ingredients in the synthetic rubber is not large.
Generally, since the reinforcing agent like carbon black etc. is considered to exist as discontinuous phase in the continuous phase of pure rubber, the thermal conductivity of the synthetic rubber can be calculated by Eq. ( 1) which shows the thermal conductivity for the mixtures of heterogeneous materials.
I. Introduction
Synthetic rubber is used in large numbers in the industries, and its physical proper
ties have been investigated closely. However, in these properties, it is considered that the effect of compounding ingredients on the thermal conductivity of the synthetic rubber has not been satisfactory determined. In practical use, the thermal conductivity of the synthetic rubber comes into a considerable important problem because that the internal heat generation according to high speed revolution for the tire of motor car and vi bra
tion for the rubber isolator attached to machines, and etc. are discussed. From this, it is desired generally that the thermal ccnductivity of the synthetic rubber is good m
the many cases.
In this paper, the effects of carbon black, vulcanizing agent, reinforcing agents, fillers and etc. on the thermal conductivity of the synthetic rubber will be discussed on the basis of the experimental results.
2. Experimental Apparatus and Method
The thermal conductivity of the synthetic rubber was measured by the comparative
-28 -
Bulletin of Faculty of Engineering Toyama University 1979
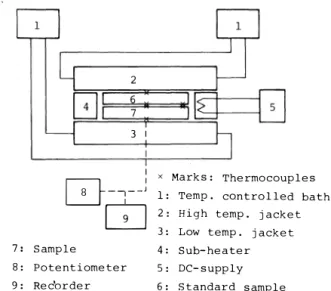
method with a steady heat flow. Figure 1 shows an outline of the experimental apparat us.
A square shaped experimental sample and standard sample are placed together, these are enclosed by two water jackets, and silicon grease is applied to hold in close contact between them ... In or
der to prevent heat loss from the edges, the circumference of the samples is surrounded by sub-heater. For the stan
dard sample, a Teflon plate of 50 X 50 mm size and 5 mm thickness with a known thermal conductivity (the thermal conductivity A. =0. 160
+ 0.0002 t kcal/mhoC, where t is average temperature) IS
used.
3 I
I X Marks: Thermocouples
0-�--� 1: Temp. controlled bath
Q 2: High temp. jacket 3 : Low temp. jacket 7: Sample 4 : Sub-heater
8: Potentiometer 5: DC- supply 9: Rec'order 6: Standard sample
Fig. 1. An outline of experimental apparatus
C-C thermocouples with a diameter of 0.08 mm are used for temperature measur
ing, each one of which is attached to front and back surfaces near the centeF-- of the standard sample and the experimental sample, and each two of them are attached at the edges, respectively. The voltage of the thermocouples is measured to an accuracy of 0.01 oC with a potentiometer.
For the experiments, when constant temperature waters with temperature control to within ±0.02 oC are circulated through the high and low temperature jackets, the tem
perature difference between both jackets is held to about 15 OC, and the apparatus is allowed to attain a steady state by a recorder, the temperature gradients for the experi
mental sample and the standard sample are measured.
In addition, for investigation of the experimental accuracy for present apparatus, the comparison of thermal conductivity is carried out for two samples of the same material and same shape, which are placed together, and experimental error within 2 % was confirmed when the sub-heater was used properly.
3. Experimental Samples
The samples for the synthetic rubber of the present experiments are shown from No. 1 to No. 11 in Tables 1 - 3, in which the weight parts of the compounding ingre
dients against 100 parts of pure rubber are shown. Table 1 shows four samples of Butadiene rubber ( BR) in which the amount of sulfur is changed, and Table 2 shows three samples of Acrylonitrile-Butadiene rubber ( NBR) in which the amount of carbon
-29-
black is changed. Table 3 shows four samples consisting of Isoprene rubber (IR) as main body, in which the type and the amount of the compounding ingredients are changed.
Table 1. The weight parts of compounding ingredients against 100 parts of pure rubber for Butadiene rubber.
Table 2. The weight parts of compounding ingredients against 100 parts of pure rubber for Acrylonitrile-Butadiene rubber.
No. 1 2 3 4 No. 5 6
f----·
BR 100 100 100 100 NBR 100 100
ZnO 5 5 5 5 ZnO 5 5
St. acid 1.5 1.5 1.5 1.5 St. acid 1 1
HAF 40 I 40 40 40 Ace. DM 1 1
Ace. CZ 0.8 1 0.8 0.8 0.8
Sui fur 1.0 1. 5 2.0 2.5
Ace. D 1 1
Sulfur 1.5 1.5
FEF 20 40
Vulcanization. 160 'C, 20 min
Vulcanization. 155 'C, 20 min
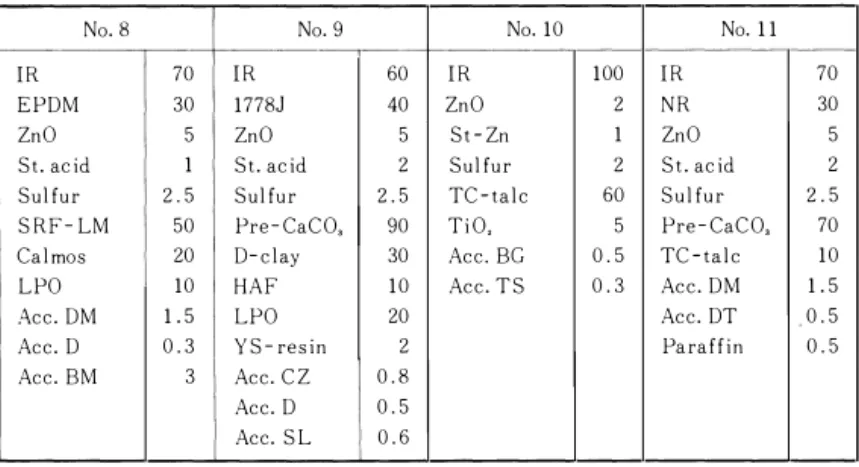
Table 3. The weight parts of compounding ingredients against 100 parts of pure rubber for practical Isoprene rubber.
No. 8
-·-·-· r---
IR 70
EPDM 30
ZnO 5
St. acid 1
Sui fur 2.5
SRF-LM 50
Calmos 20
LPO 10
Ace. DM 1.5
Ace. D 0.3
Ace. BM 3
No.9
-·-··---·-- ·-
IR 60
1778J 40
ZnO 5
St. acid 2
Sulfur 2.5
Pre-CaCO, 90
D-elay 30
HAF 10
I LPO YS-resin Ace. CZ I 0.8 20 2
I Ace. D Ace. SL I 0.5 0.6
No. 10 No. 11
t-----
IR 100 IR 70
ZnO 2 NR 30
St-Zn 1 ZnO 5
Sulfur 2 St. acid 2
TC-talc 60 Sulfur 2.5
TiO, 5 Pre-CaCO, 70
Ace. BG 0.5 TC-talc 10
Ace. TS 0.3 Ace. DM 1. 5 Ace. DT 0.5 Paraffin 0.5
7
100 5 1 1 1 1.5 60
In these tables, the sulfur is vulcanizing agent, HAF, · FEF and SRF-LM are the type of carbon black which serves as reinforcing agent, and D-elay, Calmos, TC-talc, Pre-CaCO, serve as extending agent and filler. Ace. -CZ, BM, SL, BG, etc. are the type of vulcanizing accelerator agent, ZnO, St-Zn, stearic acid are activator, and lubri- cant (LPO), coloring agent (TiO,), etc. are contained. In Table 3, EPDM, 1778J and NR are Ethylene-Propylene rubber,
respectively.
Styrene-Butadiene rubber and natural rubber,
In the experiments, the samples of 50 X 50 mm m size and 3 - 5 mm m thickness were used.
4. Results and Considerations
Figure 2 shows the relation between the thermal conductivity at 25 'C and the amo
unt of sulfur for Butadiene rubber. The thermal conductivities increase linearly as shown by a straight line in the figure as the amount of sulfur is increased. In general,
-30-
Bulletin of Faculty of Engineering Toyama University 1979
it 1s known that the thermal conductivity
polymeric
for amorphous materials has a tendency to increase in the temperature above the glass transition temperature Tg as the crosslinking density of molecules is increased, and that there is a linear rela
tion between the thermal con
ductivity and the crosslink ing densit/. The Butadiene rubber for the present experiments 1s also an amorphous poly
meric material, and its glass
0.26
0 u .c s
" 0.25 ...
nl () .I<:
.-<
0.24
0.23
0� 1�
�
0�0
�
Butadiene
I
1.0 1.5 2.0
rubber
I
2. 5 3. 0 Sulfur
Fig. 2. Relation between the thermal conductivity and the weight parts of sulfur against 100 parts of pure rubber.
transition temperature 1s about -70 'C. As sulfur which is a vulcanizing agent increases the crosslinking density in Butadiene rubber, it is seen that the tendency of the increase for the thermal conductivity m Fig. 2 coincides with the above fact.
Figure 3 shows the relation bet
ween the thermal conductivity at 25 'C and the amount of carbon black for Acrylonitrile-Butadiene rubber.
The thermal conductivities have a tendency to increase with increasing amount of carbon black. Usually, the pure rubber and the
rubber materials do combine, and the considered to exist
carbon black in not chemically carbon black 1s as discontinuous phase in the continuous phase of the pure rubber.
The carbon black is the greater part of spheres with 40 - 80 m,u in size, and its micro-structure is con- sidered to be amorphous . It is known zl
that the thermal conductivity of amor�
0.35
u 0
.<::
" E ... 0.30
nl () .I<:
"'
0. 25
0.20
/
0 f/ v / /
/<//1
,.0 Cal. value
/ [ I
// I I
/f Acrylonitrile- Butadiene rubber
I I 20 40 60
Carbon black
80
Fig. 3. Relation between the thermal con-
:1)
ductivity and the weight parts of carbon black against 100 parts of pure rubber.
phous carbon is about 1. 7 kcal/mh 'C at 20 'C and increases with the increase of the temperature. On the other hand, the thermal conductivity of the pure rubber for NBR can be estimated as 0.2 kcal/mh 'C from the extrapolation of the experimental values
m Fig. 3.
In general, for the thermal conductivity of heterogeneous mixtures, the following equatiort1 has been known to be applicable
-3 1 -
A. = A.,[A., + A., (n - 1 ) A., - (n - 1 ) V, (A., - A., )J
+ (n - 1 ) A., + V, (A., - A., ) (1)
where, A., and A., are the thermal conductivity of the continuous and discontinuous phases, respectively, V, is the volume ratio for the discontinuous phase, and n is 3 when the discontinuous phase consists of sphere particles. The thermal conductivities of NBR calculated by Eq. ( 1) are shown by a broken line in Fig. 3 . The experimental and calculated values almost agree within the error of several percent. Therefore, Eq. ( 1) may be applied to such case that the rubber is considered to be the mixtures of pure rubber and carbon black.
In Fig. 4, the temperature dependence of the thermal con
ductivities for NBR samples is shown. The thermal conductivi
ties as approximated by the straight lines in the figure have a tendency to decrease slightly with the temperature rise. For the amorphous polymeric mate
rials, it is known that in the lower temperature than the glass transition temperature Tg the molecular chains are con- gealed and the thermal motion of molecules is limited, but that the thermal motion beco
mes active with temperature rise. From this, the thermal
0. 3 5
u
0 ..c:
"' '-. ... 0. 3 0
rO () ..'<
'""
0.25
0.20
No.7 -o-0-o-o-o-;O-o-
• No.6
- -·-·-·-·-·-·-
-<D-<D_<D l<D-<D No.5
l<D-m-
3 0 50 70
Temperature °C 90
Fig. 4 . Temperature dependence of the thermal conductivity for Acrylonitrile-Butadiene rubber.
conductivity in the temperature under the glass transition temperature increases with temperature rise51•
In the higher temperature than Tg, the constraining force and the combining force of molecules decrease with temperature rise, so that the heat flow through the mole
cules will decrease and the thermal conductivity also decreases. Therefore, the ther
mal conductivity for pure rubber of NBR is considered to decrease with temperature rise. On the contrary, as the thermal conductivity of carbon black increases with tem
perature rise, the decrease rate for the thermal conductivity of NBR is considered to decrease gradually with increasing carbon black, as shown by the straight lines in Fig.
4.
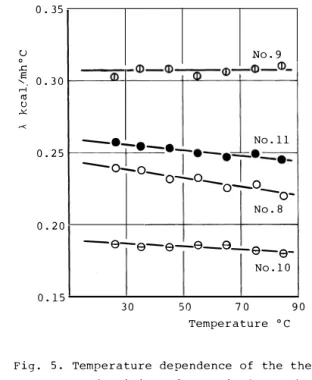
Figure 5 shows the temperature dependence of the thermal conductivities for the practical rubber in Table 3. These rubbers contain the fillers like D-elay, Calmos, TC
talc and Pre-CaCO,. In general, it is considered that the fillers do not chemically combine with the pure rubber in the same as carbon black21• The sum of the weight percentage for the carbon black and fillers are 41 %, 57 %, 35 ro and 42 % to the
-32-
Bulletin of Faculty of Engineering Toyama University 1979
samples of No. 8 - No. 11, respec
tively. When the weight percentages are converted into the volume per
centages, they become about 20 %, 27 %, 13 % and 21 %, respectively.
In Fig. 5, a tendency that the ther
mal conductivities increase with increasing volume percentage of the carbon black and fillers is shown.
The sample of No. 8 contains Calmos as fillers in addition to car
bon black. Calmos is a commercial name of the type of precipitated calcium carbonate and its thermal conductivity is about 1. 9 kcal/mh oC at 20 oC 31• Therefore, it is consi...:
dered that Calmos has nearly same effect as carbon black to the ther-
0.35
u 0
� � 0.3 0 .-i m ..><: 0
r<
0.25
0.20
0.15
No.9 m �--�--m--�--�--�-
-•-•-• No. ll
l ,.-.--.';;;;;.·�
-o-o_ o-o- 1 0
o--o-
No.8
---9--9--9--9--9 __ 9 __ 9_
I No.lO
30 50 70 90
Temperature °C
Fig. 5 . Temperature dependence of the thermal conductivity of practical Isopiene
mal conductivity of the rubber. rubber.
In the sample of No. 9, Pre-
CaCO, is also the type of precipitated calcium carbonate and is considered to have the almost same effect as Calmos to the thermal conductivity. D-elay consists of the aluminum silicate as the main body and its thermal conductivity is 6.0 kcal/mh°C61• In the sample of No. 9, the volume percentage of D-elay is about 5. 6 % and the volume percentage of the sum of Pre-CaCO, and carbon black is about 21.4 %. The sum of those is about 27 % and is largest in IR samples. Therefore, the thermal conductivity of this sample shows the largest value in IR samples.
The sample of No. 10 is called white rubber and contains TC-talc as reinforcing agent in place of the carbon black. TC-talc consisting of magnesium silicate as the main body has the thermal conductivity of about 5 . 2 kcal/mh oC 61 • Its influence to the thermal conductivity of the synthetic rubber is considered to be fairly larger than that of the carbon black. However, as the volume percentage of TC-talc is about 13 % and is smallest in IR samples, the thermal conductivity of this sample will show the sma
llest value.
The sample of No. 11 is called brown rubber and contains Pre-CaCO, and TC-talc as reinforcing agent. The sum of their volume percentage is nearly same rate as the sample of No. 8. However, the thermal conductivity of TC-talc is larger than that of the carbon black, so that the thermal conductivity of this sample will be larger than that of the sample of No. 8.
-33 -
5. Conclusions
Experiments were done for the thermal conductivity of synthetic rubber, and the following results were obtained.
( 1) The thermal conductivity of synthetic rubber increases slightly with increasing amount of vulcanizing agent.
( 2) The thermal conductivity of synthetic rubber increases with increasing amount of carbon black, and the good agreement between the experimental values and calculated values by Eq. ( 1) is obtained.
( 3) In practical rubber, the thermal conductivity has � · tendency to increase with the increase of the volume percentage of reinforcing agents and fillers.
( 4) The thermal conductivity of sy.nthetic rubber decreases slightly with tempera
ture rise.
Acknowledgment
The authors thank Mr. Iwao W ada of Nippon Zeon Company for his help with the manufacture of the samples etc ..
Literature Cited
1 ) T. Ozawa and K. Kanari, Japan Soc. App. Phys., 40-8 (1971) , 824.
2 ) The Society of Rubber Industry of Japan, A Technique Primer of New Rubber, (1971) .
3 ) K. Siba, The Table of Physical Constant, (1948) , Iwanami.
4 ) R. L. Hamilton and 0. K. Crosser, I & EC Fundamentals, 1-3 ( 1962) , 187 ..
5 ) K. Veberreiter and S. Purucker, Kolloid-Z., 144 (1955) , 120.
6 ) Y. S. Touloukian, R. W. Powell, C. Y. Ho and P. G. Klemens, The TPRC Data Series, Vol. 2 (1970) , IFI/Plenum.
The main part of this paper is expressed to preprint of Japan Soc. Mech. Engrs.
(No. 767-1) , at Toyama, September 1976.
(Received. October 31. 1978)
-3 4-