An eye-tracking study of integrative spatial cognition
over diagrammatic representations
Atsushi Shimojima1and Yasuhiro Katagiri2
1 Doshisha University, 1-3 Tatara-Miyakodani, Kyotanabe, Kyoto, Japan 2 Future University Hakodate, 116-2 Kamedanakano, Hakodate, Hokkaido, Japan
Abstract. Spatial representations, such as maps, charts, and graphs, convey dif-ferent levels of information, depending on how their elements are grouped into different units of objects. Therefore, how people set boundaries to graphical ob-jects to be interpreted and how they maintain the object boundaries during the given task are two important problems in understanding the way people utilize spatial representations for problem-solving. Table comprehension process was experimentally investigated in terms of eye gaze control behaviors when people were required to read off information distributed over large-scale objects, e.g., a row or a column, of the given table. Evidence was found that a large-scale object can be bounded by a single attentional shift to it, and that they can be retained as coherent objects for subsequent reference. These findings suggest the existence of a higher-order information processing in the comprehension of a spatial repre-sentation, based on rather intricate processes of attention management.
Key words: spatial representation, object-based attention, visual index, eye-tracking, embodied cognition
1
Introduction
Reasoning over external spatial representations, such as maps, graphs and charts, plays a significant role in human spatial cognition. One of the strong characteristics of human higher cognition lies in its capacity in the application of spatial representations that is extended to operate in non-spatial domains.
This aspect of human cognition, the acquisition and the utilization of knowledge in abstract spatial environments, has mostly been studied in the area of diagrammatic reasoning. Even though actual human problem solving with diagrammatic representa-tions involves intricate coordination of both acquisition and utilization aspects of spatial information, emphasis has been placed mostly on the utilization aspect. Extensive stud-ies have been devoted to the understanding of the semantic matching between spatial representations and non-spatial represented domains [2, 30], how spatial constraints are effectively utilized in reasoning about non-spatial facts [25], and the characterization and development of human spatial skills [9]. In these studies, it has tacitly been as-sumed that all the relevant internal spatial information is acquired from the external spatial representations before cognitive reasoning processes take place.
In contrast to this static and detached picture in diagrammatic reasoning of acqui-sition and utilization of spatial information, studies in spatial cognition in real spatial
environments, either in human way-finding or in robot navigation, emphasizes more active and interactive nature of underlying cognitive processes. Cognitive agents are embedded in spatial environments, and the acquisition and the utilization of spatial in-formation is tightly intertwined. Computational models have been developed to describe and simulate cognitive processes that try to capture this situated and embodied nature of human spatial cognition [31].
We attempt, in this paper, to combine these two research traditions, and to establish more situated and embodied pictures of cognitive processes in human problem solving with spatial representations. Our approach is defined by two leading questions and two corresponding hypotheses, so we will begin with formulating them in detail (section 2). We will then describe an eye-tracking experiment on people engaged in table-reading tasks (sections 3 and 4). The tasks are designed so that the levels of information to be extracted from the given spatial representation may be apparent. The eye-tracking data offer an integrative view of the use of spatial representation, where attentional mechanism affects higher-level cognitive processes in cognitive process in a profound manner (section 5).
2
Problem
Researchers and designers have noted that information graphics can express “higher-level” information as well as “lower-“higher-level” information [3, 4, 32, 10]. The former roughly indicates more abstract information carried by overall patterns formed by multiple graphical elements, while the latter more concrete information carried by individual graphical elements.
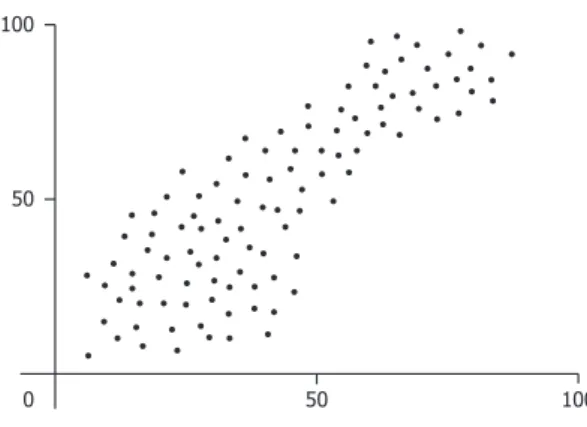
For example, the location of individual dots in Figure 1 indicate the existence of individual data points with specific values. In addition to this lower-level information, the scatter plot expresses higher level-information by “the shape and the density of the cloud” formed by these dots [12]. While the lower-level information is concerned with the values taken by individual cases in the data, the higher-level information is concerned with the overall distribution of the data, such as the strength of correlation between the two variables.
The distinction of higher-level and lower-level information is quite general over different kinds of spatial representations. Just as clouds of dots in a scatter plot can have informative shapes, line segments in a line graph can form an informative slope or curve by connecting individual points on a plane that carry lower-level information. Likewise, when the bars in a bar chart has the shape of “descending staircase” [18], this can mean that the price of a product steadily declined during the period.
Data maps have been also cited as carriers of multiple-level information. For exam-ple, Lowe [15] discussed “secondary structure”, where adjacent isobars on a meteoro-logical map together indicate a global trend of the area’s barometric situation. Gilhooly et al. [8] found the use of “specialist schemata” in geographers’ reading of contour maps, where visual patterns formed by several contour lines indicate some global struc-tures in the area, such as valleys and interlocking spurs. Ratwani et al. [21] distinguished “specific information” and “integrating information” that can be extracted from
choro-Fig. 1.A typical scatter plot
pleth graphs, the kind of data maps using color and shading of regions to represent magnitude.
Node-edge graphs and even tables support higher-level information. Olivier [17] discussed the case of tree diagrams, where an extended path formed by consecutive edges indicates the presence of a descent or chain in the represented relational struc-ture. In London’s tube map, the concentration of edges touching a node indicates the presence of a “hub” station [26]. Many tables are designed to allow the viewer to do “column-wise” or “row-wise” readings, in addition to basic “cell-wise” readings [26].
As the notion of “higher-level information” is applicable to such a wide variety of cases, one may suspect that it might be without content. Shimojima [26] investigated how certain spatial representations come to carry higher-level information, and identi-fied a general pattern in which additional semantic rules are logically derived from basic semantic conventions in a spatial representation system. Thus, the level difference of in-formation expressed by spatial representations is not just the matter of our subjective judgment, but susceptible to exact semantic characterization.
Nevertheless, whether a reader can appreciate different levels of information ex-pressed in the given spatial representation is the matter of exact cognitive operations involved in the comprehension process. Specifically, which level of information people extract should be profoundly affected by the following factors:
Question (1) how people set boundaries to graphical objects to be interpreted. Question (2) (when the reading task is complex enough) how they maintain object
boundaries during the task.
For example, in order to extract specific values of individual data points from a scatter plot in Figure 1, one need only interpret the locations of individual dots, whereas one need take the entire cloud of dots as a coherent object in order to evaluate the overall trend of the data. In addition, when the task is to compare the strength of correlation in two data sets (say, the data in the x-range 0–50 and those in the x-range 50–100 in Figure 1), one need somehow maintain the boundaries of more than one higher-level graphical objects.
The purpose of the research presented in this paper is to begin investigations into the above two questions, by examining the following two fundamental hypotheses:
Hypothesis (1) A large-scale object in a spatial representation can be bounded by a single shift of attention to it, not necessarily through the integration of smaller component objects separately attended to.
Hypothesis (2) Large-scale objects, once bounded, can be retained as coherent objects, and do not have to be reintegrated from component objects when they are accessed subsequently.
The first hypothesis is motivated by the idea of “bounded activation,” or “coloring,” proposed by Ullman [31]. Ullman developed a theory of “visual routines,” namely, se-quences of elemental operations applied to particular locations in the visual scene to analyze visual features and spatial relations holding there. Bounded activation is one of the postulated elemental operations, whose function is to define coherent units of regions in the unarticulated visual scene so that further operations can be applied selec-tively to the activated regions. Roelfsema and his colleagues made this idea more ex-act by proposing computational and neurological models of the operation [23, 22], and provided neuro-physiological evidence to its functioning in macaque monkey [24, 14]. “Object-based attention” actively investigated by Duncan [7], Kramer and Jacobson [13] and Driver and Baylis [6] largely overlaps with the operation of bounded activa-tion. Strong empirical evidence for the operation has been accumulated in this tradition too (e.g., O’Craven et al. [16]). Our hypothesis states that the operation of coloring, or object-based attention, can be applied to large-scale objects in spatial representation in order to extract task-relevant higher-level information from them.
The second hypothesis is motivated by the idea of “marking” proposed, again, by Ullman [31]. According to Ullman, some visual tasks require the application of ele-mental visual operations to multiple locations of the scene. Some tasks further require one to combine information obtained at different locations. The operation of marking is supposed to meet this demand by maintaining the record of the locations already visited and of summary information associated with these locations. Kahneman et al. [11] gen-eralized this concept into the concept of “object files,” by which we keep track of objects as coherent entities despite changes of their locations and visual features. Although it is still an open question how this operation is implemented computationally and neu-rologically, recent studies of visual indexing operations[19, 20, 1, 29] seem to provide good evidence for the existence of cognitive mechanism with the object-tracking func-tionality. Our second hypothesis states that large-scale objects can be tracked in this manner, with their locations and summary information retained in working memory for easy subsequent access.
3
Materials
As an initial test of these hypotheses, an eye-tracking study was conducted on a group of participants who were engaged in table comprehension tasks.
Fig. 2.A black-and-white table (left) and a T-and-F table (right) used as stimuli in the experiment.
3.1 Stimulus
The tables presented to participants were divided into two large groups. One group, called black-and-white tables, use black and white squares as their main symbols, whereas the other group, called T-and-F tables, use the roman letters “T” and “F” as their main symbols. Both kinds of tables express a membership relation from the people 1–5 to the organizations A–E. In a black-and-white table, the appearance of a black square means membership, whereas the appearance of a black square means non-membership. In a T-and-F table, the letter “T” indicates membership and the letter “F” indicates non-membership. Thus, the black-and-white table in Figure 2 lets us read off the information that person 3 is a member of organization C for example, whereas the T-and-F table in Figure 2 lets us read off the opposite information.
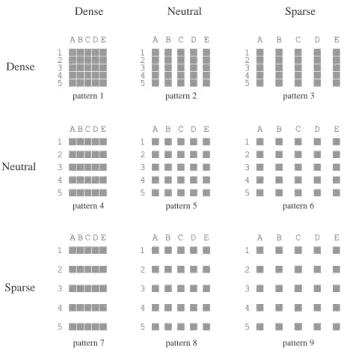
Each group of tables are further divided into 9 different kinds, depending on their horizontal and vertical spacing. Figure 3 shows the nine spacing patterns of our stimu-lus tables. “Neutral” spacing was approximately .7 deg viewing angle, while “sparse” spacing was twice as large (approximately 1.4 deg) and “dense” was one fifth as large (approximately .1 deg). Each symbol (square or letter) on a stimulus table was .6 deg wide and long, so the length of a column or row of a stimulus table was approximately 4.0 degrees under dense spacing, 6.3 degrees under neutral spacing, and 9.0 degrees under sparse spacing.
Stimulus tables of spacing type 2, 3, or 6 shown in table Figure 3have horizontal spacing larger than vertical spacing, making columns good perceptual groups. We say that such tables have column-wise grouping. Then, tables of spacing type 4, 7, or 8 are said to have row-wise grouping, and tables of spacing type 1, 5, or 9 are said to have
neutral grouping.
3.2 Task
On the basis of these tables, two kinds of reading tasks were imposed on the partici-pants. In the row-wise task, the participants were asked to read the given table to assess the number of people who belong to exactly two organizations. Suppose the black-and-white table in Figure 2 is shown with an instruction to solve this problem. How would one go about? Well, one should read the rows of the table one by one, making judg-ment whether it contains two black squares. Most probably, one would begin with the
pattern 9 pattern 8 pattern 7 pattern 6 pattern 5 pattern 4
pattern 1 pattern 2 pattern 3
Dense Dense Sparse Neutral Sparse Neutral
Fig. 3.Nine spacing patterns of the stimulus tables. Patterns 2, 3, and 6 have column-wise group-ing of symbols, while patterns 4, 7, and 8 have row-wise groupgroup-ing. Patterns 1, 5, and 9 have neutral grouping.
uppermost row representing person 1 and go down. If one goes right, one would reach the conclusion that there are four rows (representing persons 1 , 2, 3, and 4) containing exactly two black squares. One would then answer “four.”
Thus, the rows of the table are the primary objects to be scanned and interpreted in this task, and we express this fact by saying that this task has the horizontal axis. In terms of our hypotheses, rows are large-scale objects to be bounded in this task, and a judgment whether the row contains exactly two black squares is the task-relevant infor-mation to be attached to each row. We want to examine whether rows can be bounded by a single attention in this kind of tasks, and whether they can be stored as coherent objects for subsequent reference.
In contrast, the column-wise task asked the participants to assess the number of organizations to which exactly two people belong. Try to solve this problem on the basis of the black-and-white table in Figure 2. This time, the primary objects to be scanned and interpreted are columns of the table, and whether the column contains exactly two black squares is the task-relevant information to be attached to each column. Thus, this task is said to have the vertical axis. Well, there are four columns (representing organizations A, B, D, and E) containing exactly two black squares, and the correct answer is “four.” The reader should have reached the same conclusion by scanning columns of the table one by one, perhaps starting with the leftmost column.
3.3 Participants
A total of 46 students, 14 males and 32 females, participated in the experiment. Average age of participants were 20.4. There were 4 participants who failed to follow the instruc-tions and their data were excluded from the analysis of response time and accuracy. Due to a breakdown of the eye-tracking hardware, the eye movements of additional 10 par-ticipants were not reliably extracted, and their data were not included in the analysis of saccadic movements.
3.4 Procedure
Presentation steps A total of 36 different types of problems were prepared, varying in the task axis (vertical or horizontal), the table symbol (black-and-white or T-and-F), and the spacing of the table (see Figure 3). Each type of problems had 3 instances, totaling up to 108 problems to be presented to a participant. To ease the difficulty in distinguishing rather complex problem types, we presented problems in the sequence of 4 blocks, each consisting of the same type of problems defined by the task axis and the table symbol. The order of problems within a block was randomized.
After they were informed of the experiment and signed the consent form, partici-pants were instructed to sit in front of a 19-inch display where the stimulus tables were presented. Their foreheads and chins were pressed onto..., and the distance of eyes and the center of the display was approximately 50 cm. Task instruction was displayed in the beginning of each block of problems, followed by three exercise problems. Partic-ipants were asked to press, as quickly and as accurately as possible, a button with the number representing the answer they reached. They were instructed to press buttons without averting their eyes from the display.
Measurements Eye movement patterns of participants while they were reading tables were recorded with an eye tracker NAC EMR-AT VOXER, which has 60Hz temporal precision. Fixation were identified from eye samples with the centroid-based dispersion threshold method [5]. The threshold for maximum dispersion was set to 1.67 degrees in radius, while the threshold for minimum fixation duration was set to 100 millisec-onds. Saccades were then identified as connecting two fixations. This means that under dense spacing, only eye displacement traveling over more than one symbol counted as a saccade. Figure 4 shows this situation, where the large circle indicates the range of eye displacement, starting at the center of the top left symbol (the small circle), that did not count as saccades.
Percentage of correct answers and response times were recorded with SuperLab.
3.5 Predictions
Our first hypothesis states that large-scale objects in spatial representations can be bounded by a single attention. Driver and his colleagues conducted a series of ex-periments showing that object-based attention is directed to parts of the visual scene making good perceptual units defined by Gestalt principles (e.g., [6]). Thus, we expect
Fig. 4.Dispersion threshold for fixation identification, imposed over a stimulus table with dense dpacing. The large circle indicates the range of eye displacement, starting at the center of the top left symbol (the small circle), that counted as a movement within a fixation rather than as a saccade.
that the hypothesized bounding of a large-scale object would happen when it is a pri-mary object to be interpreted in the given task and it makes a good perceptual unit. In our experimental setting, columns in column-wise tables under column-wise tasks sat-isfy this condition. Rows in row-wise tables under row-wise tasks do so too. Thus, we predict that scanning eye movements along such columns or rows are minimal or even absent, since a single attention should be sufficient for setting their boundaries.
To operationalize the key concepts, a horizontal saccade is a saccade with a larger displacement in the horizontal direction than in the vertical direction. It is considered to be an eye movement along the rows of the table. A vertical saccade is a saccade with a larger displacement in the vertical direction than in the horizontal direction. It is considered to be an eye movement along the columns of the table. Then, a coaxial
saccade is a saccade moving along the axis of the given task. Thus, vertical saccades
occurring in a column-wise task and horizontal saccades occurring in a row-wise task are coaxial saccades in our sense. Our first prediction is then the following:
Prediction (1) Coaxial saccades are fewer when the table grouping matches with the task axis than when they mismatch, and the number of coaxial saccades in the matching condition approximates zero.
Our second hypothesis states that large-scale objects, once bounded, can be retained as coherent objects. This implies that large-scale objects can be revisited, when the need occurs to check the task-relevant information stored with it. Thus, backward saccades should occur from columns to columns in column-wise tasks, and from rows to rows in row-wise tasks. However, such backward saccades can occur only when columns or rows are retained as coherent objects. Thus, the frequency of backward saccades should depend on the table grouping. Specifically, if the table grouping matches with the task axis, and thus the columns or rows to be retained make good perceptual units, then they can be in fact retained as coherent objects and backward saccades can occur to them. In contrast, if the table grouping does not match the task axis, and thus the columns or rows to be retained fail to be good perceptual units, then some of the columns or rows are not retained as coherent objects in the first place, and the frequency of backward saccades will fall under such conditions.
What counts as a backward saccade depends on the axis of the task and the spacing of rows or columns in the given table. In the case of vertical tasks, a backward saccade
Table 1.Average number of coaxial saccades in column-wise tasks , relative to the table-symbol and the table-grouping.
column-wise (s.d.) neutral (s.d.) row-wise (s.d.) black-and-white 1.00 (0.60) 1.64 (0.95) 3.48 (2.36) T-and-F 5.01 (3.13) 9.49 (4.18) 15.68 (5.84)
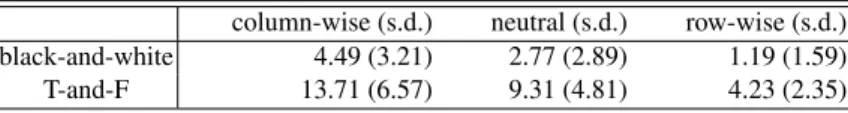
Table 2.Average number of coaxial saccades in row-wise tasks , relative to the table symbol and the table grouping.
column-wise (s.d.) neutral (s.d.) row-wise (s.d.) black-and-white 4.49 (3.21) 2.77 (2.89) 1.19 (1.59) T-and-F 13.71 (6.57) 9.31 (4.81) 4.23 (2.35)
is a leftward saccade whose horizontal displacement equals or exceeds the distance between the vertical axes of adjacent columns in the given table. Since our stimulus tables have different horizontal spacings between columns, the criterion of backward saccades depends on which spacing the given table has. Backward saccade in horizontal tasks are defined analogously, as upward saccades whose vertical displacement equals or exceeds the distance between the horizontal axes of adjacent rows in the given table. With this definition at hand, our second prediction can be stated in the following way: Prediction (2) Backward saccades will occur under all conditions, and their frequency
will be higher when the table grouping matches with the task axis than when they mismatch.
4
Results
4.1 Coaxial saccades
Table 1 shows the average number of coaxial saccades in column-wise tasks, relative to the table symbol and the table grouping. Table 2 does the same for coaxial saccades in row-wise tasks.
The main effect of the table grouping on the frequency of coaxial saccades was very strong both in column-wise tasks (F(2, 62) = 182.3, p < .0001) and in row-wise tasks (F(2, 62) = 128.6, p < .0001). Pairwise comparisons show that coaxial saccades in row-wise tasks were the least with row-wise tables, more with neutral tables, and the most with column-wise tables; the frequency of coaxial saccades in column-wise tasks had the opposite tendency. The main effect of the table symbol was also found, both for row-wise tasks (F(1, 31) = 65.0, p < .0001) and for column-wise tasks (F(1, 31) = 192.7, p < .0001). Strong interactions of the table symbol and the table grouping were also found for column-wise tasks (F(2, 62) = 125.0, p < .0001) and for row-wise tasks (F(2, 62) = 38.2, p < .0001).
Table 3.Average number of backward saccades in column-wise tasks, relative to the table symbol and the table grouping.
symbol column-wise (s.d.) neutral (s.d.) row-wise (s.d.) black-and-white 1.00 (0.37) 0.65 (0.39) 0.44 (0.22) T-and-F 0.81 (0.50) 0.50 (0.42) 0.41 (0.39)
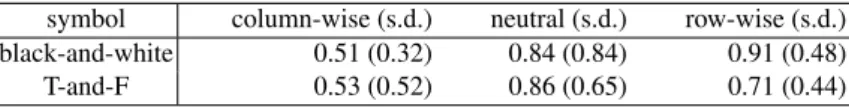
Table 4.Average number of backward saccades in row-wise tasks, relative to the table symbol and the table grouping.)
symbol column-wise (s.d.) neutral (s.d.) row-wise (s.d.) black-and-white 0.51 (0.32) 0.84 (0.84) 0.91 (0.48) T-and-F 0.53 (0.52) 0.86 (0.65) 0.71 (0.44)
4.2 Backward saccades
Table 3 shows the average number of backward saccades in column-wise tasks, relative to the table symbol and the table grouping. Table 4 does the same for backward saccades in row-wise tasks.
Strong main effect of the table grouping was found on the frequency of backward saccades both for column-wise tasks (F(2, 62) = 49.0, p < .0001) and for row-wise tasks (F(2, 62) = 10.3, p < .0001). Overall, more backward saccades were made when the table grouping matched with the task axis.
4.3 Response accuracy
Average percentages of correct answers are shown in Table 5, relativie to the task axis, the table symbol, and the table grouping.
A repeated-measure 2×2×3 analysis of variance was conducted. We found strong effect of the table symbol (F(1, 41) = 7.46, p < .01), with performance with black-and-white tables being higher than performance with T-and-F tables. The main effect of the table grouping was also significant (F(2, 82) = 3.72, p < .05), indicating lower performance with column-wise tables compared to that with the other types of tables. The table grouping interacted with the task axis (F(2, 82) = 4.41, p < .05), where Table 5.Average percentages of correct answers, relative to the task axis, the table symbol, and the table grouping.
symbol task axis column-wise (s.d.) neutral (s.d.) row-wise (s.d.) black-and-white column-wise 0.94 (0.10) 0.95 (0.07) 0.93 (0.08) row-wise 0.91 (0.12) 0.96 (0.09) 0.96 (0.08) T-and-F column-wise 0.91 (0.11) 0.92 (0.11) 0.90 (0.11) row-wise 0.88 (0.15) 0.89 (0.14) 0.93 (0.11)
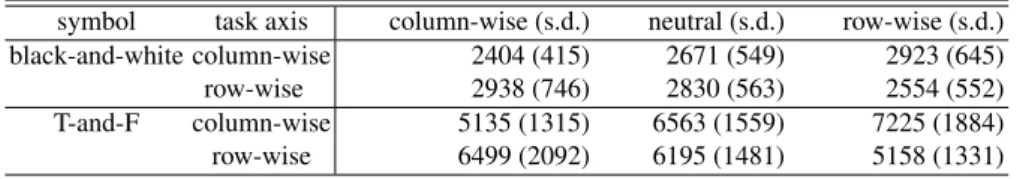
Table 6.Average response time (in milliseconds), relative to the task axis, the table symbol, and the table grouping.
symbol task axis column-wise (s.d.) neutral (s.d.) row-wise (s.d.) black-and-white column-wise 2404 (415) 2671 (549) 2923 (645)
row-wise 2938 (746) 2830 (563) 2554 (552)
T-and-F column-wise 5135 (1315) 6563 (1559) 7225 (1884) row-wise 6499 (2092) 6195 (1481) 5158 (1331)
performance was better when the table grouping matched with the task axis than when they mismatched.
4.4 Response time
The tendency of response time largely inherits that of response accuracy. Average re-sponse times are shown in Table 6, relative to the task axis, the table symbol, and the table grouping.
A repeated-measure 2×2×3 analysis of variance showed strong effect of the table symbol (F(1, 41) = 318.1, p < .001), where response time with black-and-white ta-bles was shorter than response time with T-and-F tata-bles. The main effect of the table grouping was also strong (F(2, 82) = 20.09, p < .001), indicating slower response with column-wise tables compared the other types of tables. The table grouping interacted with the task axis (F(2, 82) = 100.53, p < .001), where response time was shorter when the table grouping matched with the task axis than when they mismatched. We also found strong interaction of the table symbol and the task axis (F(1, 41) = 13, 07, p < .001), of the table symbol and the table grouping (F(2, 82) = 9.26, p < .001). The interaction of all the three factors was also significant (F(2, 82) = 49.51, p < .001).
5
Evidences for higher-order processing in the comprehension of
spatial representations
5.1 Attention to large-scale objects
We predicted that fewer coaxial saccades would be found when the grouping of the given table matches with the axis of the task than when they mismatch. This predic-tion was clearly supported by our data. As Tables 1 and 2 show, coaxial saccades in column-wise tasks were less frequent with column-wise tables than with row-wise bles, whereas coaxial saccades in row-wise tasks were less frequent with row-wise ta-bles than with column-wise tata-bles.
Particularly, the average numbers of coaxial saccades were very small with black-and-white tables under the matching condition. For column-wise tasks, the relevant number was 1.00, and for row-wise tasks, the number was 1.19. Considering each table had five columns to be scanned, this means that, on average, approximately 0.2 scanning saccades were made on each column or row. Thus, our data for black-and-white tables
(1) (2) (3) Fig. 5.Typical fixation patterns observed in the experiment.
confirm our prediction that the number of coaxial saccades in the matching condition would approximate zero.
Figure 5 (1) shows the typical fixation pattern on column-wise, black-and-white ta-bles during the column-wise task. The center of each circle indicates a fixation point, while its diameter indicates the fixation duration. Fairly long fixations were placed on individual columns, but eyes tended to leave a column after no or few vertical move-ments within the column. Rather, eyes moved from columns to columns consecutively, often placing only one fixation on each column.
By way of contrast, Figure 5 (2) shows the typical fixation pattern in the case where a column-wise task was performed using black-and-white, row-wise tables. We see more vertical saccades scanning columns of the table (3.48 on average). Figure 5 (3) shows the typical fixation pattern in the case where a column-wise task was performed using T-and-F, row-wise tables. Even more vertical saccades were observed in this case. (15.7 on average).
Thus, our data on coaxial saccades clearly support our hypothesis on the way columns or rows of symbols are bounded into coherent objects. For example, when column-wise tasks were performed with row-wise tables (Figures 5 (2) and (3)), initial attentions were oriented to consecutive sub-regions of a column, each consisting of one or a few symbols. Due to the task demand discussed in section 3, these initially attended sub-regions were then integrated into a column five figures, to which a task-relevant judg-ment was attached. Our data on coaxial saccades indicate that this type of subsequent integration took place generally under the mismatching conditions.
In contrast, when the table grouping matches with the task grouping, only one fixa-tion was placed on an entire row or column to be scanned (Figures 5 (1)). This suggests that attention placed on one part of a row or column spread over the entire row or column, integrating five figures into an object already at the time of initial attention. Subsequent integration was not necessary in such a case, and task-relavent judgment could be directly attached to the initially attended object. This could be enormous sim-plification of the relevant comprehension task, and explains shorter response time and higher response accuracy under the matching conditions compared to the mismatching conditions.
Fig. 6.Typical fixation patterns observed in the experiment.
5.2 Retainment of large-scale objects
Our second hypothesis states that large-scale objects, once bounded, can be retained as coherent objects. This implies that backward saccades to large-scale objects can occur selectively. Furthermore, as the retainment may not be possible when the target does not make a good perceptual unit, the frequency of backward saccades should depend on the matching of the table grouping with the task axis.
Our data on backward saccades confirm both predictions. Backward conditions did occur in all conditions, the average 0.41 times per trial (twice every five trials) in the least frequent condition. The frequency of a backward saccade was the average 1.00 times per trial even in the most frequent condition, and the variance was not large (s.d.= 0.37). This indicates that background saccades in our data were selective, in the sense that they were directed to specific columns or rows, rather than directed to all the columns or rows indiscriminately. Figure 6 shows the fixation pattern of one of the trials where a single backward saccade occurred to a particular column in the middle of the trial.
Also, our data show that such backward saccades were less frequent when the table grouping mismatched with the task axis, and thus when large-scale objects to returned to failed to make good perceptual units. This suggests that the targets of backward saccades were required to be coherent objects, which, in turn, implies that large-scale objects could be retained as coherent objects at least in some of the cases.
This sort of retainment processes is a realistic possibility given the visual index-ing mechanism investigated by Pylyshyn etc. Accordindex-ing to the visual indexindex-ing theory, we can assign “indices” to several objects or locations in the visual scene. With these indices, we can quickly return attention to the locations of indexed objects without searching for them. We hypothesize that such an index was attached to a row or column of symbols when it was first bounded. The index was then used for the quick return of attention when the maintenance need described above arose. Indeed, the use of eye movements for checking internally attached tags were found also by Shimojima and Katagiri [28, 27], and the present case is another instance of eye movements used in combination with visual indices. The present case is unique in that object groups, rather than individual objects or locations, were indexed and revisited for their tags.
5.3 Implications
Thus, the two hypotheses we proposed in section 2 received substantial support from our experiment. Large-scale objects in spatial representations can be bounded by a sin-gle attention and can be tagged with task-relavent information in a direct manner. These objects can be then retained as coherent objects, accepting returning saccades when the need occurs to check the attached information or to obtain other task-relevant informa-tion from it.
Thus, our data seem to point to the existence of a higher-order information pro-cessing based on rather intricate attentional management. In a higher-order propro-cessing mode, only large-scale objects (such as columns or raws of symbols) are treated as ob-jects, and only task-relevant information attached to them are processed. Smaller-scale objects (such as individual squares and letters) do not count as objects, and information about them are not processed unless special needs occur.
Equipped with the ability of direct tagging, this higher-order process seems to greatly facilitate the comprehension of the given spatial representation. Performance was consistently better, in both response time and response accuracy, when the table grouping matched the task axis. This condition coincided with the condition where coaxial saccades were fewer and backward saccades were more frequent. This coinci-dence strongly suggests that a higher-order processing is in fact functional, contributing to the observed improvement in response time and accuracy.
Yet, attentional management underlying this higher-order processing is rather intri-cate. We have already seen that the initial bounding of large-scale objects was influ-enced both by the spatial coherence of the target objects (matching and mismatching) and by the visual properties of the component symbols (black-and-white or T-and-F). We have already obtained the evidence that the spatial coherence of target objects also influenced subsequent retainment of the bounded objects. This appears to have a pro-found implication for table-design practices: subtle difference in the choice of symbols and their spatial arrangement can facilitate or inhibit the occurrence of a particular higher-order processing.
6
Conclusions
We argued that in order to fully understand how people utilize spatial representations for problem-solving, we should explicitly consider the issues of how people set the boundaries of graphical objects to be interpreted, and how the object boundaries are maintained during the task. Our experimental study with table-reading tasks supports the view that large-scale objects can be bounded by a single attention, and that they can be retained as coherent objects for subsequent reference. These findings in turn suggest the existence of a higher-order information processing in the comprehension of spatial representations, where large-scale objects and information attached to them are exclu-sively processed. Empirical evidence was also found that this higher-level processing heavily depends on intricate processes of attentional management, easily influenced by the spatial arrangement and the visual property of graphical elements.
Overall, the study suggests a fundamentally integrative view, where the structures of higher cognitive processes can change ad hoc, in response to how graphical elements
in the given spatial representation are managed in attentional process. Thus, subtle dif-ference in spatial arrangement and visual properties of graphical elements can make structural difference to higher cognitive processes. In this regard, problem solving with spatial representations seems to be a more plastic process, deeply situated in the external world.
References
1. D. H. Ballard, M. M. Hayhoe, P. K. Pook, and R. P. N. Rao. Deictic codes for the embodiment of cognition. Behavioral and Brain Sciences, 20(4):723–767, 2001.
2. J. Barwise and J. Etchemendy. Visual information and valid reasoning. In G. Allwein and J. Barwise, editors, Logical Reasoning with Diagrams, pages 3–25. Oxford University Press, Oxford, 1990.
3. J. Bertin. Semiology of Graphics: Diagrams, Networks, Maps. The University of Wisconsin Press, 1973.
4. J. Bertin. Graphics and Graphic Information. Walter de Gruyter, 1981. Originally published in France in 1977.
5. P. Blignaut. Fixation identification: The optimum threshold for a dispersion algorithm.
At-tention, Perception,& Psychophysics, 71(4):881–895, 2009.
6. J. Driver and G. C. Baylis. Attention and visual object segmentation. In J. Driver, G. C. Baylis, and R. Parasuraman, editors, The attentive brain, pages 299–325. The MIT Press, 1998.
7. J. Duncan. Selective attention and the organization of visual information. Journal of
Exper-imental Psychology: General, 113(4):501–517, 1984.
8. K. J. Gilhooly, M. Wood, P. R. Kinnear, and C. Green. Skill in map reading and memory for maps. Quarterly Journal of Experimental Psychology, 40A:87–107, 1988.
9. B. Grawemeyer and R. Cox. The effects of users’ background diagram knowledge and task characteristics upon information display selection. In Diagrammatic Representation and
Inference: Fifth International Conference, Diagrams 2008, pages 321–334, 2008.
10. J. T. Guthrie, S. Weber, and N. Kimmerly. Searching documents: Cognitive processes and deficits in understanding graphs, tables, and illustrations. Contemporary Educational
Psy-chology, 18:186–221, 1993.
11. D. Kahneman, A. Treisman, and B. J. Gibbs. The reviewing of object files: Object-speci?c integration of information. Cognitive Psychology, 24(2):175–219, 1992.
12. S. M. Kosslyn. Elements of Graph Design. W. H. Freeman and Company, 1994.
13. A. F. Kramer and A. Jacobson. Perceptual organization and focused attention: the role of objects and proximity in visual processing. Perception& Psychophysics, 50(3):267–284, 1991.
14. V. A. F. Lamme, V. Rodriguez-Rodriguez, and H. Spekreojse. Separate processing dynamics for texture elements, bundaries and surfaces in primary visual cortex of the macaque monkey.
Cerebral Cortex, 9:406–413, 1999.
15. R. K. Lowe. Diagram prediction and higher order structures in mental representation.
Re-search in Science Education, 24:208–216, 1994.
16. K. M. O’Craven, P. E. Downing, and N. K. Kanwisher. fMRI evidence for objects as the units of attentional selection. Nature, 401(584–587), 1999.
17. P. Olivier. Diagrammatic reasoning: an artificial intelligence perspective. In A. F. Blackwell, editor, Thinking with Diagrams, pages 63–78. Kluwer Academic Publishers, 2001.
18. S. Pinker. A theory of graph comprehension. In Aritificial Intelligence and the Future of
19. Z. Pylyshyn. The role of location indexes in spatial perception: A sketch of the finst spatial-index model. Cognition, 32:65–97, 1989.
20. Z. Pylyshyn. Seeing and Visualizing: It’s Not What You Think. The MIT Press, 2003. 21. R. M. Ratwani, J. G. Trafton, and D. A. Boehm-Davis. Thinking graphically: Connecting
vision and cognition during graph comprehension. Journal of Experimental Psychology:
Applied, 14(1):36–49, 2008.
22. P. R. Roelfsema. Cortical algorithms for perceptual grouping. Annual Review of
Neuro-science, 29:203–227, 2006.
23. P. R. Roelfsema, V. A. F. Lamme, and H. Spekreijse. The implementation of visual routines.
Vision Research, 40:1385–1411, 2000.
24. P. R. Roelfsema, V. A. F. Lamme, and H. Spekreojse. Object-based attention in the primary visual cortex of the macaque monkey. Nature, 395:376–381, 1998.
25. A. Shimojima. Operational constraints in diagrammatic reasoning. In J. Barwise and G. All-wein, editors, Logical Reasoning with Diagrams, pages 27–48. Oxford University Press, Oxford, 1995.
26. A. Shimojima. Derivative meaning in graphical representations. In Proceedings of the 1999
IEEE Symposium on Visual Languages, pages 212–219. IEEE Computer Society, 1999.
27. A. Shimojima and Y. Katagiri. An eye-tracking study of exploitations of spatial constraints in diagrammatic reasoning. In G. Stapleton, J. Howse, and J. Lee, editors, Diagrammatic
Representation and Inference, 5th International Conference, Diagrams 2008, Lecture Notes
in Artificial Intelligence 5223, pages 74–88. Springer-Verlag, 2008.
28. A. Shimojima and Y. Katagiri. Hypothetical drawing in embodied spatial reasoning. In
Proceedings of the 30th Annual Meeting of the Cognitive Science Society, pages 2247–2252,
2008.
29. M. J. Spivey, D. C. Richardson, and S. A. Fitneva. Thinking outside the brain: Spatial indices to visual and linguistic information. In J. M. Henderson and F. Ferreira, editors, The Interface
of Language, Vision, and Action: Eye Movements and the Visual World, pages 161–189.
Psychology Press, 2004.
30. K. Stenning and J. Oberlander. A cognitive theory of graphical and linguistic reasoning: Logic and implementation. Cognitive Science, 19(1):97–140, 1995.
31. S. Ullman. Visual routines. Cognition, 18:97–159, 1984.