Study on Adaptive Driving Assistant System
for Elderly Drivers
SEUNGHEE HONG
Graduate School of Engineering
Kagawa University
TABLE OF CONTENTS
Page
TABLE OF CONTENTS ... ii
LIST OF TABLES ... vi
LIST OF FIGURES ...viii
Chapter 1 ... 12
Introduction ... 12
1.1 Driving and the mechanism of traffic accidents ... 12
1.2 Physical Characteristics of Elderly drivers ... 14
1.2.1 The functional limitation by aging ... 14
(1) Vision ... 14
(2) Dynamic visual acuity ... 15
(3) Night-time visual acuity ... 15
(4) Contrast sensitivity ... 16
1.2.2 Cognitive Function ... 16
1.3 Current state of elderly drivers ... 17
1.3.1 Traffic accident data by OECD Statistics report ... 17
1.3.2 Comparison between Japan and Korea ... 21
1.4 Advanced driving assistance system Theoretical framework for support for elderly drivers 23 1.4.1 Sensing Technologies ... 24
1.4.2 The types of advance driving assistance systems ... 25
(1) A type of universal driving assistance systems ... 25
Driving information systems ... 25
Driver warning systems ... 27
Intervening systems ... 28
Integrated passive and active safety systems ... 28
Fully automated systems ... 28
1.4.4 Advanced driving assistance systems ... 29
CHAPTER 2 ... 36
Investigation of elderly drivers’ driving behaviors at intersections ... 36
2.1 Definition of driving process at intersections... 36
2.2 Driving behaviors of elderly drivers at intersections ... 37
2.2.1 Evaluation of elderly drivers’ driving characteristics at intersections on field study ... 39
2.2.2 The experimental apparatus and the design of experimental intersections` ... 40
(1) Subjects of the experiment and selection of elderly drivers ... 40
(2) Experimental vehicle ... 40
(3) Design of intersections and the experimental conditions ... 42
(4) Experimental scenario ... 44
(5) Evaluation methods of deceleration behaviors ... 44
2.2.3 The results of deceleration behaviors ... 45
(1) Driving behavior ... 46
Velocity at braking initiation: Vo ... 46
The time from braking initiation to stop: Tp ... 49
The distance from stop position to a stop line: Lo ... 50
The rate of acceleration change from brake operation: Jerk ... 52
(5) The results of stopping behaviors ... 55
The rates of stop and non-stop ... 55
The result of multiple regression analysis regarding the factors of age and intersection ... 56
2.2.4 Discussion ... 58
2.2.5 Summary ... 60
CHAPTER 3 ... 62
Study on the COMPOSITION OF advanced driving asisstnace system and it’s effects based on phsical responses ... 62
3.1 The design of advanced driving assistance system for elderly drivers ... 62
3.1.1 Introduction ... 62
3.1.2 Concept of a driving assistance system ... 63
(1) Stage 1: Assistance for awareness of intersection ... 63
(2) Stage 2: Assistance for inducement of deceleration and stopping ... 63
3.2 Investigation of the effectiveness using physiological signals of auditory-visual alert for
elderly drivers ... 65
3.2.1 Introduction ... 65
3.2.2 Experimental Procedure ... 66
(1) Subjects ... 66
(2) Alarm Conditions and Procedure ... 68
(3) Physiological Indices ... 70
(4) Experimental Tasks and Scenario ... 72
(5) Statistical Methods in the Signal Analysis ... 73
3.2.3 Experimental Results ... 73
(1) Time History Curve of Physiological Signals ... 73
(2) Estimation of Alarm Effects ... 82
Sympathetic activation of LH / HF ... 82
Sympathetic activation of oxy-Hb ... 83
Parasympathetic activation of LLE ... 84
3.2.4 Discussion ... 85
3.2.5 Summary ... 86
CHAPTER 4 ... 89
Adaptive Driving Assistant System for Elderly Drivers Considering Individual Characteristics ... 89
4.1 Introduction ... 89
4.2 Experimental Methods ... 91
4.2.1 Experiment participants ... 91
4.2.2 Outline of driving assistant system ... 91
4.2.3 Experimental device and scenario ... 94
4.3 Results and Discussions ... 95
4.3.1 Behavioral changes in operation after assistance in term of recognition and judgment ability ... 95
(1) Classification of elderly individuals in term of differences in cognition and judgment abilities ... 95
(2) Difference of deceleration behavior caused by difference of cognition and judgment abilities ... 97
(3) Behavioral changes corresponding to driving support ... 99
(1) Classification of elderly drivers by driving style ... 102
(2) Deceleration behaviors caused by differences of driving style ... 104
(3) Behavioral changes corresponding to each driving support ... 104
4.4 Summary ... 108
CHAPTER 5 ... 110
application of the driving assistance system for elderly drivers... 110
5.1 Examination regarding the individual driving assistance system and the supporting timing to an elderly drivers ... 110
5.2 Study of Safety Driving Assistant System using Audio-Visual Alert... 111
5.2.1 Backgraound ... 111
5.2.2 Experimental Methods ... 112
(1) Concept of assistance method ... 112
(2) Assistance system ... 114
(3) Test course ... 116
(4) Parameters of deceleration behaviors ... 118
5.2.3 Experimental Results ... 119
(1) The effect on TTCr ... 119
(2) Effect on full stop ratio... 123
(3) Effect on Right-and-Left Check ... 125
5.2.4 Discussion ... 126
5.2.5 Summary ... 129
CHAPTER 6 ... 131
CONCLUSIONS ... 131
6.1 Summary of this paper ... 131
6.2 Suggestion on adaptability for the individual drivers ... 134
LIST OF TABLES
Table Page
Table 1.2.1 Functional limitation by ageing and the effect on driving ... 15
Table 2.2.1 Number of passes the intersection with the respective conditions ... 44
Table 2.2.2 Statistical abbreviations and definitions in the chapter ... 46
Table 2.2.3 The velocity at braking initiation: Vo comparing elderly drivers to young drivers ... 47
Table 2.2.4 The time from braking initiation to stop for age and intersection ... 50
Table 2.2.5 The distance from stop position to a stop line in terms of age and intersection ... 51
Table 2.2.6 The rate of acceleration change from brake operation: Jerk ... 53
Table 2.2.7 The results of multiple regression analysis... 57
Table 2.2.8 The rate of stop and non-stop in the various condition for elderly drivers’ braking behaviors ... 59
Table 2.2.9 Comprehensive countermeasures and individual countermeasure of safe driving regarding the features of elderly drivers ... 60
Table 3.2.1 Sequential content and timing chart for alarm conditions ... 70
Table 3.2.2 Summary of the responses at physiological ... 81
Table 3.2.3 Level of tension by increases of LF/HF based on Table 2... 82
Table 4.3.2 Participant results after preliminary tests ... 103
Table 5.2.1 The features of stop signs and blind corners ... 117
LIST OF FIGURES
Figure
Page
Figure 1.1.1 A dimension progress which results in a traffic accident ... 13
Figure 1.3.1 The number of cars per 1km of road ... 18
Figure 1.3.2 The number of traffic accidents per 100,000 persons ... 18
Figure 1.3.3 Elderly population (As a percentage of total population) ... 19
Figure 1.3.4 The rate of traffic accidents involved the elderly ... 20
Figure 1.3.5 The faculities of the elderly on traffic accidents ... 21
Figure 1.3.6 The traffic accidents situation in Japan ... 22
Figure 1.3.7 The traffic accidents situation in Korea ... 22
Figure 1.3.8 The rate of traffic accidents involved in elderly people ... 23
Figure 1.4.1 Passive safety systems which reduce fatalities in case of an accident ... 26
Figure 1.4.2 Driver behavior model with pre-information & alert system for driver ... 32
Figure 1.5.1 The flow chart of this study ... 33
Figure 2.1.1 The process of driving performances from the recognition of intersections to stopping ... 37
Figure 2.2.1 The traffic accidents in 2014-1st half in termd of road types ... 38
Figure 2.2.3 Experiment process model to evaluate elderly drivers’ driving characteristics at intersections ... 39
Figure 2.2.4 A driving car and the configuration of the experimental devices ... 41
Figure 2.2.5 The cameras to record experimental scene in the car ... 41
Figure 2.2.6 A car used in the experiment ... 42
Figure 2.2.7 Experiment devices to investgate stopping behaviors ... 43
Figure 2.2.8 Six conditions regarding the environment of intersections ... 43
Figure 2.2.9 Sequential ethogram for decelerating and stopping behaviors near the intersection ... 45
Figure 2.2.10 The average of the velocity at braking initiation: Vo ... 48
Figure 2.2.11 Individual results of Vo at braking initiation. (a) young drivers, (b) elderly drivers... 49
Figure 2.2.12 The average of time from braking initiation to stop: Tp ... 50
Figure 2.2.13 The average of the distance from stop position to a stop line: Lo ... 51
Figure 2.2.14 Individual results of Lo. (a) young drivers, (b) elderly drivers ... 52
Figure 2.2.15 The rate of acceleration change from brake operation: Jerk ... 54
Figure 2.2.16 Individual results of Jerk. (a) young drivers, (b) elderly drivers ... 55
Figure 2.2.17 The rates of stop and non-stop in terms of environments of intersections ... 56
Figure 3.1.1 Concept of a driving assistance system ... 64
Figure 3.2.1 Group classifications of forty-five elderly drivers based on the results of UFOV and MMSE .... 67
Figure 3.2.3 Driving course and driving simulator ... 73
Figure 3.2.4 Time histories of phiscal responses for every subject ... 81
Figure 3.2.5 Difference in LF/HF compared with None condition (*p < 0.05, **p < 0.01)) ... 83
Figure 3.2.6 Difference in oxy-Hb compared with None condition (*p < 0.05, **p < 0.01) ... 84
Figure 3.2.7Difference in average LLE compared with None condition (*p < 0.05, **p < 0.01) ... 85
Figure 4.1.1 Driver behavior model with preliminary information and secondary alert system ... 90
Figure 4.2.1 Driving simulator and the test course ... 95
Figure 4.3.1 Classification into for groups regarding the driving behavior of 45 elderly drivers by plotting the percentiles of both UFOV and MMSE results ... 96
Figure 4.3.2 Individual Vo and TTCo ... 97
Figure 4.3.3 The individual Vo and the TTCo ... 99
Figure 4.3.4 Change of stopping behaviors according to each step ... 101
Figure 4.3.5 Driving styles of each group classified by DSQ results... 102
Figure 4.3.6 Driving behaviors of O_a to O_d groups ... 104
Figure 4.3.7 The difference of braking management between young drivers and elderly drivers ... 105
Figure 4.3.8 The braking management from the view point of classified group by cognitive judgment and driving style ... 106
Figure 4.3.9 Driving styles of each group classified by DSQ results... 107
Figure 5.2.1 Stop task at an intersection ... 113
Figure 5.2.2 Concept of the assistance method ... 113
Figure 5.2.3 Configuration of assistece system... 114
Figure 5.2.4 Control flow of driving assistant system ... 116
Figure 5.2.5 Driving course and intersection A, B, and C ... 116
Figure 5.2.6 TTCr and Maximum deceleration ... 121
Figure 5.2.7 Braking timing in terms of TTCr and Maximum deceleration ... 121
Figure 5.2.8 TTCr and Maximum deceleration ... 123
Figure 5.2.9 The ratio of full stop and the minimum velocity at intersecions... 124
Figure 5.2.10 The rate of full-stop in terms of cognitive ability of elderly drivers ... 125
Figure 5.2.11 Frequency of right-and-left checks at intersections ... 126
Figure 5.2.12 TTCr and the effect of alert conditions for each elderly driver group ... 127
Figire 5.2.13 A example for supporting elderly driver regarding cognitive abaility ... 128
Figure 5.2.14 The effect of driving assistances in terms of process of stopping ... 129
CHAPTER 1
INTRODUCTION
1.1 Driving and the mechanism of traffic accidents
A car as a means of transportation is very useful to human, and is a machine for movement
indispensable to social life. However, since a machine for the general driver who has not received
special training, physical ability and ability to process information for drivers as the user may be
frequently exceeded. Consequently, fatigue of drivers, occurrence of traffic accidents due to long
-time driving are induced [1]. The negative aspects of cars are becoming a serious problem.
Many of traffic accidents are occurred by the error of driver's performance, i.e., through a series
of consciousness and cognition, judgment, and operation. That is, a driving performance is to
control a car through the process of cognition-judgment-operation of a driver by considering
environment information inputted. Moreover, the driving performance is functioning as human- car-
environment system which always feeds back between external information and a self-vehicle
movement state.
behaviors, spatial and temporal relations [2]. In the three-dimensional space of a figure, driving
environment (situation) is located in X-axis, driving time is located in Y-axis, and driver
performance is located as Z-axis. Regarding the driving environment in X-axis including road
environment with the difficulty of driving tasks, such as a going -straight run, a curve way and a
lane change, passing and also obstacle avoidance, the marginal performance of a car and the control
capacity of a driver are factors in the control failures. Next, regarding the driving time in Y-axis,
when driving for a long time, in case of elderly drivers, exceeding the limit of safe driving will
cause an accident. Furthermore, regarding driver performance in Z -axis, it requires the correctness
of driving action from the cognition-judgment-operation based on the age of a driver, gender, a
level of skill, and a custom, and driving safety will be hindered if this action deviates from safety
operation.
Figure 1.1.1 A dimension progress which results in a traffic accident
Z:Driver performance
X: Driving Situation
Y:Driving Time
•Performance Limit of a Car •Control Limit of a Driver
by skill, experience, age, gender
Ⓑ
Ⓐ
Straight road lane change Curve road Unpaved road Suddenly cut in Avoid faller High velocity Intersection Safety Limit Driving Limit Traffic accidentTherefore, it is thought that a traffic accident occurs in relation to a certain work load for the
change of driving situations, driving beyond the limit of driver.
1.2 Physical Characteristics of Elderly drivers
1.2.1 The functional limitation by aging
The functional limitation related aging, when driving most, is those which relate to the vision
and cognition. There are almost no signs in which a decline in the function of vision and cognition
of part of normal aging has negative result at read safety [3],[16]. The serious decline in functional
limitation as resulting aging involves in traffic accidents significantly [6], [7].
(1) Vision
Vision is the most important sense for the driving. Most of the necessary sensory to drive a car
is visual sense. However, eye disorders such as declines of visual acuity, weakened accommodation
force, narrowed visual field, macular degeneration and blurred vision like a cataract are occurred by
ageing. The disorders effect on driving performances as shown in Table 1.2.1.
Nevertheless, visual functions generally considered in driver licensing are binocular visual
acuity and visual field. Not only the minimum license requirements, but also ocular or neurological
Table 1.2.1 Functional limitation by ageing and the effect on driving
Functional limitations by ageing Driving limitation accompanied by functional limitations Declines of visual acuity
Weakened accommodation force Narrowed visual field
Macular Degeneration Delay of dark adaptation Blurred vision
Difficulty to confirm traffic environment and in-vehicle indicators
Increase of required time during eye movement Difficulty for distinctions of mixed colors on a display Restrictions in the places of indicators
Poor visibility after entering tunnels Dazzling by a headlight of other cars
(2) Dynamic visual acuity
Dynamic visual acuity is the ability to discriminate the fine parts of a moving object. Obviously,
Dynamic visual acuity is very important ability to detect movement for safe driving, not only for
being able to detect on-coming vehicles on intersecting roads and to estimate their speed, but also
for being able to detect changes in the speed of vehicles in front, i.e., stopping, slowing down,
speeding up, and reversing. However, the decline in the dynamic visual acuity with increasing age
appears to be mainly the result of age‐related changes to neural mechanisms.
(3) Night-time visual acuity
Impaired night‐time visual acuity is the result of two age‐related changes that reduce the amount of light reaching the retina: reduced pupil size and yellowing of the lens. A consequence of reduced
retinal illumination is that sources must be of higher intensity to be seen at nig ht. Sensitivity to
and other.
(4) Contrast sensitivity
As far as contrast sensitivity is concerned, elderly drivers have more difficulties detecting
objects that are not outlined clearly or that do not stand out from their background. Its deterioration
is probably attributable to changes in the eye itself as well as neural factors. Contrast sensitivity is
necessary for the perception of (the information on) traffic signs. Besides this, contrast sensitivity is
also believed to play a role in distance perception and the estimation of the speed of moving objects.
1.2.2 Cognitive Function
Age‐related declines in sensory functions such as vision and hearing have an impact on the input the driver receives from other road users and from the road environment (e.g., traffic signs and
signals, road markings). To select the appropriate information, interpret it and make decisions
which must then be translated into an appropriate driving action, and to compensate for sensory
limitations, various perceptual and cognitive functions come into play. Some of these functions
show effects of ageing. Cognitive functions for which appreciable effects of ageing are described
[19], are fluid intelligence, speed of processing, working memory, and executive functions like
inhibition, flexibility and selective and divided.
The speed, at which information is processed, is important to making safe decisions as a driver
demand placed upon him or her by the traffic environment (often referred to as ‘perception‐reaction’ time).
Research studies have generally found that reaction times to simple stimuli do not deteriorate
dramatically with age. Reaction times of elderly drivers only slow down when drivers have to make
decisions in complex situations.
1.3 Current state of elderly drivers
1.3.1 Traffic accident data by OECD Statistics report
According to a traffic situation investigation of the member nations by OCED in 2013 [1] Korea
had the number of 206.8 cars per 1km of traffic road, and ranked top. Next, Italy possessed 100.9
cars per 1km of traffic road, Japan was shown with 68.5 cars and the United States was shown with
39.2 cars shown in the Figure 1.1.1. Here the number of cars in both Japan and Korea were higher
than the OECD country average, 44.2 cars.
Figure 1.3.2 shows a result of the number of traffic accidents per 100,000 people. In this graph,
the numbers of traffic accidents in Japan are shown as the 541.8 accidents per 100,000 persons. And
the number of traffic accidents in Korea is shown with 445.4 accidents. According to this result, the
numbers of traffic accidents in both Japan and Korea are shown highly than an average of OECD,
Figure 1.3.1 The number of cars per 1km of road
Figure 1.3.2 The number of traffic accidents per 100,000 persons
Figure 1.3.2 shows a result of the number of traffic accidents per 100,000 people. In this graph, 206.8 100.9 83.8 74.0 69.6 69.1 68.5 67.0 64.0 54.2 47.9 46.9 46.6 44.4 41.1 41.0 39.3 39.2 38.3 36.0 34.1 25.1 25.0 20.1 19.5 18.1 15.2 12.2 0.0 50.0 100.0 150.0 200.0 250.0 Ko rea Italy Un ited Kin g d o m Ger m an y P o rtu g al Gr ee ce Jap an Neth er lan d s Slo v en ia P o lan d Fin lan d Sp ain A u str ia B elg iu m T u rk ey Slo v ak R ep u b lic Den m ar k Un ited States Fra n ce No rw ay New Z ea lan d Ir elan d Sw ed en Ice lan d A u str alia Hu n g ar y C an ad a E sto n ia T he nu m ber o f ca rs / 1 k m o f Ro a d Average of OECD member countries
27.5 63.4 65 100 100.4 104.9 116.7 119.2 120.6 121 122.4 161 172.6 179.9 222.6 248.4 263.2 305.9 339.2 339.2 345.8 356.9 374.5 418 437.6 445.4 500.6 541.5 0 100 200 300 400 500 600 Me x ico Den m ar k Neth er lan d s Fra n ce E sto n ia P o lan d Ir elan d F in lan d No rw ay Slo v ak R ep u b lic Gr ee ce T u rk ey Sw ed en Sp ain New Z ea lan d Un ited Kin g d o m Ic ela n d P o rtu g al Italy Slo v en ia Hu n g ar y C an ad a Ger m an y A u str ia B elg iu m Ko rea Un it ed Stat es Jap an T he nu m ber o f tra ff ic a cc idents / 1 0 0 ,0 0 0 perso ns
the numbers of traffic accidents in Japan are shown as the 541.8 accidents per 100,000 persons. And
the number of traffic accidents in Korea is shown with 445.4 accident s. According to this result, the
numbers of traffic accidents in both Japan and Korea are shown highly than the average of OECD,
313.1 accidents, and that of Japan is extremely serious.
Figure 1.3.3 Elderly population (As a percentage of total population)
Figure 1.3.3 shows percentage of the elderly population in 2010, compared with 1995. As shown
this figure, the percentage of elderly persons in most of nations increased than 1995, while, the
number in Norway declined only. Remarkably, the percentage of elderly pers ons in both Japan and
Korea increased with 30%, so the percentage shows 19.79 percentages in Japan and 10.96
percentages in Korea. 6.21 7.01 10.15 10.96 12.26 12.26 13.03 13.07 13.07 13.52 14.14 14.88 15.31 16.31 16.53 16.61 16.80 17.01 17.07 17.16 17.62 18.10 18.95 19.79 22.84 0.00 5.00 10.00 15.00 20.00 25.00 Me x ico T u rk ey Ir elan d Ko rea A u str alia Slo v ak Rep u b li c New Z ea lan d Un ited Kin g d o m Un ited States Po lan d C an ad a No rw ay Neth er lan d s D en m ar k Slo v en ia Hu n g ar y Fra n ce Fin lan d E sto n ia B elg iu m A u str ia Sw ed en Gr ee ce Italy Japan T he ra te o f elderly po pu la tio n
2010 1995 or first available year
Average of OECD member countries 14.82 % (12.34% in 1995)
Figure 1.3.4 The rate of traffic accidents involved the elderly
Figure 1.3.4 shows the rate of traffic accidents involved the elderly. As a result, Korea (33.0
percentages), Netherlands (34.3 percentages), and Italy (36.9 percentages) exceeded the average,
22.6 percentages, of traffic accidents by the elderly in OECD countries. Remarkably, Japan has a
much higher percentage as 50.3 percentages. Therefore, each Japan and Korea has higher risk of
traffic accidents by elderly drivers.
Next, Figure 1.3.5 shows the facilities of elderly on traffic accidents per 100,000 persons who
are over 65 years old. As the results, the average of OECD member countries was 10 persons per
100,000 persons who are over 65 years old. Greece (11.9), United stated (13.0), Poland (13.7),
Portugal (13.7) and Korea (30.5) exceeded the average. Korea is extre mely higher than the other
countries. However, although in case of Japan, the rate of accidents involved elderly drivers is the
16.3 16.7 16.7 16.9 18.1 18.5 18.5 19.1 19.4 19.9 21.3 21.4 22.4 22.8 26.0 28.1 28.5 28.6 28.7 29.6 33.0 34.4 36.9 50.3 0.0 10.0 20.0 30.0 40.0 50.0 60.0 Slo v en ia Un it ed Stat es Ice lan d P o lan d A u stralia Hu n g ar y C an ad a Fra n ce New Z ea lan d Ir elan d B elg iu m N o rw ay Un ited Kin g d o m Gr ee ce Ger m an y Fin lan d Sw ed en Den m ar k A u str ia P o rtug al Ko rea Neth er lan d s Italy Japan T he ra te o f tra ff ic a cc idents inv o lv ed the elderly
Average of OECD member countries 22.6%
highest, the number of facilities of the elderly is lower than the average of OECD countries.
Figure 1.3.5 The faculities of the elderly on traffic accidents ( per 100,000 persons over 65 years old)
1.3.2 Comparison between Japan and Korea
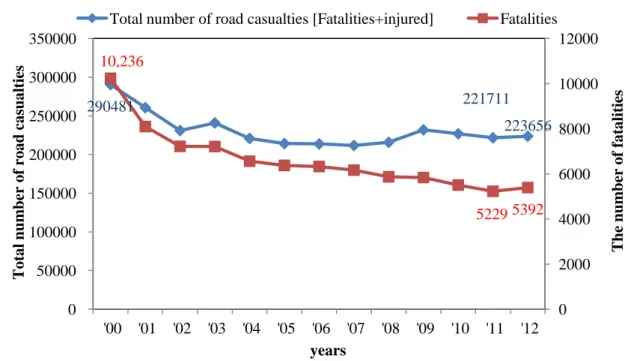
Figure 1.3.6 shows the situation of total number of casualties by traffic accidents and fatalities’
numbers in Japan. And Figure 1.3.7 shows the situation of total number of road casualties by traffic
accidents and fatalities’ numbers in Korea. As the investigated result, the number of fatalities in
Japan is 9,073 persons in 2000 and 4,373 persons in 2013. The value has been declining. E qually,
the value for fatalities in Korea have been declining 2000 to 2011, however, the number in 2012
was increased. 4.2 4.9 5.1 5.2 6.2 6.7 6.7 6.8 7.0 7.1 7.2 7.4 8.2 8.4 8.5 8.7 9.3 9.4 9.7 10.1 11.9 13.0 13.7 13.7 30.5 0.0 5.0 10.0 15.0 20.0 25.0 30.0 35.0 Un ited Kin g d o m No rw ay Icelan d Sw ed en Ger m an y Den m ar k Sp ain Slo v en ia Fra n ce Ir elan d Neth er lan d s A u str alia Hu n g ar y Italy C an ad a Fin lan d Jap an New Z ea lan d B elg iu m A u str ia Gr ee ce Un ited States Po lan d P o rtu g al Ko rea T he facul it ie s of t he el derl y on tr af fi c acc idents ( per 100,000 pers ons over 65 year s
Average of OECD member countries 10 persons/ per 100,000 persons over 65 years old
Figure 1.3.6 The traffic accidents situation in Japan
Figure 1.3.7 The traffic accidents situation in Korea
Figure 1.3.8 shows the rate of traffic accidents involved with elderly people. In case of Japan,
the rate increased from 42.5 percentages in 2005 to 50.6% in 2012. Korea, the rated increased from 931,950 665138 629,021 9,073 4411 4,373 0 1000 2000 3000 4000 5000 6000 7000 8000 9000 10000 0 200000 400000 600000 800000 1000000 1200000 '00 '01 '02 '03 '04 '05 '06 '07 '08 '09 '10 '11 '12 '13 T he num ber of Fatal it ies T ot al num ber of road cas ual ti es years
Total number of road casualties [Fatalities+injured] Fatalities
290481 221711 223656 10,236 5229 5392 0 2000 4000 6000 8000 10000 12000 0 50000 100000 150000 200000 250000 300000 350000 '00 '01 '02 '03 '04 '05 '06 '07 '08 '09 '10 '11 '12 T he num ber of f at al it ies T ot al num ber of road cas ual ti es years
26.7 percentages in 2005 to 34.6 percentage in 2012 and had been incre asing steadily. The rate
exceeded with half of all traffic accidents. But above all, it is a serious condition which accounts for
over 50 percent of traffic accidents in Japan. The measures to minimize the rate of traffic accidents
involved elderly people are urgently needed.
Figure 1.3.8 The rate of traffic accidents involved in elderly people
1.4 Advanced driving assistance system Theoretical framework
for support for elderly drivers
Advanced driver assistance systems (ADAS) are systems developed to enhance safety and better
driving. Safety features are designed to avoid collisions and accidents by offering technologies that
alert the driver to potential problems, or to avoid collisions by implementing safeguards and taking 42.5 43.6 46.9 47.9 48.7 50.1 48.9 50.6 26.7 27.4 29.0 29.6 31.3 31.8 33.0 34.6 0.0 10.0 20.0 30.0 40.0 50.0 60.0 '05 '06 '07 '08 '09 '10 '11 '12 T he rat e of t raf fi c acci den invol ved in el derl y peopl e years Japan Korea
control, automatic braking, incorporate with GPS/ traffic warnings, connect to smart phones, alert
driver to other cars or dangers, keep the driver in the correct lane, or show what is i n blind spots.
1.4.1 Sensing Technologies
Advanced Driving Assistance System (ADAS) is the system to detect the traffic situations
around vehicles or pedestrians, etc. and prevent traffic accidents through using sensor devices at the
front, the side and the rear of cars. Therefore, the realization of ADAS is possible since there are the
advanced sensing technologies.
The sensing technologies detecting surrounding traffic state are a radar technology (Radio
Detection and Ranging), are a ladar technology (Laser Detection and Ranging), a photography
technology (picture processing and picture recognition) and a wireless data communications
technology.
The radar technology is easy for metallic material detection as well as detection in bad weather,
but there is a weakness in which the level of resolution is low more than a ladar camera.
The ladar technology which has a spatial resolving ability of very high level is possible for a
phenomenon distinction of an object. However, it's affected in the weather state, and there is a
weakness on which a laser beam is scattered.
The photography technology is possible to detect a distance based on a relation between a
picture and an object using two cameras. Because the level of its resolution is excellent, the
detection in the area where a night headlight can't light up is difficult. On the other hand, the
wireless data communications technology using a road map and information in terms of traffic flow
or congestion is little influenced by the weather conditions and driving time.
Currently, for the recognition related traffic objects, the fusion of multiple sensor, camera based
sensors, deepness cameras, vehicle sensors as well as radar and ladar sensors data has been used
and reported [20].
1.4.2 The types of advance driving assistance systems (1) A type of universal driving assistance systems
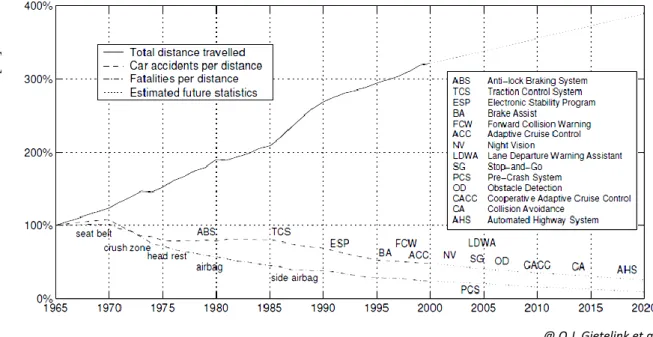
Active safety systems like ABS and ESP improve traffic safety by assisting the driver. In
addition, advanced driver assistance systems (ADASs) have the potential to significantly reduce the
number of road accidents. An ADAS which is a vehicle control system improve driving comfort a nd
traffic safety by assisting the driver in recognizing and reacting to potentially dangerous traffic
situations as shown Figure 1.4.1.
The following types of the intelligent vehicle systems can be distinguished [21]:
Driving information systems
Driver information systems provide basic driving information in terms of driving to drivers, and
enhance the driver’s situation awareness. For instance, there is advanced route navigation systems.
Guidance System (ERGS), aiming to provide route guidance to vehicles. Next, Since 1990, Global
Positioning System (GPS) and Geographic Information System (GIS) technologies have progressed
significantly and have been widely used to improve navigation systems.
@ O.J. Gietelink et al.
Figure 1.4.1 Passive safety systems which reduce fatalities in case of an accident
Recently, there has been a lot of research on route guidance and path finding, particularly
investigating dynamic traffic situation such as congested section. A substantial number of studies
have been conducted to make a driver model dealing with users’ behaviors under Advanced
Traveler Information Systems (ATIS), a well-known RGS. To this end, under intelligent
transportation systems, the dynamic route guidance system (DRGS) has received wide attention
such as climate condition that it can't be expected, road closing and collision situations. This system
can provide routing suggestions to users in accordance with current traffic con ditions.
The rat es of t ravel ed di st anc e [ % ]
Driver warning systems
Driver warning systems warn the driver in terms of a potential danger in driving. Its systems,
there are a lane departure warning system, a blind spot warning system and forward collision
warning (FCW) systems.
The lane departure warning system warns a driver when the vehicle begins to deviate from its
lane. In 2009 the U.S. National Highway Traffic Safety Administration (NHTSA) began studying
whether to mandate lane departure warning systems and frontal collisio n warning systems on
automobiles
Recently, a real-time and various illumination invariant lane detection methods for lane
departure warning system in bad weather conditions and at night time were suggested. As the
results, an average detection rate show sufficient performance with 93%. Moreover, regarding
driver behavior models of the directional sequence of piecewise lateral slopes (DSPLS), the system
has a detection error with as low as 17%.
The blind spot warning system (BSWS) warns a driver when there are prospective collision
risks using a vision-based BSD system with dynamic camera calibration and image pre -processing
methods.
The forward collision warning (FCW) systems are based on camera or radar sensors monitoring
the road ahead. They provide object recognition and detect relative speeds between a vehicle and
through a number of warning methods.
Intervening systems
The intervening systems provide active support to the driver. As one example of this system,
there is an adaptive cruise control (ACC) system. ACC is a comfort system that maintains a set
cruise control velocity, unless an environment sensor detects a slower vehicle ahead. The ACC then
controls the vehicle to follow the slower vehicle with safe distance. ACC is intended for speeds
above 30 km/h, but is currently being extended to a stop -and-go application for automated
longitudinal control in low-speed complex environments, such as traffic jams and urban areas.
Integrated passive and active safety systems
In addition to passive safety systems that are activated during the crash, a pre -crash system can
mitigate the crash severity by deploying active and passive safety measures before a collision
occurs. Pre-crash safety measures, such as brake assist and seat belt pre -tensioners, have recently
been introduced on the market.
Fully automated systems
Fully automated systems are the next step beyond driver assistance, and operate without a
human driver in the control loop. Automated highway systems, using fully automated passenger
cars, are expected to significantly benefit traffic safety, but are not considered for short-term
1.4.4 Advanced driving assistance systems
To prevent accidents of elderly drivers, it is effective to present driving supports with regard to
the characteristics of each driver. Moreover, consumers' price consciousness regarding a car is high,
and the cost for driving assistance system should be regarded. That is, we have to consider so that a
system may be realized as low cost as possible. Conversely, spreading systems to more users can
bring social meaning than offering systems as low cost for the first time.
Both Japan and Korea are already aged societies so, safe and comfortable mov ement is a
mission of a car, moving will be the social life itself. Therefore, a supporting technology to safe and
comfortable operation will become increasingly important.
The driving support in consideration of the driver's characteristic is needed for coexistence of
the safety of road traffic and convenience accompanying computerization of these days. In other
words, supporting certain information for drivers when driving is exactly realizing "coexistence
with cars, and human beings under all environment". On the other hand, as mentioned above,
driving performance is functioning as human beings, cars and environment system. Therefore, an
understanding of the human characteristic relevant to the feature of cognition leading to certain
driving behaviors becomes indispensable for development of driving support systems. That is,
prevention of errors accompanying introduction of information systems like a navigation system is
important. However, the interface designs which reduce work loads of drivers still no t enough.
operation decision-making, have been studied. Investigation of the driving behavior in real traffic
roads, observation of driving operation behaviors under the simulated environment in the virtual
space using a driving simulator, field researches using in -vehicle electronic counting system, etc.
have been carried out. Regarding the research trends, investigations of near miss collisions using
drive recorders, and conformity assessment of driver characteristic and the driving support
technology in a real vehicle driving experiment have been progressing quickly with remarkable
development of sensor technology [22].
Considering a future society, a research for an ecological car utilizing natural resources is
advanced. At the same time, prevention of traffic accidents against a super aged society is ne eded.
Focusing on the traffic environments in which elderly drivers are driving, many elderly drivers’
accidents have been occurring at intersections [23], and straight single ways and curve roads.
Regarding previous studies for elderly drivers at the intersection, there were the results that they
caused an error (e.g., the failure of detecting signal change, vehicles, and pedestrians) when the
elderly drivers did not show the proper operation at the intersection. Metropolitan Police
Department of Japan reported that the reasons of causes of accidents occurred at intersections are
delay or failure on detection of vehicles, stop signs or intersections (67.1 %), error when judging a
certain driving performance (10.0 %), error when operating (5.9 %), and collisions of unknown
cause (17%). It is mentioned that there is not an uniform measures to avoid accidents because of
linger that of non elderly drivers. In addition, elderly drivers usually have miss many operation in
the target selective task. Therefore, an effective driving assistance system which decreases elderly
drivers’ accident is needed.
Based on the above-mentioned background, this study was set up on the theme of a design
method of a driving assistance system with regard to an interaction of man -machine system, and we
summarized the result of research. Especially aiming at the traffic accident prevention in a future
aged society, a practical design method of a driving assistance system for elderly drivers is
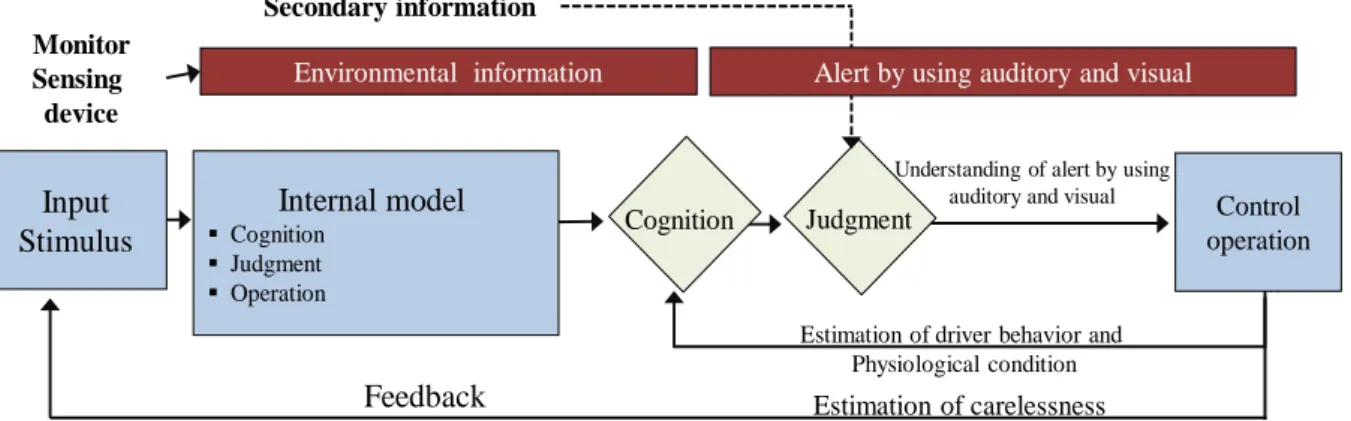
constructed and applied. A foundational structure of driving assistance system aimed at this
research is shown in Figure 1.4.2. Driving behaviors are known as a series of recognizing a
surrounding driving environment, judging safety and carrying out steering or braking operation by
considering the driving environment as an input according to the internal behavior model of
cognitive judgment for each driver. If the complex driver performance (cognition
-judgment-operation) is simplified, it is helpful to elderly drivers. For instance, when approaching
intersections, presenting external information to increase attention to elderly drivers using a driving
monitoring technology is designed. Next, when braking operation presents second information to
induce proper timing and stopping position using an audiovisual device in terms of a stopping
Figure 1.4.2 Driver behavior model with pre-information & alert system for driver
1.5 Scope of the dissertation
This paper is composed with 6 chapters as follows.
Chapter 1: Introduction
Chapter 2: Investigation of elderly drivers’ driving behaviors at intersections
Chapter 3: Study on the composition of advanced driving assistance driving assistance system
and it’s effects based on physical
Chapter 4: Adaptive driving assistance system for elderly drivers considering individual
characteristics
Chapter 5: Application of the driving assistance system for elderly drivers
Chapter 6: Conclusions
The contents of each chapter and mutual relation for examinations are displayed by a block
diagram as shown in Figure 1.5.1.
\\
Feedback Estimation of carelessness
Control operation Cognition Internal model Cognition Judgment Operation Input Stimulus Judgment
Estimation of driver behavior and Physiological condition
Secondary information
Understanding of alert by using auditory and visual
Monitor Sensing device
Figure 1.5.1 The flow chart of this study
In Chapter 1 "Introduction", characteristics of elderly drivers are defined. Progress of traffic
accident prevention safety technology and the present condition of developing of driving support
technology are surveyed, and the composition of the background of research, the research purpose
are shown.
In Chapter 2 "Investigation of elderly drivers’ driving behaviors at intersections ", driving
Chapter 1
Clarifying the problems of elderly driver’ driving behaviors at non-signal intersections
Chapter 2
Clarifying the problems of elderly driver’ driving behaviors at non-signal intersections
Chapter 3
Investigation of effect on physiological signalsChapter 4
Investigation of effect on driving behaviorsChapter 5
Investigation of effect on driving behaviors in real drivingenvironment Revised
DAS
Chapter 6 Conclusions
Effect in a driving simulator environment
behaviors in terms of braking of elderly drivers were investigated. Here, the characteristics of the
elderly driver's driving behavior were observed. Therefore, it was clarified that requirements of a
system to assist braking behavior was needed.
In Chapter 3 "Study on the composition of advanced driving assistance driving assistance
system and it’s effects based on physical", the driving assistance systems, using combinations of
audiovisual alarms, to prevent many traffic accidents by elderly drivers were designed. To verify
the effect of suggested system, physiological index like a driver's cardiac beats, a cerebral blood
flow, and a body surface pulse wave were measured. As a result, it was clarified that the individual
difference of physiological reaction of elderly drivers was wide, and requirement of an optimal
alarm system concerning this individual difference is confirmed.
In Chapter 4 "Adaptive driving assistance system for elderly drivers considering individual
characteristics", change of braking behaviors of elderly drivers with a driving assistance system in a
driving simulator environment was observed. Moreover, although individual difference brought by
the ability of cognition and judgment, the positive effects on braking behaviors was clarified.
Especially, the system is more effective to elderly drivers whose physical ability had fallen.
In Chapter 5 “Application of the driving assistance system for elderly drivers", I verified effect
of the driving support system though field tasks. Generally, assistance warning by a beep sound had
the highest effect to enhance early brake behavior for an elderly drivers’ group who had the inferior
the rates of full stopping. In contrast, a voice condition was very effective for elderly drivers’ group
whose cognition function was not inferior.
CHAPTER 2
INVESTIGATION OF ELDERLY DRIVERS’
DRIVING BEHAVIORS AT INTERSECTIONS
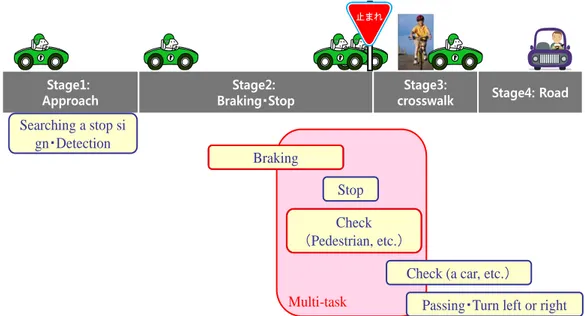
2.1 Definition of driving process at intersections
Driving behaviors when approaching at intersections consist of several steps in driving process,
cognition-judgment-control. At first, the driver approaching at intersections recognizes there are
intersections with stop signs or stop lines, etc.. And the driver selects the timing putting on a
braking pedal and operates a brake pedal by appropriate force and method. At the same time, the
driver should check other vehicles, pedestrians or other traffic objects. Finally, the driver stopped at
intersections operates slowly an accelerate pedal while confirming oncoming other traffic objects.
This driving process at intersections is a multitask, and elderly drivers have trouble for carrying
out appropriate driving operations. Therefore, traffic accidents related elderly drivers occur
Figure 2.1.1 The process of driving performances from the recognition of intersections to stopping
2.2 Driving behaviors of elderly drivers at intersections
Driving behaviors have been reported as a very complex task in sequential operations with the
information of visual aspects among sensory aspects of a human. The many preceding studies
suggested that the number of accidents near intersections occur frequently.
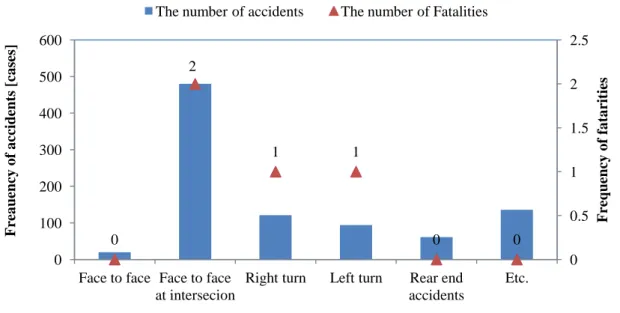
According to a report of Japan Metropolitan Police Department in 2014 -1st half, traffic accidents
occurred at intersection (28.0%) and at near intersections (24.1 %) as shown in Figure 2.2.1. Hence,
regarding the types of traffic accidents occurred elderly drivers, the face to face accidents was 480
cases in total of 916 cases as shown in Figure 2.2.2. Stage1:
Approach Braking・StopStage2: crosswalk Stage3: Stage4: Road
Multi-task
Stop Check (Pedestrian, etc.)
Check (a car, etc.) Braking
Searching a stop si gn・Detection
Figure 2.2.1 The traffic accidents in 2014-1st half in termd of road types
Figure 2.2.2 The traffic accidents occurred by elderly drivers in 2014-1st half in termd of road types
Past researchers examined the effects of attention failures at intersections on driving behaviors.
Failures of drawing attention may result from the improper distribution of attention, difficulties of
visual recognitions, and/or inappropriate selective attention . Therefore, if the visual ability of a
driver is deteriorated and damaged [12] [18], he or she has to select the limited driving behavior or
give up the driving [11]. Considering these aspects, the behaviors of elderly drivers pertains to the Intersection 58.0 % Road 24.1 % Near intersection 24.1 % Railroad, etc. 1.4 % 0 2 1 1 0 0 0 0.5 1 1.5 2 2.5 0 100 200 300 400 500 600
Face to face Face to face at intersecion
Right turn Left turn Rear end
accidents Etc. F re qu ency o f fa ta rit ies Fre a u ency o f a ccid ents [ ca ses ]
important variable in driving behavior. When they selected an inappropriate timing on driving
behaviors compared to younger drivers, they cause traffic accidents. Many studies reported that the
physical ability of elderly drivers deteriorates, because of the limitation of visual function related
aging influenced on driving behavior [10]. Therefore, elderly drivers, who make wrong decisions in
terms of braking timings [14] or the force putting a brake pedal due to severe deteriorations by
ageing, cause traffic accidents [7], [27].
2.2.1 Evaluation of elderly drivers’ driving characteristics at intersections on field study
In this Chapter, the driving characteristics of elderly drivers during approaching and stopping to
the intersections were investigated through field tests. The characteristics of driving performances
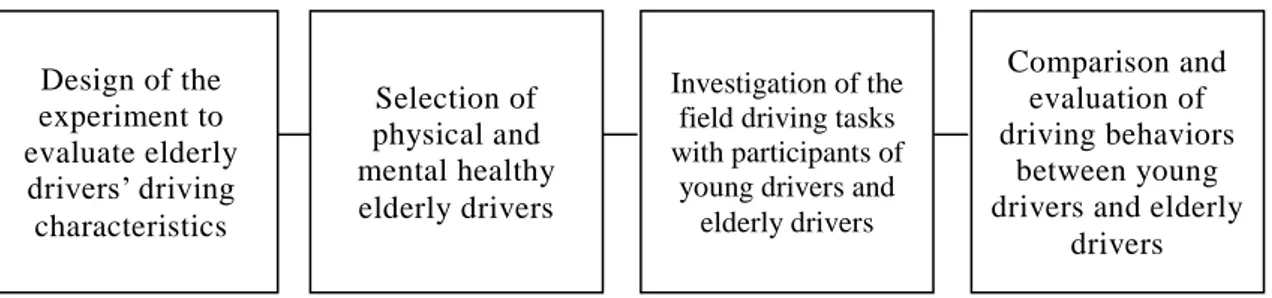
between young drivers and elderly drivers were compared. A flow of the driving experiment is
shown in Figure 2.2.3.
Figure 2.2.3 Experiment process model to evaluate elderly drivers’ driving characteristics at intersections
I designed an experiment to investigate elderly drivers’ driving characteristics at intersections,
comparing with young drivers. At first, I needed to select physical and mental healthy elderly
participants. Therefore, I recruited healthy elderly drivers through a local job center, and Design of the experiment to evaluate elderly drivers’ driving characteristics Selection of physical and mental healthy elderly drivers Investigation of the field driving tasks with participants of
young drivers and elderly drivers
Comparison and evaluation of driving behaviors
between young drivers and elderly
investigated physical and mental ability of elderly drivers. Next, the selected elderly drivers and
young drivers joined the field driving tasks, and the driving tasks were evaluated and analyzed.
2.2.2 The experimental apparatus and the design of experimental intersections`
(1) Subjects of the experiment and selection of elderly drivers
Ten elderly drivers over 65 years old and ten young drivers were participated in the driving
tasks. The young drivers (men; 7, women; 3, 22.3~24.0 years, mean age; 23 years) having more
than one year of driving experience joined the experiment.
For selecting elderly persons having no trouble in driving, I asked a local job center to recruit
healthy elderly participants. I recruited 45 elderly participants. At first, elderly drivers were joined
a listening survey of personal information, a visual acuity test, a color vision test, Mini Mental
State Examination (MMSE) and Usual Field of Visual (UFOV). The results of the test, I selected
healthy 10 elderly drivers (males; 5, females; 5, 69 ~ 78 years).
(2) Experimental vehicle
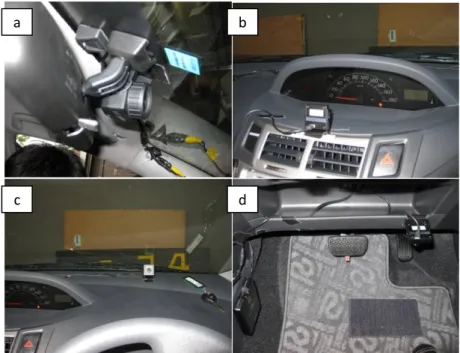
Figure 2.2.4 shows a car used at the driving tasks and the configuration of the experimental
devices. In this car, a GPS sensor, an optoelectronic switch, four cameras and computer devices
were installed. The GPS sensor obtained data regarding the lateral and longitudinal velocity and the
Figure 2.2.4 A driving car and the configuration of the experimental devices
Figure 2.2.5 The cameras to record experimental scene in the car
(a: forward scene, b: speedometer scene, c: driver scene, d: brake pedal scene) FA computer Interface ETC-A013(S) (Intel Atom Z520PT 1.33GHz) (Windows Embedded) GPS sensor DATA TEC M12P/10S (GPS, speed, etc.) Portable HDD Buffalo HD-PSG500U2 [500GB] (Data storage and e: Drive) RS-232C USB Capture Princeton PCA-DAV2 Optoelectronic switch
(Pedal leg position) Omron E3T-FL21 USB Game controller Sanwa supply JY-PMUW USB DC12V 12V 0V Out Relay Omron G2R-1-SND + in -out + -sw4 Liquid crystal display monitor Quick Sun QT-1005B(AVG) (System surveillance) アナログRGB GPS antenna 4 division equipment Tsukamoto radio T-PQS-400CS Camera 2 Tsukamoto radio T-PI-1888C (Speedometer, 67 degrees) Camera 1 Tsukamoto radio SM-CHJ-8C (Front and 61 degrees) Camera 3 Tsukamoto radio T-PI-1888C (Driver, 67 degrees) Camera 4 Tsukamoto radio T-PI-1888C (A step, 67 degrees) Keyboard Sanwa supply SKB-TP01SV USB DC12V AC100V (Adapter) AC100V (Adapter) AC100V (Adapter) AC100V (Adapter) AC100V (Adapter) AC100V (Adapter) USB converter Konteck COM-1(USB)H USB DC12V AC100V Electric socket DC12V ソケット Inverter Seiwa D193 Rating 180W Vehicles DC12V (Cigar) OATap Socket distribution
40
a b c dThe optoelectronic switch detected braking operations, and four cameras recorded a forward
driving scene, a speed meter scene, a driver's facial scene and a brake pedal behavior scene as
shown in Figure 2.2.5. All these data was stored into a personal computer on the car.
(3) Design of intersections and the experimental conditions
The experimental driving was conducted at a driver's license training ground with 230 m X 130 m in Kagawa prefecture of Japan as shown in Figure 2.2.6.
Figure 2.2.6 A car used in the experiment
Three intersections without traffic lights were selected, and separately designated as the
intersection A, B and C. In order to set various intersection environments, stop signs, blind corners,
rubber stop lines were set. Cameras and graduated rulers to measure stop were used as shown in
Figure 2.2.7.
A
B
(a) Graduated ruler to measure stopping position (b) Video camera to record stopping behaviors
Figure 2.2.7 Experiment devices to investgate stopping behaviors
Moreover, for evaluating the effect of environment of intersections on braking behaviors, six
conditions using various features of stop signs and blind fences were designed as shown in Figure
2.2.8. An ordinary stop sign and enhanced stop sign which has flashing red LED lamp were selected.
(4) Experimental scenario
After participants rode on the experimental vehicle, the operator in the back seat briefly
explained a role of the whole experiment. Then, they had a short driving to learn a sense on the road
for five minutes, and returned to the starting point to begin this experiment. The experiments were
made of the primary and secondary experiment, and each experiment passed all intersection A, B
and C, each trial was carried out twice in twenty minutes. Numbers of passes of the intersection
with the respective conditions are shown as follows in Tab le 1.
Table 2.2.1 Number of passes the intersection with the respective conditions
Intersection
Combination Intersection
No Sign Typical Sign LED-enhanced Sign
with blind corner without blind corner with blind corner without blind corner with blind corner without blind corner Ⅰ A 2 2 B 2 1 1 C 1 2 1 Ⅱ A 1 1 1 B 1 2 2 C 1 1 1 1 Total 4 4 4 4 4 4
(5) Evaluation methods of deceleration behaviors
Regarding the process of deceleration at intersections, p arameters to evaluate driving behaviors
were selected. Figure 2.2.9 shows a sequential echogram in terms of deceleration and stopping
behaviors near the intersection. The parameters are as follows:
The velocity at braking initiation: Vo [Km/h]
The distance from stop position to a stop line: Lo[m]
The rate of deceleration change from braking operation: Jerk [m/s3]
Figure 2.2.9 Sequential ethogram for decelerating and stopping behaviors near the intersection
2.2.3 The results of deceleration behaviors
Statistical methods were used and the statistical terminology was used in this study. There are
defined here. (1) MS: the mean squares, (2) SEM: the standard deviation, (3) df: the degrees of
freedom, (4) F: the F-ratio which cuts off various proportions of the distributions. This may be
computed for different values of df1 and df2., (5) T: the T-ratio which cuts off various proportions
of the distributions. This may be computed for values of df.,(6) p: prob, probability, sig., or sig. of
F/T, (7) VIF: the Variance Inflation Factor by David, 1998.
Vision Recognition of intersection Perception of a stop sign Brake-initiation Acceleration-off
The time from braking initiation to stop: Tp
t
Slow down stop ・Velocity
・Deceleration
・The rate of acceleration change from
braking operation. : Jerk
Behaviors of deceleration
The distance from stop position to a stop-line : Lo
The velocity at braking initiation: Vo
Table 2.2.2 Statistical abbreviations and definitions in the chapter
Statistical
abbreviation Definition
(1) MS Mean Squares
(2) SEM Standard deviation
(3) df Degrees of freedom
(4) F F-ratio which cuts off various proportions of the distributions. This may be computed for different values of df1 and df2
(5) T T-ratio which cuts off various proportions of the distributions. This may be computed for values of df
(6) p Prob, probability, sig., or sig. of F/T
(7) VIF Variance Inflation Factor
(1) Driving behavior
Because the driving behavioral data, Vo, Tp, Lo and Jerk have the correlation with a series of
these braking operations, the results of deceleration behaviors in detail were attached in an
appendix. I set up the dependent variable with age and the intersection by Multivariate Tests .
Velocity at braking initiation: Vo
The Vo at braking initiation were investigated for each intersection, Vo of young drivers at
intersection A was M = 31.1 ± 2.558 km/h (average ± standard deviation). And Vo of elderly drivers
at intersection A was M = 32.27 ± 3.051 km/h. Next, Vo of young drivers at intersection B was Vo
M = 26.865 ± 3.437 km/h, and that of elderly drivers was M = 31.158 ± 4.454 km/h. At intersection
4.454 km/h as shown Table 2.2.3.
According to Multivariate Tests in terms of age and intersection, a result of age factor had very
significant differences with [MS= 163.614, F (1, 87) = 11.293, p = .001]. Next, according to the
results of Paired-Samples T Test (two levels: young and elderly driver), at intersection A, there was
no significant difference with [MS = -1.17000, SEM = 1.45450, df = 9, t =-. 804 p =. 442], at
intersection B, there was very significant difference with [MS =- 4.58947, SEM = 1.38401, df = 18 ,
t =- 3.316 p =. 004], and at intersection C, there was a significant difference with C [MS =- 3.726,
SEM = 1.4375, df = 9, t =- 2.592 p =. 018], as shown in Figure 2.2.10.
Also, regarding intersection as a main factor, there was very significant difference as [MS =
276.247, F (2, 87) = 19.067, p =. 000]. According to a results from Scheffé test (three levels:
intersection A, B, and C), Vo intersection A was higher than that of intersection C as [MD = 2.8077,
SEM = 1.07431, p = .037], Vo of the intersection of B was higher than that that of intersection C as
[MD = 5.473, SEM = .8850, p = .000]. However, at an interaction between age and the intersection,
there was no significant difference with [MS = 17.174, F (2, 87) = 1.185, p = .311].
Table 2.2.3 The velocity at braking initiation: Vo comparing elderly drivers to young drivers Age group Intersection A B C Young drivers Ave. 31.1 26.865 32.6 Std. 2.558211 3.437299 3.902091 Elderly drivers Ave. 32.27 31.15789 36.2 Std. 3.050701 4.453627 3.99291
Figure 2.2.10 The average of the velocity at braking initiation: Vo
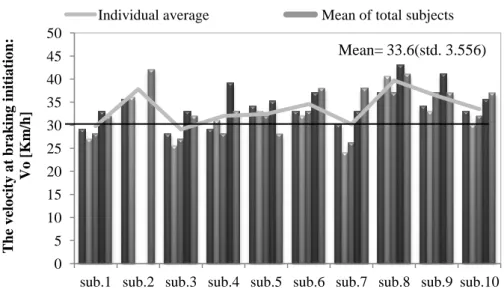
Figure 2.2.11 shows the individual Vo. As the results, both young and elderly driver show
difference in the individuals. The elderly divers have higher individual difference.
(a) Vo of young driver 0 5 10 15 20 25 30 35 40 45 50 A B C Velo cit y a t bra k ing ini tia tio n: Vo [k m /h] Intersection
young drivers older drivers
S.D. ** * ** (*p<.05, **p<.01) Elderly drivers Young drivers ** 0 5 10 15 20 25 30 35 40 45 50
sub.1 sub.2 sub.3 sub.4 sub.5 sub.6 sub.7 sub.8 sub.9 sub.10
T he v elo cit y a t bra k ing ini tia tio n: Vo [K m /h]
Individual average Mean of total subjects
(b) Vo of elderly drivers
Figure 2.2.11 Individual results of Vo at braking initiation. (a) young drivers, (b) elderly drivers
The time from braking initiation to stop: Tp
The time deceleration from onset of deceleration to the lowest speed or stop, Tp was
investigated. Tp of young driver at the intersection A was M = 6.555 ± 0.943s (average ± standard
deviation), and Tp of elderly drivers at the intersection A was M = 6.2 ± 1.2401s. At intersection B,
Tp of young rivers was M = 6.314 ±1.090s, and that of elderly drivers was M = 5.9 ± 1.2867s. And
Tp of young drivers at the intersection C was M=6.835±1.0414s, that of elderly drivers was
M=6.305±1.1891s as shown Table 2.2.4
As the result of Multivariate Tests, “age” as a main factor was shown significantly no difference
as [MS = 2.753, F (1, 87) = 2.127, p = .148], “intersection” as a main factor was also shown
significantly no difference as [MS = 1.299, F (2, 87) = 1.003, p =. 371]. Interaction between “age” 0 5 10 15 20 25 30 35 40 45 50
sub.1 sub.2 sub.3 sub.4 sub.5 sub.6 sub.7 sub.8 sub.9 sub.10
T he v elo cit y a t bra k ing ini tia tio n: Vo [ K m /h]
Individual average Mean of total subjects
and “intersection” also was also shown significantly no difference as [MS = .238, F (2, 87) = .184,
p = .832], as shown in Figure 2.2.12.
Figure 2.2.12 The average of time from braking initiation to stop: Tp
The distance from stop position to a stop line: Lo
Figure 2.2.13 shows the result of Lo. Lo of young drivers at the intersection of A was M =- 0.29
± 0.9218m (average ± standard deviation), and that of elderly drivers was M =- 0.656 ± 1.240 m. At
intersection B, Lo of young drivers was M =- 0.401 ± 0.8629 s, and Lo of elderly drivers was M =- 0 1 2 3 4 5 6 7 8 9 A B C T he tim e fro m bra k ing ini tia tio n t o s to p: T p ( s) Intersection
young drivers older drivers
S.D.
(*p<.05, **p<.01) Elderly drivers Young drivers
Table 2.2.4 The time from braking initiation to stop for age and intersection
Age group Intersection A B C Young drivers Ave. 6.555 6.314 6.835 Std. 0.943531 1.08984 1.041393 Elderly drivers Ave. 6.2 5.9 6.305263 Std. 1.240072 1.286684 1.189058
0.648421053 ± 0.7854 m. And, Lo of young drivers at the intersection C was M =- 0.223 ± 1.0861
m, that of elderly drivers was M =- 0.681 ± 0.6560 m as shown Table 2.2.5.
Table 2.2.5 The distance from stop position to a stop line in terms of age and intersection Age group Intersection A B C Young drivers Ave. -0.29 -0.40105 -0.22316 Std. 0.921894 0.862889 1.086104 Elderly drivers Ave. -0.65556 -0.64842 -0.68056 Std. 0.913935 0.785453 0.655999
Figure 2.2.13 The average of the distance from stop position to a stop line: Lo
Next, as the result of Multivariate Tests, “age” as the main factor shown significantly no
difference as [MS = 2.475, F (1, 87) = 3.224, p = .076], “intersection”, a main factor, and
interaction between “age” and the “intersection” were also shown significantly no difference as
[MS = .025, F (2, 87) = .033, p = .968] and [MS = .149, F (2, 87) = .194, p = .824]. -1.8 -1.6 -1.4 -1.2 -1 -0.8 -0.6 -0.4 -0.2 0 A B C T he dis ta nce fro m s to p po sit io n t o a st o p lin e : L o (m ) Intersection
young drivers older drivers
S.D.
Elderly drivers Young drivers