Title
Validation by Cardiac Catheterization of Noninvasive Estimation
of Time Constant of Left Ventricular Pressure Decline as an
Index of Relaxation by Speckle Tracking Echocardiography( 本
文(Fulltext) )
Author(s)
吉眞, 孝
Report No.(Doctoral
Degree)
博士(医学) 甲第1102号
Issue Date
2019-03-25
Type
博士論文
Version
ETD
URL
http://hdl.handle.net/20.500.12099/77929
※この資料の著作権は、各資料の著者・学協会・出版社等に帰属します。Validation by Cardiac Catheterization of Noninvasive
Estimation of Time Constant of Left Ventricular
Pressure Decline as an Index of Relaxation by Speckle
Tracking Echocardiography
Takashi Yoshizane, MD
a, Itta Kawamura, MD, PhD
b,*
, Masanori Kawasaki, MD, PhD
c,
Ryuhei Tanaka, MD, PhD
d, Shingo Minatoguchi, MD
c, Maki Nagaya, MSc
a, Hidemaro Sato, MSc
e,
Koji Ono, MD, PhD
a, Shinji Tomita, MD, PhD
b, Hitoshi Matsuo, MD, PhD
b,
Toshiyuki Noda, MD, PhD
a, Takahiko Suzuki, MD, PhD
b, and Shinya Minatoguchi, MD, PhD
cThere has been no established echocardiographic parameter to accurately assess left ventricu-lar (LV) relaxation. Impaired LV relaxation assessed by the time constant of LV pressure decline (Tau) is one of the major components of diastolic dysfunction. We sought to noninvasively es-timate Tau (eTau) by speckle tracking echocardiography (STE) and to validate the eTau against Tau by catheterization. Tau was reported to be calculated using the isovolumic relaxation time (IVRT), LV end-systolic pressure, and left atrial (LA) pressure. We reported that pulmonary capillary wedge pressure (ePCWP) can be noninvasively and accurately estimated as 10.8− 12.4× Log (LA active emptying function/minimum LA volume index). Therefore, the eTau by STE is noninvasively calculated using the formula: eTau= IVRT / (ln 0.9 × systolic blood pressure−ln ePCWP). Echocardiographic parameters were measured just before catheteriza-tion in 110 patients with cardiac disease (age 72± 8). There was a good correlation between the eTau and Tau by catheterization (r= 0.69, p <0.001), whereas IVRT and the e’ had a poor correlation with Tau (r= 0.33 and −0.33, respectively). The sensitivity and specificity of the eTau to predict prolonged Tau (>48 ms) was 77% and 91%, respectively, with area under curve of 0.87 using an optimal cutoff of 48 ms. Bland-Altman analysis revealed a good agreement between the eTau and Tau. In conclusion, this study demonstrated that the eTau by our non-invasive method has a good correlation with Tau obtained by cardiac catheterization. LV relaxation may be noninvasively and accurately estimated by STE. © 2018 Elsevier Inc. All rights reserved. (Am J Cardiol 2018;121:1645–1651)
Heart failure (HF) is a common cause of cardiovascular disease and death, and may occur in the presence of either a normal or abnormal left ventricular (LV) ejection fraction (EF). The prevalence of HF and hypertension (HTN) that is one of the most important risk factors for HF increase with age.1–3
The underlying pathophysiology in HF with preserved EF (HFPEF) involves a predominant abnormality in diastolic function.3,4Impaired relaxation and increased diastolic
stiff-ness are the major components of diastolic dysfunction thought to lead to the elevation of filling pressure.1,3LV relaxation
is impaired at first in diastolic dysfunction and even in the early stage of HTN.5 It is important to evaluate LV
relax-ation represented by the time constant of pressure decline (Tau) and pulmonary capillary wedge pressure (PCWP) in heart disease, especially for the diagnosis and treatment of HFPEF.
Echocardiography has played a central role in the evalua-tion of diastolic funcevalua-tion.6–8However, there has been no
established echocardiographic parameter to accurately and noninvasively assess LV relaxation. A more universally ap-plicable method for the quantification in the routine clinical setting remains to be described and validated. Therefore, the purpose of this study was to noninvasively evaluate Tau by echo (eTau) and to validate the accuracy of eTau against Tau obtained by cardiac catheterization.
Methods
One hundred and eighteen patients with cardiac disease were prospectively enrolled from August 2015 until September 2016. Exclusion criteria in patients were the presence of moderate to severe valvular heart disease, medical history of surgery for struc-tural heart disease, arrhythmia during the examination, and poor echocardiographic window to perform speckle tracking echocardiography (STE) analysis. Echocardiographic study was performed just before the left-sided heart catheterization. The present study was approved by the ethics committee of our in-stitution and all patients gave written informed consent before participation (IRA number 222).
Standard echo-Doppler and 2-dimensional STE examina-tions were performed using a commercially available ultrasound system (iE33, Philips Medical Systems, Andover,
aGifu Prefectural General Medical Center, Gifu, Japan;bGifu Heart Center, Gifu, Japan; cGifu University Graduate School of Medicine, Gifu, Japan;dMurakami Memorial Hospital, Gifu, Japan; andeSawada Hospital, Gifu, Japan. Manuscript received December 6, 2017; revised manuscript re-ceived and accepted February 26, 2018.
See page 1651 for disclosure information. Funding sources: None.
*Corresponding author: Tel:+81 58 277 2277; fax: +81 58 277 3377. E-mail address:[email protected](I. Kawamura). 0002-9149/© 2018 Elsevier Inc. All rights reserved.
https://doi.org/10.1016/j.amjcard.2018.02.061
MA) that was equipped with a broadband (1 to 5 MHz) S5-1 probe. All echocardiographic measurements were made according to criteria of the American Society of Echocardiography.9We examined the following parameters
within 1 hour before catheterization. LVEF was measured by bi-plane modified Simpson’s method. Doppler measure-ments of mitral inflow E-wave and A-wave velocity were obtained, and tissue Doppler measurement of mitral e’ wave
velocity was made at the septal and lateral annulus. The isovolumic relaxation time (IVRT) was measured as the time between the end of LV outflow wave and the beginning of inflow wave by Doppler echo.10,11LV longitudinal strain was
measured from apical 2 and 4 chamber view. All measure-ments were performed 3 times and the average was used for further analysis. After measurements of the standard echocardiographic parameters, a time-LA volume curve was
Figure 1. (A) Time-left atrial volume curve obtained by speckle tracking echocardiography. (B) Left ventricular pressure acquisition by pressure wire catheter.
obtained by STE using QLab software (Philips Medical Systems, Andover, Massachusetts) to evaluate phasic LA volume and LA emptying function (Figure 1) as we previ-ously reported.12To optimize STE, images were obtained at
a frame rate of 70 to 100 frames/s. We previously reported that the estimated PCWP (ePCWP) can be accurately and noninvasively calculated using the kinetics-tracking index (KT index): log10{left atrial (LA) active emptying function/LA
minimum volume index} and that the ePCWP had a strong correlation with PCWP obtained by right heart catheteriza-tion in patients with sinus rhythm.13The ePCWP was calculated
as 10.8− 12.4 × KT index. Tau was reported to be com-puted with the use of the previously validated equation: Tau= IVRT/(ln LV end-systolic pressure−ln LA pressure).14,15
IVRT was noninvasively measured by Doppler echo.10LV
end-systolic pressure can be derived by the following previously validated expression: LV end-systolic pressure= 0.9 x sys-tolic blood pressure16and LA pressure was reported to have
an excellent correlation with PCWP (r= 0.95).17Thus, it may
be possible to combine IVRT with noninvasive estimates of LV end-systolic pressure and LA pressure to calculate Tau. The eTau is noninvasively obtained using systolic blood pres-sure and ePCWP instead of LV end-systolic prespres-sure and PCWP, respectively, as the following formula: eTau= IVRT / (ln 0.9× systolic blood pressure—ln ePCWP). Blood pres-sure was meapres-sured during echocardiography examination. All measurements were performed 3 times and the average was used for further analysis.
Left-sided heart catheterization was performed by a stan-dard approach. Hemodynamic data were collected using a 0.014-inch French pressure wire with a micromanometer at its tip (Certus, St. Jude Medical, Minnesota and Verrata, Volcano, Tokyo, Japan) placed inside a fluid-filled catheter and the wire was connected to a transducer (Meritrans, MeriMedical Systems, UT and Smart Map, Volcano, Tokyo, Japan) as Herberg et al described,18and the pressure
ob-tained by the pressure wire was calibrated against the pressure measured simultaneously with the fluid filled lumen at end-diastole. LV pressure by the pressure wire was recorded at end expiration for 3 consecutive cardiac cycles to obtained Tau (Figure 1) and Tau was derived from a monoexponential fit to the LV pressure decay with a zero asymptote,19because
many clinical studies and the European guidelines for the di-agnosis of HFPEF have used the Tau derived from the zero-asymptote method.20Abnormal LV relaxation was defined as
Tau>48 ms. The pressure measurements were performed by investigators who were unaware of the echocardiographic data. We determined the interobserver variability of the IVRT, the ePCWP, and the eTau estimated by the novel method in 25 randomly selected recordings that were measured by 2 ob-servers using STE in a blinded manner. Likewise, we determined the intraobserver variability of the IVRT, the ePCWP, and the eTau estimated by the novel method in 25 randomly selected recordings that were measured twice by 1 observer. The data are expressed as the mean± 1 standard deviation. The relationships between Tau by catheterization and e’, E velocity, IVRT, longitudinal strain, and eTau were tested by simple linear regression analysis. Multivariate re-gression analysis was performed using stepwise forward selection to identify the independent predictors of Tau. Bland-Altman analysis was used to determine the agreement between
the 2 methods. Receiver operating characteristic curve (ROC) analysis was used to determine the optimal cutoff values and sensitivity and specificity of the echocardiographic param-eters to predict a prolonged Tau (>48 ms). A p-value of <0.05 was considered to be significant. Statistical analyses were per-formed using SPSS statistical software, version 21.0 (IBM Corp., Armonk, New York).
Results
One patient with mitral stenosis, 4 patients with atrial fi-brillation during examination, and 3 patients with poor echocardiographic imaging were excluded. Finally we en-rolled 110 patients including 65 patients with angina pectoris,
Table 1
A. Patients’ characteristics (n= 110). B. Echocardiographic parameters and he-modynamic data
A Valuable
Age (years) 72± 8
Male/Female 82/28
Body surface area (m2) 1.67± 0.19
Heart Rate (beat/min) 67± 12
Systolic blood pressure (mm Hg) 128± 20
Diastolic blood pressure (mm Hg) 70± 13
Angina pectoris 65 (59%)
Prior myocardial infarction 17 (15%)
Hypertensive heart disease 16 (15%)
Congestive heart failure 9 (8%)
Paroxysmal atrial fibrillation 4 (4%)
ARBs and/or ACEIs 52 (47%)
Beta blockers 35 (32%)
Calcium channel blockers 53 (48%)
Diuretics 12 (11%) Statin 68 (62%) Digitalis 1 (1%) Antiplatelet agents 86 (78%) Anticoagulant agents 11 (10%) Antidiabetic agents 43 (39%) B Valuable LV end-diastolic dimension (mm) 45.7± 5.1 LV mass index (g/m2) 101.9± 100.6 LV ejection fraction (%) 62.8± 11.1 e’ (cm/s) 6.0± 2.1 E/e’ 11.7± 4.4
Isovolumic relaxation time (ms) 106.9± 21.4
LV longitudinal strain (%) -20.8± 6.2 ePCWP (mm Hg) 10.2± 3.5 eTau (ms) 43.2± 9.7 Tau (ms) 44.1± 8.3 LV end-diastolic pressure (mm Hg) 11.9± 4.3 Negative dp/dt (mm Hg/ms) 1370± 300
LV= left ventricular; e’ = early diastolic mitral annular velocity; E/e’ = ratio of early diastolic LV inflow velocity (E) to e’; ePCWP= estimated pul-monary capillary wedge pressure obtained by echocardiography; eTau= estimated Tau obtained by echocardiography; negative dp/dt= negative peak instantaneous rate of LV pressure decline; ARB= angiotensin II receptor blocker; ACEI= angiotensin-converting enzyme inhibitor.
1647 Methods/Noninvasive Evaluation of Diastolic Function
17 patients with previous myocardial infarction, 16 patients with hypertensive heart disease, 9 patients with congestive heart failure, and 4 patients with paroxysmal atrial fibrilla-tion. The patients’ clinical characteristics are listed inTable 1A, and echocardiographic and hemodynamic variables are listed
inTable 1B. LVEF in the patients was 63± 11% (range: 41%
to 81%). The e’ and E/e’ in the patients were 6.0± 2.1 (range: 1.1% to 14.3%) and 11.7± 4.4 (range: 1.2% to 29.0%), re-spectively. The eTau estimated by echo was 43± 10 ms (range: 26 to 67 ms). The ePCWP assessed using KT index had a good correlation with LV end-diastolic pressure (r= 0.65, p <0.001). Tau obtained by catheterization was 44± 8 ms (range: 20 to 63 ms). There was a good correlation between the eTau es-timated by STE and Tau obtained by cardiac catheterization (r= 0.693, p <0.001) (Figure 2andTable 2). The results of linear regression analysis to evaluate the relationship between Tau obtained by catheterization and echo parameters are shown
inFigure 2and listed inTable 2. Multiple regression
analy-sis revealed that the eTau was the best independent predictor of Tau measured by catheterization among the various echocardiographic parameters (Table 3). Bland-Altman analy-sis revealed a good agreement between the eTau and Tau with
neither fixed nor proportional bias (Figure 3) and Kappa co-efficient for prolonged Tau and eTau was 0.679 (p<0.001). The accuracy of this eTau was examined in patients with de-pressed EF<50% versus those with normal EF. Thirteen patients had the reduced EF (43.1± 2.7%; range: 41% to 49%), a mean eTau of 48.2± 7.1 ms (range: 32 to 66 ms), and Tau of 47.5± 8.1 ms (range: 36 to 58 ms). Nighty-seven pa-tients had normal EF (65.7± 7.4%; range: 50% to 81%), a mean eTau of 42.9± 8.9 ms (range: 25 to 71 ms), and Tau
Figure 2. Correlations of echocardiographic parameters with Tau obtained by catheterization. e’= early diastolic mitral annular velocity; E/e’ = ratio of early diastolic LV inflow velocity (E) to e’; IVRT= isovolumic relaxation time; L-strain = LV longitudinal strain; eTau = estimated Tau obtained by echocardiography.
Table 2
Correlation between echocardiographic parameters and Tau
R P-value
e’ -0.326 <0.001
E 0.023 0.811
Isovolumic relaxation time 0.326 <0.001
LV longitudinal strain 0.393 <0.001
eTau 0.693 <0.001
e’= early diastolic mitral annular velocity; E’ = early diastolic LV inflow velocity.
of 43.7.± 8.8 ms (range: 20 to 63 ms). Overall, good corre-lations were noted in both groups (EF<50%: r = 0.68; normal EF: r= 0.75; both p <0.001). The ROC curve analysis for pre-dicting prolonged Tau (>48 ms) was shown inFigure 4, and the sensitivity and specificity are listed in Table 4. The intraobserver correlation coefficient and difference in the IVRT, the ePCWP, and the eTau estimated using the novel method were 0.99 and 1.68±1.53, 0.94 and 0.06 ± 0.68, and 0.97 and 0.20± 1.40, respectively. The interobserver correlation coefficient and difference in the IVRT, the ePCWP and the eTau estimated using the novel method were 0.98 and 1.12 ±2.01, 0.86 and −1.64 ±0.70, and 0.98 and −0.24 ± 1.22, respectively.
Discussion
The present study demonstrated that the eTau noninvasively assessed by echocardiography using the formula: IVRT/(ln 0.9× systolic blood pressure−ln ePCWP) had a strong cor-relation with Tau invasively obtained by catheterization in both patients with preserved EF and reduced EF. Among all the ultrasound parameters measured, the multivariate regres-sion analysis revealed that the eTau obtained by echo was the best predictor of Tau. The ROC curve analysis revealed a good sensitivity and specificity of the eTau for predicting pro-longed Tau. The eTau is a useful predictor of LV relaxation and may have utility and value in the routine clinical prac-tice for the diagnosis and treatment in cardiac disease, especially HFPEF.
Impaired LV relaxation and increased diastolic stiffness are the major components of diastolic dysfunction.21 LV
isovolumic relaxation can be quantified by the invasive mea-surement of LV pressure with a high-fidelity micromanometer
catheter and calculation of Tau.19,22However, there has been
no established echocardiographic parameter to noninvasively and accurately assess LV relaxation. Doppler echocardiographic measure and tissue Doppler velocity have been used exten-sively to estimate LV diastolic performance. However, most Doppler parameters derived from such velocity profiles have several limitations.14
Nishimura et al23demonstrated that the estimated Tau using
the Doppler mitral regurgitation signal had a good correla-tion with Tau when a zero asymptote was used. However, only patients with chronic mitral regurgitation were included and the correlation of percentage change of Doppler-derived Tau and that in catheter-derived Tau was poor, which demon-strated that Doppler-derived Tau may not be sufficiently accurate for detecting small changes in Tau.23IVRT is easily
measured by Doppler echocardiography as a direct estima-tion of Tau.24However, IVRT has limited accuracy, given the
confounding influence of preload on it, which opposes the effect of impaired LV relaxation. In the present study, IVRT had a significant but poor correlation with Tau. To over-come this limitation, it is possible to combine IVRT with noninvasive estimates of LV end-systolic pressure and LA pres-sure to derive Tau.14This approach has been validated and
can be used to provide a quantitative estimate of Tau in place of a qualitative assessment of LV relaxation.15,24The e’ that
represents regional tissue velocity was considered a surro-gate maker for Tau6 and has been thought to reflect LV
relaxation.7However, the e’ is affected not only by active
re-laxation but also by elastic recoil and lengthening load.25In
the present study, the e’ had a significant but poor correla-tion with Tau. Likewise, the E-wave that is also affected by loading conditions26had no significant correlation with Tau
in the present study. The STE derived parameters may have a better correlation with LV relaxation than the tissue Doppler-derived parameters.17,27Hayashi et al27demonstrated that the
correlation of peak longitudinal strain was the strongest to predict Tau among the STE derived parameters. However, the correlation coefficient was not so good (r= −0.45, p <0.001)27
and in our study the value was also not so strongly corre-lated with Tau. LV global strain measurement by 2-dimensional STE has several limitations such as out of plane phenom-enon and poor reproducibility.
In contrast, the eTau noninvasively estimated by KT index had a strong correlation with Tau and was an independent pre-dictor of Tau. The degree of accuracy of the eTau would be adequate for the quantification of LV diastolic function. LV relaxation is impaired at first in patients with diastolic dys-function and even in the early stage of HTN and LV
Table 3
Multiple regression analysis among echocardiographic parameters
Model Unstandardized Coefficients Standardized Coefficients T Sig. 95.0% Confidence Interval for B VIF
B Std. Error Beta Lower Bound Upper Bound
Constant 34.193 5.204 6.571 <0.001 23.875 44.511
eTau 0.761 0.082 0.809 9.265 <0.001 0.598 0.924 2.228
L-Strain 0.224 0.091 0.158 2.452 0.016 0.043 0.405 1.221
e’ -0.898 0.267 -0.214 -3.358 0.001 -1.428 -0.368 1.182
IVRT -0.121 0.038 -0.275 -3.196 0.002 -0.196 -0.046 2.161
L-strain= LV longitudinal strain; e’ = early diastolic mitral annular velocity; IVRT = Isovolumic relaxation time; VIF = variance inflation factor.
Figure 3. Bland-Altman analysis to compare Tau measured by catheteriza-tion and eTau estimated by echocardiography.
1649 Methods/Noninvasive Evaluation of Diastolic Function
hypertrophy.28,29Thus, the eTau and the ePCWP may become
a novel and useful index to evaluate LV relaxation and dia-stolic function for the diagnosis and treatment of heart disease, especially HFPEF.
There are several limitations in this study. First, al-though we focused on the noninvasive estimation of the time constant of LV relaxation and showed that there is a good reproducibility in the assessment of the eTau, there are several noninvasive measurements, each with its errors to some extent. Second, the index of LV isovolumic relax-ation cannot be considered an index of “intrinsic” relaxrelax-ation rate unless loading conditions are held constant.22One
prac-tical way to overcome this limitation is to examine the indices of relaxation over a range of loads. The time of onset of active relaxation depends on systolic events such as the duration of contraction.30 Therefore, the rate and
extent of relaxation, in addition to being dependent on ven-tricular load, are also dependent on the duration of systole.30
Thus, a complex interaction between events traditionally considered to occur during systole can affect the measure-ment and interpretation of active relaxation.22Third, none
of our patients had moderate to severe valvular heart disease or acute coronary syndrome, thus, the utility of this method in patients with valvular heart disease or acute coronary syndrome is unknown. In conclusion, this study demon-strated that the eTau by our noninvasive method has a good correlation with Tau by catheterization and that the eTau is a more powerful and useful predictor of LV relaxation than any other ultrasound parameters. The eTau can be noninvasively and accurately estimated by echocardiography and may have utility and value in the routine clinical prac-tice for the diagnosis and treatment in diastolic dysfunction.
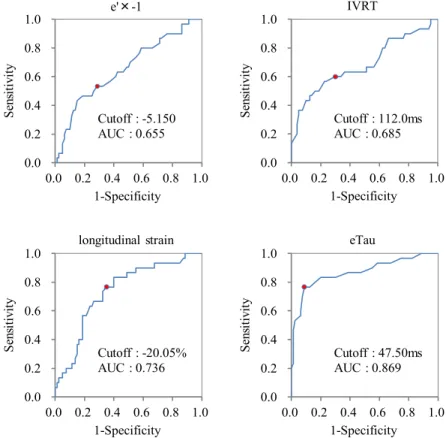
Figure 4. Receiver operating characteristic curves for e’, IVRT, L-strain and eTau to distinguish patients with prolonged Tau obtained by catheterization>48 ms. AUC= area under the curve, e’ = early diastolic mitral annular velocity; IVRT = isovolumic relaxation time; L-strain = LV longitudinal strain; eTau = esti-mated Tau obtained by echocardiography.
Table 4
Sensitivity, specificity, PPV, and NPV of echocardiographic parameters to predict prolonged Tau (>48 ms)
Category AUC P-value Cutoff level Sensitivity Specificity PPV NPV
e’ 0.655 0.013 5.15 53 71 41 80
IVRT (ms) 0.685 0.003 112.00 60 70 43 82
L-Strain (%) 0.736 <0.001 -20.05 77 65 45 88
eTau (ms) 0.869 <0.001 47.50 77 91 77 91
e’= early diastolic mitral annular velocity; IVRT = isovolumic relaxation time; L-strain = LV longitudinal strain; eTau = estimated Tau obtained by echocardiography; AUC= area under the curve; PPV = positive predictive value; NPV = negative predictive value.
Disclosures
The authors have no conflicts of interest to disclose.
1.Jessup M, Brozena S. Heart failure. N Engl J Med 2003;348:2007– 2018.
2.Lloid-Jones DM, Larson MG, Leip EP, Beiser A, D’Agostino RB, Kannel WB, Murabito JM, Vasan RS, Benjamin EJ, Levy D. Lifetime risk for developing congestive heart failure: the Framingham Heart Study.
Cir-culation2002;106:3068–3072.
3.Zile MR, Baicu CF, Gaasch WH. Diastolic heart failure—abnormalities in active relaxation and passive stiffness of the left ventricle. N Engl J
Med2004;350:1953–1959.
4.Gaasch WH, Zile MR. Left ventricular diastolic dysfunction and dia-stolic heart failure. Annu Rev Med 2004;55:373–394.
5.Douglas PS, Tallant B. Hypertrophy, fibrosis and diastolic dysfunction in early canine experimental hypertension. J Am Coll Cardiol 1991;17:530–536.
6.Kato T, Noda A, Izawa H, Nishizawa T, Somura F, Yamada A, Nagata K, Iwase M, Nakao A, Yokota M. Myocardial velocity gradient as a noninvasively determined index of left ventricular diastolic dysfunc-tion in patients with hypertrophic cardiomyopathy. J Am Coll Cardiol 2003;42:278–285.
7.Nagueh SF, Middleton KJ, Kopelen HA, Zoghbi WA, Quinones MA. Doppler tissue imaging: a noninvasive technique for evaluation of left ventricular relaxation and estimation of filling pressures. J Am Coll Cardiol 1997;30:1527–1533.
8.Maurer MS, Spevack D, Burkhoff D, Kronzon I. Diastolic dysfunc-tion: can it be diagnosed by Doppler echocardiography? J Am Coll Cardiol 2004;44:1543–1549.
9.Lang RM, Bierig M, Devereux RB, Flachskampf FA, Foster E, Pellikka PA, Picard MH, Roman MJ, Seward J, Shanewise JS, Solomon SD, Spencer KT, Sutton MS, Stewart WJ. Recommendations for chamber quantification: a report from the American Society of Echocardiography’s guidelines and standard committee and the chamber quantification writing group, developed in conjunction with the European Association of Echocardiography. J Am Soc Echocardiogr 2005;18:1440–1463.
10.Lee CH, Vancheri F, Josen MS, Gibson DG. Discrepancies in the mea-surement of isovolumic relaxation time: a study comparing M mode and Doppler echocardiography. Br Heart J 1990;64:214–218.
11. Thomas JD, Flachskampf FA, Chen C, Guerrero JL, Picard MH, Levine RA, Weyman AE. Isovolumic relaxation time varies predictably with its time constant and aortic and left atrial pressure: implications for the noninvasive evaluation of ventricular relaxation. Am Heart J 1992;124:1305–1313.
12.Hirose T, Kawasaki M, Tanaka R, Ono K, Watanabe T, Iwama M, Noda T, Watanabe S, Takemura G, Minatoguchi S. Left atrial function as-sessed by speckle tracking echocardiography as a predictor of new-onset non-valvular atrial fibrillation: results from a prospective study in 580 adults. Eur Heart J Cardiovasc Imaging 2012;13:243–250.
13.Kawasaki M, Tanaka R, Ono K, Minatoguchi S, Watanabe T, Iwama M, Hirose T, Arai M, Noda T, Watanabe S, Zile MR, Minatoguchi S. A novel ultrasound predictor of pulmonary capillary wedge pressure as-sessed by the combination of left atrial volume and function: a speckle tracking echocardiography study. J Cardiol 2015;66:253–262.
14.Scalia GM, Greenberg NL, McCarthy PM, Tomas JD, Vandervoort PM. Noninvasive assessment of the ventricular relaxation time constant (tau) in humans by Doppler echocardiography. Circulation 1997;95:151– 155.
15. Wang J, Khoury DS, Thohan V, Torre-Amione G, Nagueh SF. Global diastolic strain rate for the assessment of left ventricular relaxation and filling pressures. Circulation 2007;115:1376–1383.
16. Kelly RP, Ting CT, Yang TM, Liu CP, Maughan WL, Chang MS, Kass DA. Effective arterial elastance as index of arterial vascular load inhuman.
Circulation1992;86:513–521.
17. Luchsinger PC, Seipp HW Jr, Patel DJ. Relationship of pulmonary artery-wedge pressure to left atrial pressure in man. Circ Res 1962;11:315– 318.
18. Herberg U, Gatzweiler E, Breuer T, Breuer J. Ventricular pressure-volume loops obtained by 3D real-time echocardiography and mini pressure wire—a feasibility study. Clin Res Cardiol 2013;102:427–438.
19. Weiss JL, Fredericksen JW, Weisfeldt ML. Hemodynamic determi-nants of the time course of fall in canine left ventricular pressure. J Clin
Invest1976;58:83–95.
20. Paulus WJ, Tschöpe C, Sanderson JE, Rusconi C, Flachskampf FA, Rademakers FE, Marino P, Smiseth OA, De Keulenaer G, Leite-Moreira AF, Borbély A, Edes I, Handoko ML, Heymans S, Pezzali N, Pieske B, Dickstein K, Fraser AG, Brutsaert DL. How to diagnose dia-stolic heart failure: a consensus statement on the diagnosis of heart failure with normal left ventricular ejection fraction by the Heart Failure and Echocardiography Associations of the European Society of Cardiol-ogy. Eur Heart J 2007;28:2539–2550.
21. Ohtani T, Mohammed SF, Yamamoto K, Dunlay SM, Weston SA, Sakata Y, Rodeheffer RJ, Roger VL, Redfield MM. Diastolic stiffness as as-sessed by diastolic wall strain is associated with adverse remodeling and poor outcomes in heart failure with preserved ejection fraction. Eur Heart
J2012;33:1742–1749.
22. Zile MR, Brutsaert DL. New concepts in diastolic dysfunction and dia-stolic heart failure: part I diagnosis, prognosis, and measurements of diastolic function. Circulation 2002;105:1387–1393.
23. Nishimura RA, Schwartz RS, Tajik AJ, Holmes DR Jr. Noninvasive mea-surement of rate of left ventricular relaxation by Doppler Echocardiography. Circulation 1993;88:146–155.
24. Nagueh SF, Appleton CP, Gillebert TC, Marino PN, Oh JK, Smiseth OA, Waggoner AD, Flachskampf FA, Pellikka PA, Evangelista MA. Recommendations for the evaluation of left ventricular diastolic function by Echocardiography. J Am Soc Echocardiogr 2009;22:208– 209.
25. Tschope C, Paulus WJ. Doppler echocardiography yields dubious es-timates of left ventricular diastolic pressure. Circulation 2009;120:810– 820.
26. Stoddard MF, Pearson AC, Kern MJ, Ratcliff J, Mrosek DG, Labovitz AJ. Influence of alteration in preload on the pattern of left ventricular diastolic filling as assessed by Doppler echocardiography in humans.
Circulation1989;79:1226–1236.
27. Hayashi T, Yamada S, Iwano H, Nakabashi M, Sakakibara M, Okada K, Murai D, Nishino H, Kusunose K, Watanabe K, Ishizu T, Wakami K, Yamada H, Dohi K, Seo Y, Ohte N, Mikami T, Tsutsui H. Left ven-tricular global strain estimating relaxation and filling pressure. Circ J 2016;80:1163–1170.
28. Eshoo S, Ross DL, Thomas L. Impact of mild hypertension on left atrial size and function. Circ Cardiovasc Imaging 2009;2:93–99.
29. Saeki M, Sato N, Kawasaki M, Tanaka R, Nagaya M, Watanabe T, Ono K, Noda T, Zile MR, Minatoguchi S. Left ventricular layer function in hypertension assessed by myocardial strain rate using novel one-beat real-time three-dimensional speckle tracking echocardiography with high volume rates. Hyperten Res 2015;38:551–559.
30. Brutsaert DL, Sys SU. Diastolic dysfunction in heart failure. J Card Fail 1997;3:225–242.
1651 Methods/Noninvasive Evaluation of Diastolic Function