第 54 卷第 4 期
2019 年 8 月
JOURNAL OF SOUTHWEST JIAOTONG UNIVERSITY
Vol.54 No.4 Aug. 2019
ISSN -0258-2724 DOI:10.35741/issn.0258-2724.54.4.12 Research article
S
IMULATION OF
T
HREE
-P
HASE
S
ALIENT
P
OLE
G
ENERATOR UNDER
O
PERATING
C
ONDITIONS
運行條件下三相凸極發電機的仿真研究
Muayad A. Mukhlifa, Khalid G. Mohammedb, Settar S. Kereama, Sara S. Mahdic aElectrical Engineering Department-Engineering College, University of Anbar, Ramadi, Iraq
[email protected], [email protected]
b
Scientific Affairs Department, University of Diyala, Baquba, Iraq, [email protected]
cElectric Power and Machine Department, University of Bilad Alrafidain, COE, Iraq
Abstract
The three-phase synchronous generators are still the backbone of most electric power plants in the world. Many researchers still study synchronous generators in attempts to improve their performance and reduce losses in iron core, copper windings, friction ball bearings, and moments of inertia due to mass and rotor diameter. One of the important characteristics studied insynchronous generator behavior is the generator’svoltage regulation (VR%). Over the past century, researchers have developed four practical and mathematical methods to determine the value of the combined voltages of synchronous generators. This article describes a new method based on the impedance method, the magneto motive force (MMF) method, and the Potier method. The new method effectiveness evaluation is conducted via calculating the four methods and their application to a synchronous generator. The article also offers practical and theoretical recommendations to improve the results and increase flexibility in changing loads as their power factors change.
Keywords:Experimental Study, Performance Analysis, Three-Phase Synchronous Generator.
摘要: 发明于 20 世纪初,三相同步发电机仍然是世界上大多数发电厂的支柱。许多研究人员仍在研究同步 发电机,试图改善其性能并减少铁芯,铜绕组,摩擦球轴承以及质量和转子直径引起的转动惯量的损失。 在同步发电机行为中研究的重要特性之一是发电机的电压调节(VR%)。在过去的一个世纪里,研究人员 开发了四种实用和数学方法来确定同步发电机组合电压的值。本文介绍了一种基于阻抗法,磁动势(MMF) 法,Potier 法和 ASA 法的新方法。通过计算四种方法及其在同步发电机中的应用,进行了新方法的有效性 评估。本文还提供了实用和理论建议,以改善结果并增加负载变化的灵活性,因为它们的功率因数会发生 变化。 关键词:实验研究,性能分析,三相同步发电机。
I.
I
NTRODUCTIONAsynchronous alternator consists of two main parts: an armature and arotor. The outer part of the stator is comprised of three phase windings that are distributed at an angle of 120 degrees, whereasthe inner rotor consists of many salient or non-salient poles that are spaced relative to the
rotation speed value of the generator [1]. For example, in the case of a two-pole rotor, there is electric flux generated by north-pole which enters the airgap [2]. The crossing flux is divided into two parts; each of these parts hashalf the flux value and flowsto the end of the rotor core. These two fluxes meet on the other side of the rotor
core and completethe magnetic loop inside the armature south pole. In the case of four poles, the flux consists of two opposite poles on the rotor thatenter the rams and the input of the rotor through the air gap. In the case of acylindrical generator, there are no prominent poles, and the rotor appears as a smooth cylinder. In addition, the air gap seems to be symmetrical in shape from all sides. This change appears in the form of the rotor (whether in the presence of prominent poles or not), leading to a significant difference in the alternator’s conduct in the two cases [3].
II.
L
ITERATURER
EVIEWThe present research is focused on the
performance of athree-phase synchronous
generator at 1500 rpm with four poles. The equivalent circuit drawn for the salient-pole generator is shown in Figure 1. This generator requires three tests are shown below:
1. Test of armature resistance. 2. Test of winding impedance. 3. Test of armature reaction.
The only difficult aspectof the tests is determining the value of the armature reaction. The operational methods used to determine the armature reaction are divided into three streams:
1. Synchronous resistance method 2. Magnetomotive force (MMF) method 3. Potiermethod
The first two methods employ open- and
short-circuit tests,whereasmethod
threerequiresaload test with azero power factor.
1) Synchronous Method [2-4]
The test shall be carried out in the following manner:
The generator is turned to rated speed of 1500 rpm.
An ammeter is connected to the output ends of the armature, and the field current is varied until a full load short circuit current (SCC) is achieved; the field current is then recorded.Then, the ammeter is replaced with a voltmeter to measure the open circuit voltage (OCV); the
voltage reading is then recorded. The
synchronous impedance Zs value can be calculated using equation (1).
Zs = OCV
SCC (1)
2) MMF Method
This test yields better results than the synchronous impedance test. The MMF test is done using the following steps:
Step 1:The voltmeter is connected to the alternator terminals at a rated speed. Then, the
field current if1is changed until the voltmeter reads the rated voltages [5].
Step 2: The ammeter is connected to the armature output ends. The field current if2 is changed until the ammeter reads the rated current, record if2.
Step 3:The field currents if1 and if2are summed vectorially according to equation (2).
if = if12 + if22 + if1if2cos 180 − (90 +
θ) 0.5(2)
Step 4: The armature voltage Eo is determined from the no load test voltage using the resultant field current value, which is calculated using equation(3).
S = 3IoVL (3)
3)Potier Test[6]
This method is the latest and most reliable for determining the voltage regulation of the generator. The Potier method is implemented using reactive load Xs at the output end of the armature without consumingany real power (wattles load); therefore, it is called zero-power-factor method. The practicality of using a reactive load is to determine the amount of armature reactivity to be calculated at the full current.
III.
R
ESEARCHM
ETHODSThe total power of the alternator is the apparent power (S); it is measured in volt-amperes(VA), as shown in equation (3). It is composed of two vector components: the first component is called the active power (Po), as given by equation (4) and measured in watts. The second component is called the passive power (Q), as explained by equation (5) and measured in volt-ampere reactives(VARs) [7].
The voltage-generated Eo in the armature windings can be seen in equations (6) and (7); theEo is the directional summation of the voltages generated and delivered to the load (V), the total drop voltages in the armature copper winding resistance Ioand Ra,the voltage drop due to the armature winding reactance Io and XL, plusthe drop induced by the armature reaction Ioand Xa. The value of the armature reaction is mainly affected by variation of the power factor of the load (cos θ). The synchronous reactance Xsis comprised of XL and Xa, indicated by equation (8). The percentage voltage regulation (VR%) is
performance of the generator, as explained by equation (9). Po = 3IoVLcos θ (4) Q = 3IoVLsin θ (5) Eo = V − Io Ra+ jXL − IoXa (6) Eo = V cos θ + IRa 2+ V sin θ + IXs 2 0.5(7) Xs = XL+ Xa (8) VR% = Eo−V V 100 (9)
The current researchcontains a practical analytical study to determine the effects of other variables: the load current, on the armature reaction and the percentage amount of impact by load type [8].
IV.
E
XPERIMENTALR
ESULTSThe set of electric machines beingused to practicallyimplement the present research is composed of two main machines: a direct current permanent magnet motor (DCPM), also called a prime mover, and athree-phase synchronous generator (3PSG). These two machines are mechanically coupled via their shafts to construct a new group called amotor–generator set, as shown in Figure1.
The generator type is EM: 333 0.3A,with a nominal power output 0.3 Kwand a maximum current of 1.17; it has four poles and its synchronous speed (Ns) is 1500 rpm for a frequency systemof 50 Hz [9].
The speed of the prime mover is controlled by the DC voltage source [10]. The control of the voltages generated on the ends of the generator is derived from the method of supplying a control voltage DCV of the 3PSG’s excitation coil.There are three load types: resistive, inductive and capacitive loads should be used.
The practical results obtained by changing loads in the above three cases are as follows. In Table1, the resistive load has been changed from 920 ohm, using one branch. The number of parallel branches, 920/2, 920/3, 920/4, 920/5, and finally,920/6,are doubled value to meet 920, 476, 318, 230, 0.34, 185, and 154 Ω. When the load is increased,the current is also increased. In Tables 2 and 3, the same is true with the inductive and capacitive loads, where the parallel branches are multiplied to change the value of the equivalent inductance and capacitance. It is noted in Tables1,
2, and 3that the measurements include the current (Io), load voltage (V), power factor (cos θ), and active load power (Po).
Figure 1. Motor–generator set. Table 1.
Experimental values of variables Io, V, Eo, Po, and cos θ, using resistive loads at a constant speed of 1500 rpm. Variab
les
Parallel R loads, R is adjustable (Ω)
No 920 476 318 230 185 154 If (A) 0.32 0.32 0.32 0.32 0.32 0.32 0.32 Io(A) 0 0.13 0.26 0.38 0.5 0.67 0.78 V(v) 220 215 214 205 200 196 190 cos θ --- 1 1 1 1 1 1 Po(W) 0 48.4 96.4 135 177 227 257 Table 2.
Experimental values of variables Io, V, Eo, Po, and cos θ, using inductive loads at a constant speed of 1500 rpm. Variable
s
Parallel RL loads, L is adjustable (H) No 1.7 0.85 0.57 0.425 0.34 0.283 If (A) 0.32 0.32 0.32 0.32 0.32 0.32 0.32 Io(A) 0 0.18 0.36 0.43 0.5 0.56 0.61 V(v) 220 210 195 188 179 171 162 cos θ --- 0.83 0.77 0.65 0.55 0.47 0.43 Po (W) 0 54.3 93.6 91 85 78 73.6 Table 3.
Experimental values of variables Io, V, Eo, Po, and cos θ, using capacitive loads at a constant speed of 1500 rpm.
Variables Parallel RC loads, C is adjustable (μF)
No 2.5 5 7.5 10 12.5 If (A) 0.32 0.32 0.32 0.32 0.32 0.32 Io(A) 0 0.17 0.44 0.55 0.68 0.83 V(v) 220 223 231 240 254 261 cos θ --- -0.68 -0.53 -0.46 -0.43 -0.4 Po (W) 0 44.6 93 105 128.6 150
It is concluded that, the case of unity power factor loads, the change of load voltage with the load resistance is almost as constant as in Figure2. In Figure 3, the voltage is decreased from 220V to 175V. The current is 0 to 0.9 ampere. In the case of capacitive load, as in Figure 4, the load voltage variation increases significantly and values higher than the nominal voltage 220 V.
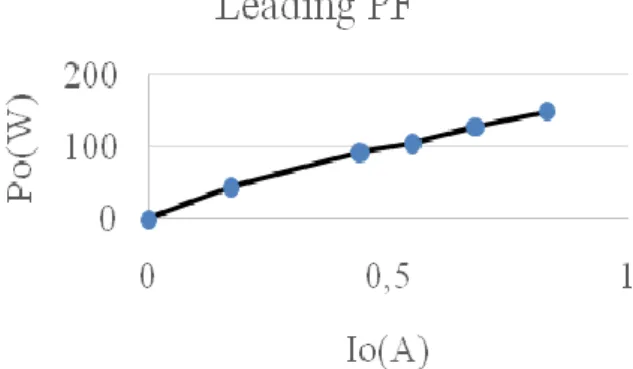
In the case of Figures 5 to 7, the effects ofthe power factor (PF) on resistive, inductive, and capacitive loads are noted by load current, while Figures 8 to 10 show the varying in the output
3PSG Generator DCM
power with theload current, according to equation (4).
Figure2. Relationship between variables V and Io,using different resistive loads.
Figure 3. Relationship between variables Eo and Io, using different indictive loads.
Figure 4. Relationship between variables Eo and Io, using different capacitive loads.
Figure 5. Relationship between variables Unity Power Factor (UPF) and Io, using different resistive loads.
Figure 6. Relationship between variables Lagging Power Factor (LPF) and Io, using different inductive loads.
Figure 7. Relationship between variables Leading Power Factor and Io,using different captative loads.
Figure 8. Relationship between load power and Io, using different resistive loads.
Figure 9. Relationship between Po and Io, using different inductive loads.
Figure 10. Relationship between output power Po and Io, using different capacitive loads.
V.
C
ALCULATIONSANDD
ISCUSSIONTable 4 explains the theoretical results which are calculated from the practical tests. The resistance R varied to give the equivalent resistance values: 920, 476, 318, 230, 185, and 154. The voltage generated in the armature windings Eo has been calculated using the
equation (7).The value of the armature voltage E reveals a relation between the output generated voltage (V) and the voltage drops in three parts: IoRa, IoXL and IoXa. Therefore, the resistive load
means unity power factorwhich remove the armature reaction and losses which means improving the voltage regulation coefficient VR%. The results in Table 5 where the values of the
parallel inductive load RL gradually
changedwhen the equivalent reactance value decreased(1.7, 0.85, 0.57, 0.425, 0.34 and 0.283 H), while the other resistance component still remains constant with value 950Ώ
The lowpower factor (cos θ) resulted inan increase in the drawn current Io, whichincreased the voltage drop in the resistance Io Ra and wire inductance Io XL. Therefore, it is recommended thatthe inductive power factor can be improved by adding capacitive component that means decreasing the inductive effect so finally the power factor willbe improved.
Table 4.
Theoretical values of variables Xa, VR%, current load ratio, and Eo using the experimental results fromTable 1.
Variables Parallel R loads, R is adjustable (Ω) No L 920 476 318 230 185 154 Xa (Ω) 0 176 176 176 176 176 176 V(v), Tab.1. 220 215 214 205 200 196 190 Io (A) Tab1. 0 0.13 0.26 0.38 0.51 0.6 7 0.78 Eo (v) 220 223 238 251 276 313 340 |Eo-V| 0 8 24.3 46.4 75.7 117 150 VR 0 3.7 10.2 18.5 27.5 37 44 Io/Imax 0 11.1 22.2 32.5 43.6 57 67 Table 5.
Theoretical values of variables Xa, VR%, current load ratio, and Eo using the experimental results fromTable 2
Variabl es
Parallel RL loads, L is adjustable (H)
No 1.7 0.85 0.57 0.425 0.34 0.283 Xa (Ω) 0 0 176 176 176 176 176 176 V(v), Tab 2. 220 210 195 188 179 171 162 cos θ, Tab 2. --- 0.83 0.77 0.65 0.55 0.47 0.43 Io (A), Tab2. 0 0.18 0.36 0.43 0.5 0.56 0.61 Eo (v) 220 253 294 319 338.8 355 364 |Eo-V| 0 42.9 99 131 159.8 184 202 VR 0 20.4 51 69.6 89.3 108 125 Io/Imx 0 15.4 31 36.8 42.7 48 52 Table 6.
Theoretical values of variables Xa, VR%, current load ratio, and Eo using the experimental results fromTable 3
Variab les
Parallel RC loads, C is adjustable (μF)
No L 2.5 5 7.5 10 12.5 Xa (Ω) 0 0 176 176 176 176 176 V(v), Tab3. 220 223 231 240 254 261 cos θ, Tab3. --- -0.68 -0.53 -0.46 -0.43 -0.4 Io (A), Tab3. 0 0.17 0.44 0.55 0.68 0.83 Eo (v) 220 188.7 142.4 128.44 128.27 134.8 |Eo-V| 0 34.3 88.6 111.56 125.73 126.2 VR 0 15.38 38.35 46.5 49.2 48.35 Io/Imx 0 14.5 37.6 47 58.11 70.9
VI.
C
ONCLUSIONS ANDS
UGGESTIONS FORP
RACTICALU
SEThe power factor can be improved by re analyzing the effect of varying the power factor of the three load types: Unity, lagging and leading power factors as shown in Table 7.The current and voltage regulation ratios in the Tables 3,4, 5 qnd 6 reveal that the greatest change occur at inductive load. The change in current ratio Io/Imax is 6% and the change in voltage regulation VR% is 20%.In capacitive loads, a 10%change in the ratio between the load current to the rated current varies the voltage regulation by 8%. In the resistive loads, a10% change in the current load ratio caused a change in the voltage regulators of 8–9%, which was close to the capacitive state.
Summary of the Io/Imax% and VR% results for the three load types
Leading PF% Lagging PF% Unity PF%
Io/Imax VR Io/Imax VR Io/Imax VR
14.5 15.38 15.38 20.4 11.11 3.7 37.6 38.35 30.7 50.89 22.22 10.19 47 46.5 36.75 69.6 32.47 18.45 58.11 49.2 42.7 89.26 43.6 27.46 70.9 48.35 47.86 107.5 57.26 37.42 - - 52.13 124.8 67 -