Generation and Relaxation Process of Multiexciton in Colloidal CdTe and CdS Quantum Dots
151
0
0
全文
(2) Chapter 1 ..•••••••••••e•••••e••••••••••e••••••••••••••••e•. eeee"eeeeteee--e-eeeeeee-e-eeeel. Intreduction l.1 Preface. 1.2 Semiconductorquantumdets 1 .2 . l General features of 3D-confined nanomateri als. 1.2.2 ElectronicstructuresofsemiconductorQDs. 1.2.3 CarrierdynamicsofsemiconductorQDs 1.3 Carriermultiplication. 1.4 Augerrecombination 1.4.1 Augerrecombinationinbulksemiconductors. 1.4.2 AugerrecombinationinsemiconductorQDs 1.5 Multiexcitonstates. 1.6 Outlineofthisthesis. Chapter2 ••••••••••••e•e••ee••ee•••••••••••••••••ee••••••••••••••••••••••••••••••••••e••••32. Synthesis of colloidal CdTe QDs and CdS QDs and tkeir eharacteristics 2.1 How to synthesize colloidal QDs: general growth mechanism. 2.1.1 Introduction 2.1.2 General growth mechanism ofcolloidal panicles: "Nucleation". 2.1.3 Generalgrowthmechanismofcolloidalparticles:"Growth". 2.2 SynthesisofcolloidalCdTeQDs 2.2.l n-tetradecylphosphonicacid(TDPA)cappedCdTeQDs a) Synthesis b) Basic information. 2.2.2 thioglycolicacid(TGA)cappedCdTeQDs.
(3) a) Synthesis b) Basic information 2.2.3 oleic acid and trioctylphosphine (OA/TOP) capped CdTe QDs. a) Synthesis b) Basic information. 2.3 SynthesisofcolloidalCdSQDs. 2.3.1 L-giutathione(GSH)cappedQDs a) Synthesis b) Basic information 2.3 .2 myristic acid (MA) capped CdS QDs. a) Synthesis b) Basic information. 2.3.3 OA capped CdS QDs. Chapter 3 ..e.....................e.e....e...e.....................eee.e.......e........e..57. Carrier multiplication in CdTe QDs 3.1 Abstract 3.2 intfoduction. 3.3 Experimental 3.4 Resultsanddiscussion. 3.5 Conclusion. Chapter 4 ••••••e••e••••••••••••e•••••••••••••••••••e•••••••••••ee•••••••••••••••••••••••••67. Effect of capping reagents on Auger recombination in CdTe QDs.
(4) 4.1. Abstract. 4.2. introduction. 4.3. Experimental. 4.4. Results and discussion. 4.5. Conciusion. Chapter 5 e...................•e............e...e.e..e..e..e....eee........................92. Effect of surface defects on Auger reeembination in CdS QDs: Role of. '. surface states •• • • •• '- • 5.1 Abstract 5.2 introduction. '. 5.3 Experimental ••• • • • •• . •. • '•' •/' 5.4 Resultsanddiscussion. '. 5.5 Conclusion. ChaPter 6 .ee....e.e.e...................•.....e......e..............................ee.el08. Multiexciton spectroscepy of CdTe QDs 6.1 Abstract 6.2 Introduction. 6.3 Experimental 6.4 Resultsanddiscussion. '. 6.5 Conclusien.
(5) Chapter 7 •••••eeee•••••••••••••••••••••••••••••••••••••••••••••••••e•••e••••••ee••••••••l23. Effect of Temperature en Auger recombination in CdTe QDs 7.1 Abstract. '. 7.2 Introduction. 7.3 Experimental 7.4 Resultsanddiscussion. 7.5 Conclusion. t.t tt t t t tt .. Acktlowiedgement eeeeeeeeetee-"eeee-"-"ee-teeeeee--eee-eeeeeeeee-"--e"ee-eee"e--eee-142. tt PubliCatiOn liSt .e....e.e..ee......•..........e...........e..e.........................e.144.
(6) Abbreviations. QDs IPCE. Quantum dots Incident photon-to-current conversion efficiency. APCE. Actual absorbed photon-to-current conversion efficiency. Ars. resonant Stokes shift. Ags. global Stokes shift. MEG. Multiple exciton generation. hh. heavy hole. gh. Iight hole. se. split-off hole. Eg. Bandgap. D. diameter. AOD. the differential optical density. <No>. initial average numbers of excitons per QD. TDPA ODE. n-Tetradecylphosphonic acid. Åë. Quantum yields. TGA. Thioglycolic acid. TOP. Trioctylphosphine. OA. Oleic acid. GSH. L-glutathione. MA CM. Myristic acid. QE. Quantum efficiency ofCM. HRTEM EMA. High resolution transmission eleetron microscopy. l -Octadecene. Canier multiplication. effective mass approximation.
(7) Chapter 1 Introduction. 1.
(8) 1.1 Preface. Semiconductor quantum dots (QDs) are nanometer-sized panicles, which show size-dependent optical properties because electron and hole waveftmctions are confined in the. smaller size than the exciton BolMr radius. Although semiconductor nanocrystals have been known as the color matrices of stained glass fer centuries, the systematic study of their physical properties had not been examined until the 20th centuries.i The first investigation of. II-VI semiconductor nanocrystals was published by A. Henglein in 1982.2 This paper revealed the first absorption spectrum ofa colioidal solution of size-quantized CdS nanocrystals. Brus,. Ekimov and Efros groups also independendy gave cerrect interpretations ofthe ebserved blue shift of the absorption as a quantum mechanical effect.3-5 Since then, various kinds of work have been reperted in the preparation and characterization of semiconductor nanocrystals.6-i6. In the late ef 1980, heterostructural-QDs named "corelshell" QDs, whose surface are overcoated by other inorganic materials, have been developed such as Ag2S on CdS,i7 ZnS on. cds,i8 cdse on zns,i9 cdse on znse,20 pbS on CdS.2i A milestone in the preparation of II-VI semiconductor nanocrystals is the work by Murray, Norris and Bawendi in 1993.22 Their synthesis is based on the pyrolysis of organemetallic reagents like dimethylcadmium and torioctylphosphine selenide after injection of Se precursers into a hot coordinating Cd. solvent. This approach provides temporally discrete nucleation and permits a coRtrolied growth of the nanocrystals.23'24 By applying this technique, high quality core/shell QDs were. also developed such as CdS on CdSe25 and vice versa.26 A fine example ef the most careful. characterization of the overgrowth of CdSe QDs with ZnS is reported in the paper ef Dabbousi et al. in 1997.27 In addition to spherical nanocrystals, non-sphertcal nanocrystals such as rod, wire and tetrapod shapes have been developed in the late of 1990.28-33 The crystal. shape are carefu11y controlled by the monomer concentratioR, the crystal structure and the choice ofcapping reagents bacause it strongly depends on the difference in the growth rates at. 2.
(9) each facets.34'35 Until the mid-1990s, semiconductor nanemateriais were synthesized with. highly toxic and dangerous reagents such as organometallic compounds. Peng group has developed safer procedures for the synthesis of high quality II-VI semiconductor QDs by replacing dimethylcadmium to cadmium oxide.36'37 Weller group has developed the synthesis of high quality II-VI semiconductor QDs in aqueous selutions. This procedure is much safer than that with organic solvents and has a potential for the biologicai applications.38N40 In the. late 2000s, more complex heterostructure QDs have been reported such as seeded corelshell. nanorods,4i-43 where a QD is overcoated with nanorod, and alloyed QDs, whose composition gradually changes from the core to the shell.44'45 These complex structures are used to centrol. wave functiens in QDs, QDs consist of smalier atoms as compared with bulk crystals, while the number of atoms in a QD is much 1arger than that of molecules. So to speak, QDs are the intermediate system. between bulk and molecule. QDs have discrete electronic structures like atoms despite semiconductors. Unveiling how optical propenies change from small clusters to bulk crystals is important from the standpoint of an academic interest.. In addition to an academic interest, QDs have various potential applications such as solar cells,4649 laser amplifications,50-52 biological labels53'5S and quantum information.56'57 one striking example is an appiication to solar cells. QDs have large absorption cross sections and. size-tunable absorption features. Besides, canier multiplication (or multiple exciton generation: MEG) is typically observed in QDs, in which muitiple excitons are obtained by. one photen absorption.49'58 While the maximam incident pheton-to-current conversion efficiency (IPCE) in 2010 is 42.4e/o in three-junction cells of bulk semicenductors, the actual. absorbed photon--to-current conversion efficiency (APCE) of solar cells based oR PbS QDs films exceeds 200e/o.59 However, several problems remain on the way to the applications.. Nomradiative Auger recombination, in which multiple carriers recombine nonradiatively in. 3.
(10) several ps to tens of ps time scale, is gready enhanced in nanomaterials and hinder the. effective use of carriers.60 Auger recombinadon has been shown to depend on QD size in several QDs, while the mechanism has not been closeiy investigated. Auger recombination is. a imdamental optical process in QDs and is one of bouleneck for various potential applications of QDs; therefore the detailed understanding of Auger recombination is immediately required.. In the present thesis, the generation and relaxation processes of multiexcitons in. semiconductor QDs are discussed. Multiexcitons can be easily generated in a QD and therefore they are important for not enly a scientific interest but also the application to the. photon-to-current coRversion devices. I expect that this work wi11 help unveiling great phenomena or deveioping a photon-to-cunent cenveTsion system such as solar cells in the near future.. 1.2 Semiconductorquantumdiots(QDs) 1.2.1 Generalfeatures3D-ncenfinednanomaterials Semiconductor quantum dots (QDs) are nm-sized particles whose radius is less than the exciton Bohr radius.i8'6i Bulk semicenducters contain many atoms (-1023 atoms per mol), and thus the electronic structure forms band structures such as valence band and conduction band.. As compared with bulk semiconductors, QDs centain at most 1OO-1O,OOO atoms, and thus, the electronic structure becomes partially discrete (Figure 1.1). In addltion, optical propenies of. QDs depend en the QD size because the smaller size than the exciton Bohr radius difectly affects the spatial canier distribution. In the absence of band-mixing effect, the discrete. electronic structure can be described with two quantum numbers. One, L, determines the angular momentum (symmetry) of an envelope wave function and the other, n, deltotes the. 4.
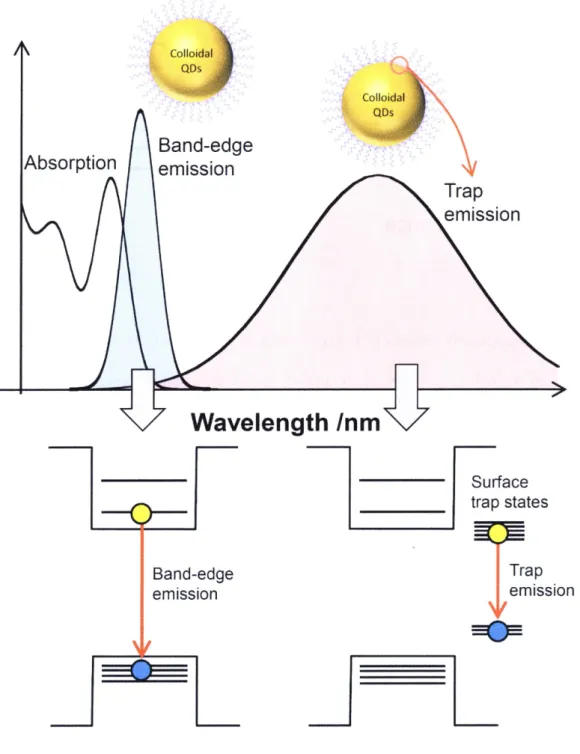
(11) number of the state in the series of states of a given symmetry.62 In the typical notation of QDs quantized states, the momentum indicated by a letter (S for L = O, P for L == l etc.) is preceded by the value of n. The three iowest energy states in the order of increasing energy are IS, IP, and ID.. An important consequence of strong spatial confinement is a significant enhancemeRt of. Coulomb interaction between charge caniers. In the case of bulk semiconductors at room temperatwre, photo-excited carriers are thermally diffused and nonradiative}y recombined because they are spatially separated. On the other hand, in the case of QDs, the strong Coulomb interaction dramatically enhances the probability of the radiative recembinatien as. compared with the bulk materials. As similar to the electron-hole interaction, the exciton-exciton interaction (exciton is an electron-hole pair) is also enhanced in QDs. The strong exciton-exciton interaction resuits in sizable spectral shift of multiexciton emission bar}ds from the single-exciton transition energy. Multiexcitons relax to the single exciton state. in ps to tens ofps mainly through multiexciton Auger recombination.. In addition to characteristics, the optical properties of QDs strongly depend on the QD interface and surface defects because of the 1arge surface to volume ratio as compared with the bulk semiconductors.63-66 in the case of colloidal QDs, capping reagents cover QDs and. effectively passivate dangling bonds at the QD surface. How to immobilize dangling bonds strongly depends on the synthetic method, capping reagents and pH etc. wuen the QD surface. is well passivated, the band-edge emission.is only observed. On the ether hand, when the surface coverage are not suffricient, surface dangling bonds serve as a carrier trap and a broad emissien associated with the trap states is observed at longer wavelength (Figure 1 .2).67'68. Synthetic methods of QDs fali into two approaches, one is top-down approach and the other is bottom-up approach. A bottom-up approach is suitable to synthesize high quality and. uniformly-sized QDs. Bottom-up approach fails into two synthetic methods, one is an. 5.
(12) epitaxial growth on the substrate and the other is colloidal synthesis in an aqueous solution.. Epitaxial QDs on a substrate are suitable for extracting an electric energy, while the equipment is quite iarge-scale and it is not so easy to fabricate uniferm QDs. On the other hand, colloidal QDs are easy to synthesize and much cheaper as compared with the epitaxial growth methods. In addition, the size dispersion of colleidal QDs is around 50/o, that is much. smaller than the epitaxial growth QDs. Problems in colloidal QDs are the extractien of caniers from QDs and the immobilization on the substrate.. 1.2.2 EiectroniestructuresefsemicenduÅëtorQDs The simplified model of QD electronic states shown in Figure 1.1 provides a reasonable description of the QD energy levels (conduction band states) corresponding to the conduction. band of the bulk.62 However, because of the complex multi-subband character of the QD energy levels (valence band states) corresponding to the valence band of the bulk, the confinement-induced mixing between diffefent subbands has to be taken into account. The. valence band state Hamiltonian of QDs consists of both the crystal lauice and QD confmement potentials. For this situation, the true quantum number is the total angular. - ny"- - -. momentum, F :1+Lh, in which 1 and Lh represent the Bloch-ftmction angular momentum and the orbital momentum of the hole envelope function, respectively. The hole. -----•) wavefunction can be expanded using the eigenstates of the orbital momentum Lh, which leads to mixing between different valence subbands. Size-dependent hole energies of CdTe QDs are calculated in references 69 and 70 by taking into accountthe mixing between heavy, light and split-off valence subbbands. Accerding to these calculation, the three lowest energy hole states are IS3f2, IP3/2 and 2S3/2. (Figure 1.lb). Akhough the band--mixing explains the overall structure of QDs absorption spectra, the emission properties of QDs can only be understood by taking into account the fine structure. 6.
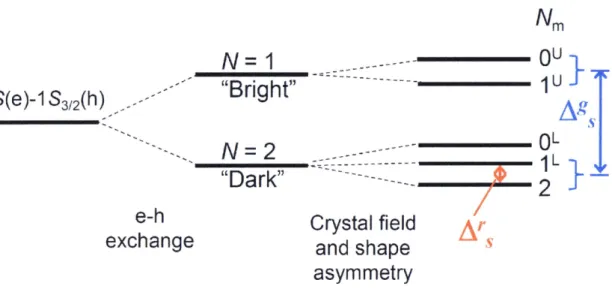
(13) splitting of the band-edge exciton produced by combined effect of strong e-h exchange. interactions and anisotropies associated with the crystal symmetry and QD shape asyrrrmentry.7i'72 The energy of the e-h exchange interaction is proportional to the overlap. between the electron and hole wavefunctions, and therefore it is greatly enhanced in QDs as compared with bulk materials. In the presence of strong e-h exchange, the lowest IS(e) and. IS3i2(h), which are characterized by angttlar momenta 1!2 and 312, cannot be considered independently but sheuld be treated as a combined exchange-correlated exciton with a total angular momentum, N, ofeither 1 or 2. These two states are split by the exchange interaction. forming a high-energy optically active N = 1 "Brighe' exciton and lower•-energy optically passive N= 2 "Dark" exciton. These states are further split into five sublevels because ofthe. anisotropy of the crystal structure and the nonspherical QD shape forming two manifoids of upper (U) and lower (L) five-structure states, which are labeled according to the magnitude ef. the projection of the exciton total angular momentum, IVm, along the unique axis (Figure 1.3).7i'73 The energy between the lewest energy state Nm = 2 (dark) and the higher energy state Nm = IL (bright) is called "resonant" Stokes shift (Ars) aftd can be experimentally measured via size-selective fluorescence-line-narrowing spectroscopy or single-QD emission. excitation spectroscopy. The steady-state band-edge absorption is dominated by the superposition of upper•-manifold strong optical transitions that correspond to the IU and OU. exciton states. On the other hand, the steady-Nstate emission band is dominated by lower-manifold optical transitions which correspond to the 1L and 2 exciton states. The energy. difference between the lowest absomption maximum and the emission peak is called "global" stokes shift (Ags).. 1.2.3. Carrier dynamics Qf semiconductor QDs. 7.
(14) When a bulk semiconductor absorbs a photon whose energy is higher than the bandgap, a hot electron and hole are generated in the semiconductor. Hot carriers in a bulk semiconductef. relax to the band-edge via phonon emissions within 1 ps.74 On the other hand, phonon mediated relaxation ofhot caniers atre highly suppressed in semiconductor QDs because their electronic structures are discrete (the energy separation between the IS(e) and IP(e) ef CdSe QDs is over tenfold of a LO phonon energy). For this reason, the relaxation of hot caniers in. semiconductor QDs was expected to be slow down, which is called "phenon bottleneck".75'76.. However, the rate of the hot canier relaxation was still sub ps time scale, which was inconsistent with phonon bouleneck. In II-VI semicoRductor QDs, there are twe pessible relaxation passways from the IP(e) to the IS(e), Auger cooling and the energy transfer to the vibration states of capping reagents.. Auger ceoling was proposed as a new relaxation passway of hot electrons in II-VI semiconductor QDs by Efros et al. in 1995.77 Auger cooling is a nonradiative decay process whereby a hot electron relaxes to the band-edge IS(e) state by transfening its energy to a hole. (Figure 1.4a). The re-excited hole can undergoes a fast relaxation within 1 ps via phonon. emissions because hole level spacings are an order ef magnitude smaller than those of electrons. This is due to the higher effective mass and the degeneracy of the valence band states. The electron-hole Coulomb interactien becomes stronger in smaller nanomaterials so that the rate of Auger cooling becomes faster in smaller QDs. To examine the Auger cooling. in CdSe QDs experimentally, Klimov et al. examined femtosecond transient absorption experiments with CdSe QDs capped with bipyridine, which is a hole scavenger and thus photoexcited holes in CdSe QDs can be effectively trapped. This experiments showed that the relaxation time from IP(e) to IS(e) increased from -300 fs to 3 ps due to the hoie trapping.78. Hewever, if Auger cooling is a dominant relaxation process the relaxation time should be. 8.
(15) much lenger (over ns scale). This result indicates that other effective relaxation process exists. in addition to Auger cooling.. Another possible effective passway of the IP(e)-IS(e) relaxation is the energy transfer to. the vibrational states of capping reagents (Figure 1.4b). Guyot-Sionnest examined capping-reagent dependence of IP(e)-IS(e) relaxadon in CdSe QDs by pump-probe IR experiments.79'8e They showed that capping reagents also affect the IP(e)-IS(e) relaxation, in. which 27 ps of the relaxation time was observed in 1-dodecanethiol capped CdSe QDs. In addition, they found that IP(e)-IS(e) relaxation time of muitishell CdSe QDs coated with ZnS, ZnSe and CdSe and capped with aikanethiolate was over l ns.8i This slower relaxation time is due to a thick ZnSe shell to separate electrons and holes and to increase the distance of the electronic states from capping reagents.. Above reports show that the relaxation passway of hot caniers occurs via initial multi-phonon emissions to the IP(e) or ID(e) state and subsequent competing process of Auger cooling and the energy transfer to capping reagents to the band-edge. Recently, another. relaxation mechanism was observed in several QDs at high energy excitation, which is called carrier multiplicatioR or multiple exciton generation (MEG).49'58 Canier multiplication is a. process in which multiple excitons are generated at the band-edge by one photon absorption. whose energy is over twice times of bandgap energy. The carrier mukiplication process is much faster than other relaxation passway (less than 50 fs).58 Details are expressed in the next sectlon. `. After hot caniers relax to the band-edge and forni a band-edge excitoR, siRgle exciton. relaxes to the ground state via radiative recombination, ftenradiative recombination or trapping by defect states at the QD surface. Radiative recombination of the IS state at room temperature occurs from the bright state. With the decrease oftemperature, carriers cannot be thermaily excited from the dark state to the bright state and radiative recombination from the. 9.
(16) dark state is also observed, whose iifetime is optically forbidden and hundreds ofns to sub ms time scale.82-84. With the increase of pump intensity, one QD absorbs two or more photons. In this case, a new relaxation passway related to the canier-canier interaction is observed in addition to the single exciton relaxation. A typical relaxation precess of the carrier-carrier interaction is. Auger recombination. Auger recombination in semiconductors is the process that one excited electron interacts with another excited electron in the conduction band states. One interacted. electron reeombines with a hele in valence band states and the other electron is excited at. higher states including ionized states. Auger recombination in semiconductor QDs strengly. depends on the QD size and the lifetime of Auger recombination increases from ps to hundreds of ps with the increase of the size.60 In addition, strong carrier-carrier interaction. aiso induces multiexciton emissions such as biexciton and IP emission.85 Understanding of fundamental properties of Auger recombination and the multiexciton states in semiconductor QDs is important for the application to optical pumping and solar cells. Details are expressed in section 1.4 and 1.5.. 1.3 Carriermultiplication(Multipleexcitongeneration:MEG) In principle, one photon whose energy is higher than the bandgap (Eg) can excite only one electron in semiconductors irrespective of the photon energy. The excited hot electron relaxes. nonradiatively to the band edge via phonon emission and forms a single exciton. Hewever, carrier multiplication can produce two or more band-edge excitons by one photen absorption (Figure 1.5). In bulk semiconductors, carrier mukiplication has been observed repeatedly over. the past five decades, both in elemental semiconductors such as germanium,86 silicon87 and also in lead chalcogenides.88 However, the photon-to-canier efficiency is quite low (at most. IO.
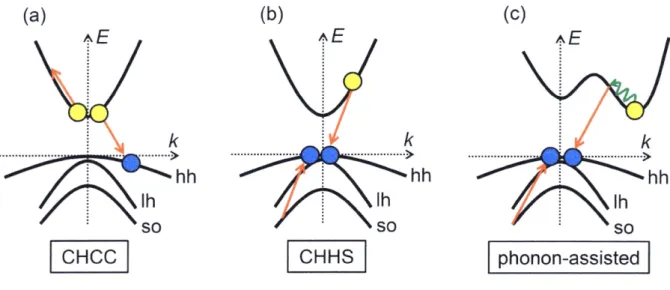
(17) several O/e) and the energy threshold is high (higher than 4 Eg), and thus carrier multiplication. in bulk semiconductors was difficult in practical use. in 20e4, Klimov et al. discovered the efficient carrier multiplication over 2eOe/e in colloidal PbSe QDs.49 After that, efficient carrier. multiplication has been observed in various semiconductor QDs such as cdse,g9 pbs,58 pbTe,90 si,9i InAs,92 inp93 and carbon nanotubes.94 In addition to canier multiplication in solution phase, canier multiplicatien in a conductive fiim of colloidal PbS QDs has been also reported.95"96 Recently, enhanced photoconductivity by carrier multiplicatioR was observed in. conductive rums of colloidal PbS QDs.97'59 Carrier mukipiication in nanomaterials has great potentials for the photen-to-energy conversion systems such as third generation solar cells and the low threshold laser amplification.. 1.4 Augerrecembinatien 1.4.1 Augerrecembinatieninbulksemicenducters Auger recembination in semiconductors is fustly reperted in l940's.98 After the theoretical reports by Beattie and Landsberg in 1959,99 various experimentai and theoretical. studies on Auger recombination in semiconductors have been done.iOO-iiO In buik materials,. carriers have to conserve their energies and translational momenta simultaneously during. Auger recombination because bulk semiconductors have band structures due to their periodicities of crystals structures. They form one electron band and three hole bands named heavy hole (hh), light hole (lh) and split-off hole (so). Because ofthese conservations, Auger. recombination in bulk semiconductors strongly depends on temperature and the energy gap. Several kinds of Auger recombination have been proposed because of the splitting of hole. bands. CHCC and CHHS processes are well-lmown examples ofAuger recombination, where "C", "H" and "S" represent the cenductien band, the heavy hole and the split-off band,. ll.
(18) respectively. In indirect semiconductors, Auger recombination probability is suppressed because of the existence of few energy states conserved for energy and mementum. In the case of the strict conservation, Auger recombination occurs with a participation ef phonons (phonon-assisted Auger recombination, Figure 1.6). Although theoretical calculations predict. that phonon-assisted Auger recembination also occurs in direct-gap semiconductors, it is. difficultto demonstrate experimentally because Auger recombination without phonens in direct-gap semiconductor also strongly depends on temperature.iii•ii2. The kinetics model ef Auger recombination in buik semiconductors can be expressed as three-body process, two electrens and one hole, or one electron and two holes. Thus, the rate Of Auger recombination is written byi07•i iO. dN. dN. -art :-kAR ne2 nh or -art :'kAR ne nft (1.1) where N, ne, nh and kAR are the total carrier density, the electron density, the hole density and. the Auger constant, respectively. In the case of moiecules, the carrier-carrier interaction can. be expressed as two-body process because carriers form excitons, so this process is called the exciton armihiiation. ln the case ofbulk semiconductors, Coulomb interaction is se small that. Auger recombination cannot be expressed as two-body process.. 1.4.2 AugerrecombinatieninsemiconductorQDs In the case of semicenductor QDs, Auger recombination is quite different from that in. bulk semiconductors. The number of atoms per QD decreases and the periodicai effect disappears, which induees the discrete electronic states and the relaxation of the translational. momentum conservations. In addition, Coulomb interaCtion is greatly enhanced in QDs. For these reasons, Auger recombination occurs efficiently without the momentum conservations Figure l.7).60 The theoretical calculation ofAuger recombination in semiconductor QDs is fustly established by Chepic et al. in 1990,ii3 in which the lifetime of Auger ionization. 12.
(19) obtained by theory is compared with the experimental result of glass-doped CdS QDs. The. rate constant of Auger recombination in QDs is given by using Fermi's Golden Rule as below,ii4. '. ,l. :211tLSMij 2i(E, --Ef)dsRf (l.2) where Mif is the electronic transition matrix element of the interparticle Coulomb interaction,. Ei(D is the initial (final) energy of the system, and Rf is the complete set of variables quantifying the fmal state of the system. The theoretical calculation predicts that the lifetime. of Auger recombination has the power-law dependence of the QD diameter (D), DM, where m is the scaling index and varies 5 < m < 7 depending on the band offset. The theoretical calcuiation also predicts that Auger recombination depend on the QD interface. In 2000,. '. Klimov et al. have experimentally demonstrated that the Auger recembinatien lifetime of biexciton, triexciton and tetraexciton depends on D3 in CdSe QDs.60 They also demonstrated. the same size dependence in PbSe, InAs and Ge QDs, so called "Y sealing".ii5 Efros considered that the difference of the scaling index between Auger recombination and Auger ionization cemes from the final state of Auger process.ii6 in Auger recombination, an Auger '. electron transits to a QD state that has finite density of states depending on the QD volume,. while in Auger ienization ittransits to outside of QD which has infimite density of states.. They suggested that different size dependence of Auger recombination in CdSe QDs is due to the size dependence of the density of states, which is proportienal to D3. However, they do not examine detailed analysis and not mention the effect of the QD interface; therefore the detailed the size dependence ofAuger recombination is still unclear.. The rate equation of Auger recombination based on three-body process is only appropriate in bulk semiconductors, where huge number of carriers exists and the experimental result can. be assumed as average events. In the case of QDs, where the number ofcaniers is afew, the. rate analysis sheuld be done stochastically. Barzykin and Tachiya analyzed multiexciton. l3.
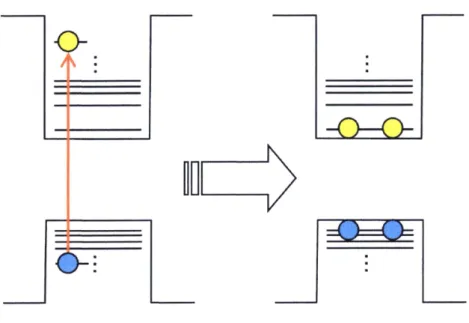
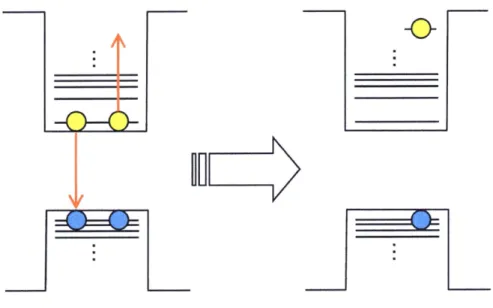
(20) Auger processes in semiconductor QDs and nanowires by stechastic approach.ii7 By using the stochastic model, the average number ofexcitoAs per QD (fi(t)) can be written by. oo. n(t) : 1.il.,Ai exp [--i (h + l (i -- ok.A.) t] (i.3) where ri and kexA are the lifetime of single exciton and the rate constant of Auger recombination, respectively. Coefficients, Ai, can be calculated by fo11owing equation,. co t Ai =: <No>ie-<No>(r+2i -- oil.Ili., <lll/ig>' rr((.r++2ii++j).) (i"4) '. '. where r == 21/rA, 7and rA is the rate constant of lifetime of single exciton and of Auger recombination. <Ne> and r(x) are initial average numbers of excitons per QD and the gamma function, respectively. This calculation of Ai indicates that the ratio of multiexciton can be. determined only by <No>, rand 7A. They calculated the ratio of the rate constant of single exciton, biexciton and triexciton and compared these calculations with the experimental result. obtained by Klimov et al.60 Barzykin and Tachiya concluded that Auger recombination in semiconductor QDs can be expressed with the stochastic two-body process rather than the stochastic three-body process.. l.5 Multiexcitonstates When multiple excitons are generated in a QD additional electronic states are formed, which are called multiexciton states. Multiexcitons efficiently relax via Auger recombination. in ps to hundreds of ps, and therefore muitiexciten states can be observed by time-resolved spectroscopy.85'ii8 In time-resolved emission spectroscopy, with filling the electronic states. with carriers, Auger cooling between IP(e)- IS(e) is suppressed and the emission from IP state can be observed in sub ps to tens of ps time scale (Figure 1.8). The spectral shit of the. 14.
(21) biexciton emission as compared wtth the single exciton emission gives usefu1 information about the biexciton binding energy of QDs. Experimental reports of the biexciton binding energy are mainly for epitaxial QDs such as GaAs and only a few report exist in colloidal. QDs, however these reports of colleidal QDs are almost all for CdSe QDs.ii9-i22 The. biexciton binding energy of bare CdSe QDs ranges from 10 to 35 meV, which is the "attractive" interaction. In the case ofCdSe/CdS core/she}1 QDs, the biexciton binding energy is almost the same or relatively stronger than bare CdSe QDs for Type I configurations, and it suddeniy decreases and becomes "repulsive" interactions for Type II configurations.i22. 1.6 Outlineefthisthesis In this thesis, a general introduction of three dimensional confiined semiconductor QDs and their fundamental optical properties induced by strong Coulomb iRteractions are given in Chapter l. In Chapter 2, after the brief expression of the general growth mechanism and the. synthetic method of colloidal semiconductor QDs, the synthetic procedures of CdTe QDs and. CdS QDs.capped with different materials and their basic information are respectively introduced. In Chapter 3, canier multiplication in CdTe QDs was examined by single photon. timing spectroscopy. From the fast decay component associated wnh Auger recombination, we fustly observed carrier multiplicatlon in CdTe QDs. in Chapter 4, the size-dependent. biexciton Auger recombination of CdTe QDs capped with different organic materials was examined. We observed different size dependence and cencluded that Auger recombinatien in CdTe QDs depends on capping reagents or the thin gradient structure of thioglycolic acid capped CdTe QDs. In order to examine the effect of surface states on Auger recombination more precisely, the size-dependent biexciton Auger recombination was also examined in CdS QDs capped with different organic materials in Chapter 5. The size dependence of CdS QDs. 15.
(22) is very similar irrespective of capping reagents and we concluded that Auger recombination only depeRds on the interfacial electronic structure rather than the surface defects and capping. reagents of one monolayer level. In Chapter 6, the size dependence ef multiexciton states in. CdTe QDs was examined by time•-reselved emission spectroscopy. The biexciton and triexciton binding energy was estimated from the energy shift of the biexciton emission. The. triexciten binding energy of CdTe QDs was larger than the biexciton binding energy, which may come from the polarization nature of the IS and IP state. In Chapter 7, the effect of. temperature on Auger recombination was examined in CdTe QDs, and the origin ef the temperature dependence was discussed. Among several factors of temperature dependence, the participation ofphonons ifi Auger recombination of semiconductor QDs was considered to the most likely possibility ofthe temperature dependence.. 16.
(23) References. '. (1) Gaponenko, S. V. Optical Properties of Semiconductoi Nanocrystals; Cambridge. '. University Press: United Kingdom, l998.. (2) Henglein, A. Ber. Bunsenges. Phys. Chem. 1982, 86, 301. (3) Brus, L. E. J. Chem Phys. 1983, 79, 5566,. (4) Ekimov, Al.; Onushuchenko, A. A. Sov. Phys. -Semiconductors 1982, I6, 775. (5) Efros,' Al.; 'Efros, Al. Sov. Phys, -Semiconductors i982, 16, 772.. '. (6) Rossetti, R.; Nakahara, S.; Brus, L. E. 1. Chem. Phy,s'. 1983, 79, 1086.. (7) Henglein, A.; Gutierrez, M.; Fischer, C. Ber. Bunsenges. Pkys. Chem. 1984, 88, 170.. ' (8) Wel}er, H.; Koch, H.; Gutierrez, M.; Henglein, A.; Ber. Bunsenges. Phys, Chem l984, 88,. '. ' 649.. (9) Ramsden, J. J.; Gratzel, M. Z Chem Soc. Farad. Trans. I 1984, 80, 919. (10) Nezik, A. J.; Williams, F.; Nenadavic, M. T.; Raja, T.; Micic, O. I. J Phys. Chem. 1985,. 89, 397. (1l) Brus, L. E. ,1 Chem Phys. 1984, 80, 44e3.. (12) Brus, L. E. X Phys. Chem 1986, 90, 2555. (l3) Nemeljokvic, J. M.; Nenadavic, M. T.; Micic, O. I.; Nozik, A. J. X Phys. Chem. 1986, 90,. 12. (14) Steigerwald, M. L.; Alivisatos, A.P.; Gibson, J. M.; Harris, T.D.; Kortan, R.; Muller, A.. J.; Thayer, A. M.; Duncan, T. M.; Douglass, D. C.; Brus, L. E. X Am. Chem. Soc. 1988,. 110, 3046. (15) O'Neil, M.; Marohn, J.; McLendon, G. X Phys. Chem 1990, 94, 4356. (16) Hoffman, A. J.; Mills, G.; Yee, H.; Hoffmann, M. R. 1. Phys. Chem. 1992, 96, 5546.. ' ' H.; Fojtik, A.; ' Henglein, (17) Spanhel, L.; Weller, A. Ber. Bunsenges. Phys. Chem. I987, 91,. t ttt. 88.. 17.
(24) (18) Youn, H. -C.; Baral, S.; Fendler, J. H. X Phys. Chem 1988, 92, 6320. (19) Kortan, A. R.; Hull, R.; Opila, R. L.; Bawendi, M. G.; Steigerwa}d, M. L.; Carrol, P. J.l. Brus, L. E. X Am. Chem. Soc. 1990, f12, 1327. (20) Hoener, C. F.; Allan, K. A.; Bard, A. J.; Campion, M. A.; Fox, M. A.; Mallouk, T. E.;. Webber, S. E.; White, J. M. 1. Phys. Chenz 1992, 96, 3812. (21) Zhou, K. S.; Honma, I.; Komiyama, K.; Haus, J. W. X Phys. Chem 1993, 97, 895. (22) Murray, C. B.; Nonis, D. J.; Bawendi, M. G. J. Am. Chem Soc, i993, 115, 8706. (23) Alivisatos, A. P. Science, l996, 271, 933.. (24) Peng, X.; Wickhani, J.; Alivisatos, A. P. X Am Chem Soc. 1998, 120, 5343.. (25) Kuno, M.; Lee, J. K; Dabbousi, B. O.; Mikulec, F. V.; Bawendi, M. G. J. Chem. Phys.. 1997, 106, 9869. (26) Peng, X.; Schlamp, M. C.; Kadavanich, A. V.; Alivisatos, A. P. 1. Am Chem. Soc. 1997,. 100, 8927. (27) Dabbousi, B. O.; Rodriguez-Viejo, J.; Mikulec, F. V.; Heine, J. R.; Matteussi, H.; Ober,. R.; Jensen, K. F.; Bawendi, M. G. X Phys. Chem. B 199Z 10I, 9463. (28) Yu, S. H.; Wu Y. S.; Yang, J.; Han, Z. H.; Xie, Y.; Qian, Y. T.; Liu, X. M. Chem. Mater.. 1998, 10, 23e9. (29) Merales, A. M.; Lieber, C. M. Science 1998, 279, 208.. (30) Li, Y. D.; Liao, }I. W.; Ding, Y.; Fan, Y.; ZhangY.; Qian, Y. T. Inorg. Chem 1999, 38,. 1382. (3l) Duan, X. F.; Liber, C. M.;Adv. Mater. 20eO, i2, 198.. (32) Peng, X.; Manna, L.; Yang, W.; Wickharn, J.; Scher, E.; Kadavanich, A.; Alivisatos, A.. P. Nature, 2eOO, 404, 59. (33) Chen, C. C.; Chao, C. Y.;Lang, Z. H. Chem. Mater. 20eO, 12, 1516. (34) Peng, Z. A.; Peng, X. X Am. Chem Soc. 20el, I23. 1389.. 18.
(25) (35) Rogach, A. L. Semiconductor Nanoerystal euantum Dots: Synthesis, Assmbly, Spectroscopy andApplicatioins; Springer Wien New York, Austria, 2008. (36) Peng, Z. A.; Peng, X. G. J. Am Chem. Soc. 20el, 123, l83. (37) Peng, Z. A.; Peng, X. G. X Am. Chem. Soc. 20e2, 124, 3343.. (38) Rogach, A. L.; Kastsikas, Komowski, A.; Su, D. S.; Eychmullaer, A.; Weller, H. Ber.. Bunsenges, Phys. Chem. 1996, IOO, l772. (39) Gao, M.; Kirstein, S.; Mohwald, H.; Rogach, A. L.; Kornowski, •A.; Eychmuller, A.; Weller, H. J. Phys. Chem. B 1998, Z02, 8360.. (40) Gaponik, N.; Talapin, D. V.; Rogach, A. L.; Shevchenko, E. V.; Kornowski, A.; Eychmuller, A.; Weller, H. X Phys. Chem B 2002, 106, 7177. (41) Talapin, D. V.; Koeppe, R.; Gotzinger, S.; Kornowski, A.; Lupton, J. M.; Rogach, A. L.; Benson, O.; Freedmann, J.; Weller, }I. Nano Lett. 2e03, 3, 1677. (42) Carbone, L.; Nobile, C.; De Giorgi, M.; Sala, F. D.; Morello, G.; Pompa, P.; Hytch, M.; Snoeck, E.; Fiore, A.; Franchini, I. R.; Nadasan, M.; Sivestre, A. F.; Chiodo, L.; Kudera,. S.; Cingolani, R.; Krahne, R.; Manna, L. Nano Lett. 2007, 7, 2942. (43) Sitt, A.; Sala, F. D.; Menagen, G. ; Banin, U. Nano Lett. 2e09, 9, 347e.. (44) Wang, X. Y.; Ren, X. F.; Kahen, K.; Hahn, M. A.; Rajeswaran, M.; Maccagnano-Zacher, S.; Silcox, J.; Cragg, G. E.; Efros, A. L.; Krauss, T. D. Nature, 2e09, 459, 686.. (45) Maikov, G. I.; Vaxenburg, R.; Sashchiuk, A.; Lifshitz, E. ACS Nano, 2010, Il, 6547. (46) Nozik, A. J. Physica E 2002, 14, 1l5. (47) HuynhW. U.; Dittmer, J. J.; Alivisates, A. P. Seience 2002, 295, 2425.. (48) Robel, I.; Subramanian, V.; Kuno, M.; Kamat, P. V. X Am. Chem Soc. 2006, 128, 2385. (49) Schaller, R. D.; Klimev, V. I. Phys. Rev. Lett. 2ee4, 92, l86601.. (50) Klimov, V. I.; MIkhailovsky, A. A.; Xu, S.; Malko, A.; Hollingworth, J. A.; Leatherdale,. C. A.; Eisler, H. J.; Bawendi M. G. Science, 2000. 295, 3l4.. 19.
(26) (51) Schaller, R. D.; Petruska, M. A.; Klimov, V. I. J. Phys. Chem B 20e3, 107, 13765.. (52) Klimov, V. I.; Ivanev, S. A.; Nanda, J.; Achermam}, M.; Bezel, I.; McGuire, J. A.; Piryatinski, A. Nature, 20e7, 447, 441 .. (53) Chan, W. C. W.; Nie, S. M. Science, 1998, 281, 2016. (54) Bruchez, M.; Moronne, M.; Gin, P.; Weiss, S.; Alivisatos, A. P. Science 1998, 281, 2013. (55) Medintz, I. L.; Uyeda, H. Y.; Goidman, E. R.; Mattoussi, H. Nature Mater. 2005, 4, 435.. (56) Chen, G.; Benadeo, N. H.; Steel, D. G.; Gammon, D.; Katzer, D. S.; Park, D.; Sham, L. J.. Science 20ee, 289, 1906. (57) Beveratos, A.; Brouri, R.; Gacoin, T.; Villing, A.; Poizat, J. P.; Grangier, P. Phys. Reu. Lett. 2002, 87, 187901. (58) Ellingson, R J.; Beard, M. C.; Johnson, J. C.; Yu, P. R; Micic, O. I.; Nozik, A. J.; Shavaev, A.; Efiros, A. L. Nano Lett. 20e5, 5, 865. (59) Sambur, J. B.; Novet, T.; Parkinson, B. A. Science 2010, 330, 63.. (60) Klimov, V. I.; Mikhailovski, A. A.; McBranch, D. W.; Leatherdale, C. A.; Bawendi, M.. G. Seience 2eOe, 287, 1011. (61) Klimov, V. I. Ann. Rev Phys. Chem 2eG7, 58, 635. (62) Klimov, V. I. Semiconductor and Metal Nanoparticles; (63) Allan, G.; Delerue, C.; Lannoe, M. Phys. Rev. Lett. 1996, 76, 2961. (64) Chen, W.; Wang, Z. G.; Lin, Z. J.; Lin, L. Y. X AppL Phys. 1997, 82, 3111.. (65) Frantsuzov, P. A.; Marcus, R. A. Phys. Rev, B 20e5, 72, 155321. (66) Jones, M.; Lo, S. S.; Scholes, G. D. 1. Phys. Chem C 2e09, 113, 18632. (67) Hasselbarth, A.; Eychmuller, A.; Weller, H. Chem. Phys. Lett. 1993, 203. 271 .. (68) Spanhel, L.; Hasse, M.; Weller, H.; Henglein, A. X Am. Chem Soc. 1987, 109, 5649. (69) Efros, Al. L.; Rosen, M. Phys. Rev. B 1998, 58, 712e. (70) Prado, S. J.; Trallere-Giner, C.; Alcalde, A. M.; Lopez-Richard, V.; Marques, G. E. Phys.. 20.
(27) Rev. B 2ee3, 6& 235327. (71) Nirmal, M.; Nonis, D. J.; Kuno, M.; Bawendi, M. G.; A. L. Efros,; Rosen, M. Pdys. Rev.. Lett. 1995, 75, 3728. (72) Efros, A. L.; Rosen, M.; Kuno, M.; Nirmal, M.; Nonis, D. J.; Bawendi, M. G. Phys. Rev.. B l996, 54, 4843. (73) Norris, D. J.; Sacra, A.; Murray, C. B.; Bawendi, M. G. Phys. Rev. Lett. 1994, 72, 2612.. (74) Conwell, E. High Field Transport in Semiconductors; Academic, New York, i967. (75) Bockelmarm, U.; Bastard, G. Phys. Rev. B 199e, 42, 8947.. (76) Benisty, H.; Sotomayor-Torres, C. M.; Weisbuch, C. Phys. Rev. B 1991, 44, 10945. (77) Efros, A. L.; Kharchenko, V. A.; Rosen, M. Solid State Commun. 1995, 93, 281.. (78) Klimov, V. I.; Mikhailovski, A. A.; McBranch, D. W.; Leatherdale, C. A.; Bawendi, M.. G. Phys. Rev. B 200e, 6I, 13349. (79) Guyot-Sionnest, P.; Shim, H.; Matranga, C.; Hines, M. Phys. Rev. B 1999, 60, R2181.. (80) Guyot-Siennest, P.; Wehrenberg, B.; Yu, D. X Chem Phys. 2e05, 123, 074709. (81) Pandey, A.; Guyot-Sionnest, P.; Science 2008, 322, 929.. (82) Klimov, V. I. J Phys. Chem. B 2006, 110, 16827. (83) OroR, D.; Aharoni, A.; Donega, C. M.; Rijssel, J.; Meljerink, A.; Banin, U. Phys. Rev.. Lett. 2ee9, 102, 177402. (84) Califano, M.; Franceschetti, A.; Zunger, A. Nano Lett. 2e05, 5, 2360.. (85) Achermann, M.; Hollingswomb, J. A.; Klimov V. I. Phys. Rev. B 2003, 68, 245302. (86) Tauc, J. J. Phys. Chem Solids 1959, 8, 219.. (87) Kolodinski, S.; Werner, H.; Wittchen, T.; Queisser, H. J. Appl. Phys. Lett. 1993, 63,. 2405. (88) Baryshev, N. S.; Shchetinin, M. P.; Chashchin, S. P.; Kharionovski, Y. S.; Averyanov, IS.. Sov. Phys. Semicond. 1974, 8, 194.. 21.
(28) (89) Schailer, R. D.; Petruska, M. A.; Klimov, V. I. Appl. Phys. Lett. 2005, 87, 253102.. (90) Murphys, J. E.; Beard, M. C.; Norman, A. G.; Ahrenkiel, S.P.; Johnson, J C.; Yu, P. R.; Micic, O. I.; Ellingson, R. J.; Nozik, A. J. J. Am Chem Soc. 20e6, I28, 3241.. (9i) Beard, M. C.; Knutsen, K. P.; Yu, P. R.; Luther J. M.; Song, Q.; Metzger, W. K.; Ellingson, R. J.; Nozik, A. J. Nano Lett. 2e07, 7, 2506. (92) Sehallaer, R. D.; Pietryga, J. M.; Klimov, V. I. Nano Lett. 2007, 7, 3469.. (93) Stubbs, S. K.; Hardman, S. J. O.; Graham, D. M.; Spencer, B. F.; Flavell, W. R.; Glavery, P.; Masala, O.; Pickett, N. L.; Binks, B. J. Phys, Rev. B 201g, 81, 081303.. (94) Ueda, A.; Matsuda, K.; Kanemitsu, Y. Appl. Phys. Lett. 2e08, 92, 233105.. (95) Beard, M. C.; Midgett, A.G.; Law, M.; Semonin, O. E.; Ellingson, R. J.; Nozik, A. J. Nano Lett. 20e9, 9, 836. (96) Luther, J. M.; Beard, M. C.; Song, Q.; Law, M.; Ellingson, R. J.; Nozik, A. J. Nano Lett.. 2007, 7, 1779. (97) Sukhovatkin, V.; Hinds, S.; Brzozowski, L.; Srgent, E. H. Science 20e9, 324, 542.. (98) Landsberg, P. T. Recombination in Semiconductors; Cambridge University. Cambridge, 1991. (99) Beattie, A. R.; Landsberg, P. T. Proc. R. Soc. Lond. A 1959, 249, 16.. (10e) Landsberg, P. T.; Rhys-Roberts, C.; Lal, P. Proc. Phys. Soc. 1964, 84, 915. (101) Hill, D. Proc. R. Soc. Lond. A 1976, 347, 565.. (102) Emtage, P. R. J Appl. Pbys. 1976, 47, 2565.. (103) Haug, A. Solid State Commun. 1977, 22, 537.. (104) Haug, A. Solid State Commun 1978, 28, 291. (I05) Lochmann, W. Phys. StaL Sol. (a) 1978, 45, 423. (106) Dutta, N. K.; Nelson, R. J. Appl. Phys. Lett. 1981, 38, 407.. 22. Press,.
(29) (I07) Sermage, B.; Heritage, J. P.; Dutta, N. K. X AppL Phys. 1985, 57, 5443.. (108) Haug, A. X Phys. C: SolidState Phys. 1987, 20, 1293. (109) Jiang, Y.; Teich, M. C.; Wang, W. I.; Meyer, J. R. J. Appl. Phys. 1992, 7I, 3394.. (110) Klann, R.; I{ofer, T.; Buhleier, R.; Elsaesser, T.; Tomm, J. W. X Appl. Phys. 1995, 77,. 277. (l11) Takeshima, M. Jpn. J. Appl. Phys. 1983, 22, 491. (112) Nee, T. ---E.; Chen, C. -C.; Lin, R. -M. Jpn. 1. Appl. Phys. 2004, 43, 890.. (113) Chepic, D. I.; Efros, A. L.; Ekimov, A. I.; Vanov, M. G.; Kharchenko, V. A.; Kudriavtsev, I. A.; Yazeva, T. V. J. Lumin. 1990, 47, 113. (114) Cragg, G. E.; Efiros, A. L. Nano Lett. 2egO, IO, 313.. (115) Robel, I.; Gresback, R.; Kortshagen, U.; Scaller, R. D.; Klimov, V. I. Phys. Rev. Lett.. 2e09, IO2, l774e4. (1 16) Efros, A. L.; Lockweod, D. J.; Tsybeskov, L. Semiconductor Nanocrystals: From Basic. to Princi les to Applications; Plenum, New York, 200e. (117) Barzykin, A. V.; Tachiya, M. J. Phys.: Condens. Mattei 2007, i9, 065105. (l18) Caruge, J. M.; Chan Y. T.; Sundar, V.; Eisler, H. J.; Bawendi, M. G. Pbys. Rev. B 20e4,. 70, 085316. (119) Bonati, C.; MohamedM. B.; Tomi, D.; Zgrablic, G.; Haacke, S.; van Mourik, F.; Chergui, M. Phys. Rev. B 2ee5, 7f, 205317. (120) Oron, O.; Kazes, M.; Shweky, I.; Banin, U. Phys. Rev. B 2006, 74, 1i5333. (121) Oron, O.; Kazes, M.; Banin, U. Pkys. Rev. B 2007, 75, 035330. (122) Sitt, A.; Della, S. F.; Menagen, G.; Banin, U. Nano Lett. 2e09, 9, 3470.. 23.
(30) (b). (a) 1D(e). 1 D(e). 1P(e). 1 P(e). 1S(e). '. >. 1 S(e). sor... (QDs). andgap. Åë. =. -. (bulk) 1S(h). 1 S,,2 (h). 1 1P(h). 2S,,,<h). 1D(h). Bulk. iS,/2 (h). QDs. Figure 1.1 (a) Illustration of bulk semiconductors and semiconductor QDs and their energy. diagrams. (b) Illustration of energy states by the combination of the total angular. momentum.. 24. 1 P,,, (h). 1Pw2 (h).
(31) •e,. ..,. Colloidal ;.its ,, QDs ,,. i,L•/i.,..,, C0. 61/jsdal,.. t/ttt;ttt ny ttt ''ej' r"ec'.,/ "i' '' = '". Absorption. Band-edge emlsslon. Trap emlsslon. Wave1ength/nm Surface trap states. Trap emlsslon. Band-edge emlsslon. -1!:::. Figure 1.2 Steady-state absorption spectrum of semiconductor QDs and their emission spectra from the band-edge and surface trap states.. 25.
(32) Nm "l. 1 S(e)-1 S3,,(h). '". 9U}. N=1 "/-----W'riht"'`:--------.----. Ag,. i"-t SS 5g. Ns. OL iL}--.,. Nx N=2 -...-"'""""'---"-.-.-. -- ..--- -- ` -- ---"Dark". - '- "- -- '` '- - .b --.. e-h. Crystal field. exchange. and shape. Ar s. asymmetry. Figure 1.3 Schematic illustration ofthe fine-structure splitting ofthe band-edge IS(e)-IS3i2(h). transition in QDs induced by electron-hole (e-h) interaction, crystal field and shape. asymmetry.. 26.
(33) lg[.el W am. O EIectron eHole. -t.. oe. Auger cooling Energy transfer to the ligand vibrations. Figure 1.4 Energy relaxation ofhot electrons between IS(e)-11D(e) via Auger cooling (a) and the energy transfer to the ligand vibrations (b).. 27.
(34) E. e... '. l. s/. Figure 1.5 Concept of canier multiplication. In canier multiplication process,. pairs can be generated by one photon absorption whose energy is over twice energy gap.. 28. multiple e-h. time of the.
(35) (c). (b). (a). AE. AE. lk. -t-"t----)---t--tit-t -el -Itt----t->. i hh i lh ' so [iEiel [/. 4E. ik. k. -----NI---tt-IE-t--t- -------t-------t-->. -t----1-t-------l-. l hh. hh. i• lh. ' so [gifis. Ih. so phonon-assisted. Figure 1.6 Examples of Auger recombination in bulk semiconductors. (a) and (b) are CHCC. and CHHS Auger recombination in direct-gap semiconductors. "C", "H" and "S" represent. "Conduction band", "Heavy hole band" and "split-off band", respectively. (c) is phonon-assisted Auger recombination in indirect-gap semiconductors. A green winding arrow represents phonon processes.. 29. >.
(36) •-. I. i. gll. :.. : .. Figure 1.7 Concept ofAuger recombination in semiconductor QDs.. 30. <1>.
(37) Single exciton. Emission Biexciton. Emission. 1 P emission. Energy. Figure 1.8 Typical multiexciton emission spectra of semiconductor QDs obtained from time-resolved and intensity-dependent emission spectroscopy. The emission from the IP state can be observed in the presence oftriexciton.. 31.
(38) Chapter 2 Synthesis of colloidall CdTe QDs. and CdS QDs and their characteristics. 32.
(39) 2.1 How to synthesize colloidal QDs: general growth mechanism. 2.1.1 lntroduction Tunability of various physical and chemical properties of materials by varying the size in. the region of nanometer has opened up many new' directions in several fields of current research and modern technologies. In particular, the study of systematic changes in the electronic structure of QDs as a function of size has intensively been investigated in recent times. One ofthe major aspects necessary for the actual realization oftechnical applications is the ability to synthesize nanocrystals of the required size vvTith a controlled size distribution.. Although there is a popular belief that the grovvth of nanocrystals in solutioR occurs via diffusion limited Ostwald ripening process, the optimal condition is the main difficulty of these methods and. therefore. they are arrived at essentially in an empirical and intuitive. manner. The general grovvlh mechanism of colloidal particles has been reported in 1950's by La Mer and coworkers.i'2' They studied extensively nucleation and growth in sulfur sols, from. which they developed an understanding of the mechanism for the formation of colloids or nanocrystals from a homogeneous and super saturated medium. Their mechanism suggest that a synthesis o{' the colloid should be designed in such a way that 1) the concentration increases rapidly. 2) the concentration rises above the saturation for a brief period and 3) a short burst. of nucleation occurs with the 'formation of a large number of nuclei in a short space of time.. These particles grow rapidly and lower the concentration below the nuclei level, and then particles further grow at a rate determined by the slowest step in the grovvth process. La Mer"s. mechanism is schematicaliy depicted by means of the simple diagram shown in Figure 2.1. In this way, the growth mechanism ofcolloidal partic}es is divided into two parts: the nucleation. event in which particles spontaneously t'orm through an assembly of freely dispersed atoms and the actual growth process. We regard spherical QDs as model system.3. 33.
(40) IR this chapter, the introductioR and the general growth mechanism are given in 2.1. Synthetic methods ofcolloidal CdTe and CdS QDs are introduced in 2.2 and 2.3, respectively.. 2.1.2 Generalgrovvthmechanismofcelleidalparticles:"Nucleation"4 The fust step iR the growth of colloidal QDs is the nt}cleation. Through a densi{y. fluctuation of the medium several atoms assemble to a small crystal that is thermodynamically stable and thus does not decay to free atoms or ions. In that sense. the nucleation can be understood as the overcoming the activation banier between the crystalline phase and the solution phase, in vvJhich the atoms are dispersed fi'eely. At the simplest. the driving forces in the nucleation event can be re' duced two factors, the chemical potential in the. system and the total surface energy. UpoR the formation ofa spherica} nucleus consisting ofn atoms the total free energy ofthe system changes by. AG=n(iz,-gtt,)+4TtT2o (2.1) where ,ttc and ,us are the chemical potentials ofcrystal and the solution phase respectively, r is. the radius of the nucleus and ff the surface tensioR. In the equation, the surface terni constitt}tes the main difference between QDs and bulk crysta}s, which is important in QDs whereas it can be neglected in bulk cr>fstals. In the equation, ais assumed to be constant for. any size and morphology of the crystal. Although it is very rough approximation, it is good for the qualitatiiv'ely understanding. In order to understand more precise}y. we have {o take into account an effect related to the small size ofQDs and an effect ofthe faceting ofQDs.. 2.1.3 Generalgrowthmechanismofcolloidalparticles:"Growth" The actual procesg. ofthe deposjtion ofmonomers onto the growing QDs can be split into tvvfo steps. First the monomers have to be transported tovv'ard the surface ofthe QDs and in the. second process thev. have to react with the QDs. When the concentration ofmonomers is high,. 34.
(41) the growth rate depends only on the reaction rate of the monomer with the nuclei because rnonomers are available whenever there is a free site for QD incorporation into a growing crystal. T. he grovvth rate <dr/dt, r represent a crystal radius) is described by. g+/ == ,..L,. (gt') (2.2) vv'here dm denotes the density ofmonomers in the crystal and dn/dt is the derivative ef number ofmonomers in the crystal solved for the grovv•th.. After a while reservoir of monomers is partially depleted and grovvlh rate is dictated by. the rate at which monomers reach the surface of the crystal. The follovv'ing process can be understood by diff'usion--controlled process. which is expressed by Fick's lavv' ofdiffusion:. dC. 1(x>r) == 4rrx2D as.T (2.3) vvihere J is the fiux of monomers towards a growing crystal and C is the concentration of monomers. By introducing the monomer concentration (", on the surface ofthe crystal and the monomer concentratioR ('b in the bulk ofthe solution. the rate ofthe growth can be calculated as follows,. dr D. Zfft :rd.(Cb -"- Ci) (2•4) To this point an infinite stability of the nanocrystals is assumed. However, this assumption. cannot be maintained. In order to express a competing effect to the grovv'th, the Gibbs--Thompson effect should be introduced.5 According to this effect, the smaller the crystal. is the higher the vapor pressure ofthe crystals is. and thus monomers evaporate into solution. more easily from smaller crystals thaB from larger ones. By using this efi'ect, the diffusion-controlled growth rate can be calculated as follows,6'7. [l+/ =ZG,,2C,;;(ilk.T. ---- ;) (2.s). 35.
(42) where C., is the vapor pressurex' ofa fiat surface, r is the critical size of the grovvth process. * regime around r =: r . the smallest QDs melt to free and kB is the Boltzmann coBstaRt. In the monomers that are incorporated into the larger QDs, which is called Ostwald ripening regime.. 2.2 SynthesisofcolloidalCdTeQDs 2.2.1 n-tetradec.viphosphonic acid (TDPA) capped QDs a) S. ynthesis. n-'l"etradecylphosphonic acid (TDPA; 980/o) vv'as purchased from Alfa Aesar. I-Octadecene (ODE; 90.00/e) was obtained from Vviako Pure Chemical Industries. Ltd. Telluriuirn (Te; 99.9990/o) and cadmium oxide (CdO, 990/o) vv'ere purchased from Kojundo. Chemical Laboratory and Kanto Chemical Co. respectively. n-Hexane. ch}oroform and methanoi vv'ere special grade from Kishida Chemical. Co. Inc.. TDPA-capped CdTe QDs were prepared by high temperature colloidal methods in organic solvents reported in the literature.8 Briefly, a mixture of CdO (O.0256 g. O.20 mmol). TDPA. (O.Ol14 g, O.41 mmol). and technological-grade ODE (8.0 gl vv"as heated to 300 OC to get a. clear solutioA. A 4-g solu{ion of Te (O.050 g.. O.4 mmol, dissolved in O.95 g of TBP aRd diluted by 3.0 g of ODE) was quickly injected into this hot solution, and then the reaction. mixture was allowred to cool to 2• 50 OC for the gro"lh of CdTe naBocrystals. Aliquets of growing C'dTe QDs at high temperature were taken out at di'fferent reaction times, mixed with. n-hex, ane and stored under nitrogen. The synthesis was carried out under nitregen with a glove box. UBreacted cadmium precursors vviere separated by the extraction methed.ii After. the extraction. hexane/ODE phase containing QDs was precipitated wTith acetone. The precipitate was isolated by ce.ntrifugatien and decantation. The final product was redissolved in hexane for carrier multiplication experiments.. 36.
(43) b) Basic informatien Fis,ure 2.3 shows steady-state absorption and emission spectra of TDPA capped CdTe QDs. A sharp peak at the band-edge and two shoulders are observed in absorption spectra. which are attributed to IS3,t:(h)--IS(e). 2S3/2(h)-IS(e) and IP3,,f2(h)-l,P(e). respectively.9 IR. emission spectra, almost all spectral shapes are expressed as a single Gaussian function attributed to the band-edge emission, although a few spectra have a small shoulder at the shorter waveiength ofthe band-edge emission. It disappears after {he extractior}. Averagye QD. diameters (D, nm) are calculated from the IS(e)-IS3f2 (h) absorption peak obtained from the experimental fitting function.g. D = (9.827 Å~ 10-7)A3 - (1.7147 Å~ 10-3)A2 -- (1.0064)A- 194.84 (2.6) where 7. is the band-edge absorption peak (nm). Il]he energ>' gap (E,.l was calculated from the. exploration ofthe band offset. D and E. of TDPA capped CdTe QDs were 3.6-5.4 nm and l.93•-1.73 eV, respectively. The luminescence quantum yields ((P) of TDPA capped CdTe QDs were deteriniRed at room temperature by comparing the integrated emission spectrum of the CdTe QDs iR solution to the emission spectrum of rhodamine B in ehanol aRd "rere less than 100/e in all samples. These samples were used tbr carrier multiplication experiments in Chapter 3.. 2.2.2 Thioglycelicacid(TGA)cappedCdTeQDs a) S>•rnthesis. Cadmium perchlorate hexahydrate [Cd(CI04)2 •6H20] and aluminum telluride (A12Te3). lumps were purchased frorn Strem Chemicais and MP Biomedicals lnc., respectiveiy.. Thioglycolic acid (TGA) were purchased from Aldrich Chemical Ce. The water used throughout this research vv'as obtained from Milli-Q water purification system (Yamato, Millipore WQ 500). All chemicals were used without further purification.. 37.
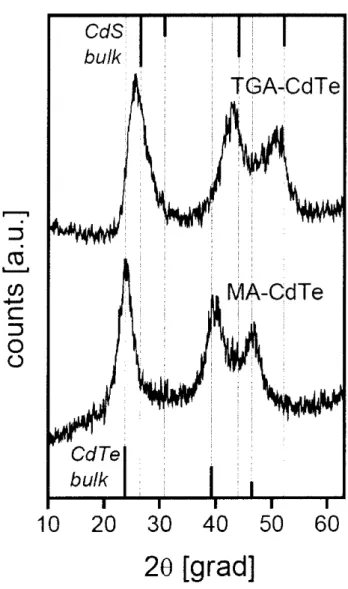
(44) Water-soluble CdTe QDs capped with TGA were prepared according to the procedure reported in the Iiterature.)C)'i2 ln a typical synthesis 2.6 mmol Cd(CI04)2 '6H20 was dissolved. in 200 mL vvrater and 3.4 mmol TGA was added follovv'ed by adjusting pH = IO.O with l M. NaOH solution under vigorous stining, The solution was continuously stirred until the solution became optically clear. Separately l.2 mmol Al2Te3 chunks was placed in a 50 mL three-neck fiask. 20 mL of l M H2S04 solution vv'as added dropwise into the Al2Te3 chunks to. produce H2Te gas, and the gas passed through the previous resulting mixture with a slow N2. flow for 20 rnin. The CdTe precursors are formed at this stage, which is accompanied by yellow color. The molar ratio ofCd2": TGA: Te2- was fixed at l:1.3:O.47. The size ofthe QDs was controlled by the refiux time and was monitored by absorptien and luminescence spectra.. b) Basic informatien. We observed steady-state absorption and emission spectra of TGA-capped CdTe QDs. Figure .7-.4 shows that both absorption and emission spectra are broader in TGA-capped CdTe. QDs as compared vvTith TDPA-capped CdTe QDs, and thus 2S3,t2(h)-IS(e) and ll'r,,•2(h)-IP(e). peak were difficult to resolve in absorption spectra. Average QD diameters of TGA-capped CdTe QDs vvJere determined from the IS3,,•2(h)-IS(e) peak which is calculated by the tight binding model.i3 The previous method for the determination of D in the last section cannot be. applied because the empirical equation can only apply to relatively lager QDs (ever 550 nm. of absorption peak). Calculated D was 2.3 to 3.5 nm. Besides, other researcher conducted. X-ray diffraction measurements of TGA-capped CdTe QDs and concluded that some cubic CdS compoRents are iflcluded in cubic CdTe QDs due to the prolenged reflux in the presence of TGA (Figure 2.5).i4 These results suggest that thin CdS gradients are a}so formed at the. surface of CdTe QDs capped with TGA in our experimen{s. (b of TDPA-capped CdTe QDs were deterniined at room temperature by comparing the integrated emission spectra of the CdTe QDs in solutioR to the emission spectra of rhodamine B or coumarin343 in ehanol. Åë. 38.
(45) increased gradually with the increase of the reflux time, and then decreased. Åë ranged from. -IO to 400/e depending on the reflux time, the ratio of Cd and TGA, and pH of the solution.}5'i6 These samples were used for size- and capping reagent-dependent Auger recombination experiments in Chapter 4.. 2.2.3 Oleicacidandtrioctylphosphine(OAITOP)cappedCdTeQDs a) Synthesis. Trioctylphosphine (TOP) aRd oleic acid (OA) vv'ere purchased from Alfa Aesar and Kishida Chemical Co., respectively. Tellurium powder and CdO powder vviere purchased from. Kojundo Chemical Laboratory Co. and Aldrich Chemical Co.. respectively. AII chemicals were used without further purification.. CdTe QDs capped with OA/TOP was prepared according to the procedure reported in the literature.i7 The synthesis of CdTe QDs was initiated by the preparation of the precursor solutions under inert conditioRs in a standard glovebox. In a typical synthesis the Te precursor. solution was prepared b>r dissolving O.l mmol of Te in O.25 mL of TOP. The solution was. further diluted with l•-octadecene to a total of 2.5 mL. The Cd precursor solution was prepared by mixing O.2 mmol ofCdO wTith 200 /tL of OA in IO mL of 1--octadecene solution. The Cd solution was heated to l OO OC for 40 min in a vacuum in a three-neck flask, removing. the water contents and resulting in the appearance ofa homogeneous red mixture. The system. was flushed by dry Ar gas and the temperature was raised to 300 OC. followed by the forniation ofa homogeneous transparent solution and the generation of(Cd(OA)2). When the solution was further heated to 310 OC for -IO min. an additional gray precipitate appeared,. which was characterized as crystalline Cdo nanopanicles. When the TOP/Te precursor solution was injected into the three-neck flask "--l min after the first appearance of the gray. precipitate, the nucleation of the CdTe QDs took place. The solution color was changed. 39.
(46) immediately and a temperature was dropped to 250 OC, vv'here further growth ofthe CdTe QDs took place. The growth of the QDs occurred during the l-5 min, vv'ith the solution gradually changing its color from yellow to red. Aliquots of the prepared CdTe QDs were drawn periodically from the reaction. Cooling the a}iquots to room temperature quenched the. QDs growth. These aliquots were then centrifuged to precipitate the crystalline Cdo nanoparticles and separate them from the CdTe QDs' colloidal solution. The CdTe QDs vv'as isolated from the remaining organic solution by the addition of an ethanol/acetone mixture (l:1) and by additional centrifugation. Purified CdTe QDs had been redissolved in hexane.. b) Basic infermation We observed steady-state absorption and emission spectra ofOA/TOP-capped CdTe QDs.. Figure 2.6 shows that a sharp peak at the band-edge and two shoulders attributed to IS3f2(h)-IS(e). 2S3n(h)-IS(e) and IPr,.,t2(h)-IP(e) were observed in absorption spectra while. single Gaussian-like spectra attributed to the band-edge emission were clearl>i observed in. emissioA spectra. The.v are similar to those of TDPA capped CdTe QDs. Average QD diameters ofOA/TOP-capped CdTe QDs were estimated to 2.6-4.5 nm by using previous two. methods.8'i3 Figure 2•.7 shows transmission electron microscopy (TEM: Tecnai G2 F2•O. 200keV, FEI) images of a typical OA/TOP capped CdTe QDs. Homogeneous and spherical QDs were clearly observed and the average QD diameter is -3.9 nm, which is fairly consistent with the size obtained from the absorption peak D = 3.9 nm. (l) of OA/TOP capped. CdTe QDs were determined as similar to that of TDPA capped CdTe QDs and ranged from 50 to 900/e for D -- 3.3-4.5 nm. However,. (P decreased steeply below D = 3.3 nm due to the synthesis limit and (P were 15-300/o for D = 2.6-3.2 nm. These high (b are probably due to the presence of Cdo nanoparticles during the synthesis, which controls the cencentration of Cd in solution and thus the optimal reaction rate to minimize defects could be achieved.i7. 40.
(47) 2.3 Synthesis of colloidal CdS QDs. 2.3.1 L-glutathione(GSH)cappedCdSQDs a) Sy. nthesis. L-glutathione (GSH, >990/o) and thiourea (9. 8.00/o) were purchased from Wako Pure. Chemical Industries, Ltd. Cadmium chloride hemi(pentahydrate) (CdC12. 99.90/o) was obtained from Sigma-Ardrich. All chemicals were used as received.. CdS QDs capped vv'ith GSH was prepared according to the procedure reported in the literature.i8 Typically, 0.2 mmol ot' CdCi2 solutiofl and O.26 mmol of GSH solution vviere mixed in 40 mL of distilled water, and the pH ofthe resulting so}ution vv'as adjusted to 1O.O by. dropwise addition of l.O M NaOH solution vv7ith stirring. Then O.36 mmol of thiourea was added to the solution under continuous vigorous stirring. The mixture vv'as loaded in a 50 mL. three-necked fiask and the system vxias degassed by bubbling dry N2 gas tbr an hour. Subsequently, the reaction mixture vv'as heated to 90 OC under N2 atmosphere. Timing started. when the temperature reached 90 OC. With the proceeding ofthe reaction and the formation of CdS QDs, the initial colorless solution turned bright yellow vvrith the passing time. Aiiquots of the sample vv'ere taken at different time iRtervals.. b) Basic informatien. Steady-state absorption and emission spectra of GSH capped CdS QDs are showR in Figure 2.8. In absorption spectra. only a sheulder was observed at the absorption edge due to the relatively larger size dispersion. In emission spectra, rnuch broader spectra wiere observed. at longer wavelength, which is attributed to an emission from trap states. Average QD. diameters are calculated from the IS(e)-IS3i2(h) absorption peak obtained from the experimental futing functioR,8. D =: ----N (6.6521 Å~ 10-8)A3 + (1.9557 Å~ 104)12 d-•- (9.2352 Å~ 10-2)A + 13.29 (2.7). Calculated D were D == 2.5-5.2 nm. Figure 2.9 displays a TEM image of GSH capped CdS. 41.
(48) QDs. The image sbows spherical shape ofCdS QDs vvTith well established lattice structures. (l). of GSH capped CdS QDs vvere deterniined at room temperature by comparing the integrated emission to that ofcoumarifi 343 in ethanol and rans,ed from 5 to 230/o.. 2.3.2 Sy. nthesis ofmyristic acid (MA) capped CdS QDs a) Sy. nthesis. All of the fellowing materials "vJere commerciaily available and used as received. Cadmium acetate dihydrate (Cd(OAc)2 •2H20, 98.00/o) and myristic acid (MA, 980/e) vv'ere. purchased fi'om Wako Pure Chemical lndustries, Ltd.). Pure sulfur (99.990/o) and 2,2'-dithiobisbenzothiazole (990/o) was obtained from Kojundo Chemical Laboratory Co. and Acros organics. respectively.. MA capped CdS QDs were prepared in organic solvents reported in the literature.i9 Briefiy, O.IO mmol of pure S, 6.5 mmol of2,2-dithio(bis)benzothiazol and 6.0 g of ODE were sonicated together for l h. The solution vNias then added into a .gO mL three-necked flask. containing O.IO mmol of Cd(OAc)2 •2H20. 0.20 mmol of' MA and 4.0 g of ODE. Subsequently, the reaction mixture was heated up to 12e OC with stirring under vacuum. A clear solution was obtained after ---2 h. The resulting solution was heated up to 240 OC in N2. atmosphere. When the temperature reached 200 OC, the growth of the CdS QDs was monitored via the temporal evolution ofthe optical properties ofthe growing CdS QDs.. b) Basic information Figure 2• .IO shows steady-tstate absorption and emission spectra of MA capped CdS QDs. Because the heating time does not give large infiuences on the spectral shifts of absorption. and emission spectra in this procedure, different sized CdS QDs were obtained by changing the synthesis temperature. In absorption spectra. two peaks and two shoulders w'ere clearly. observed due to the quite narrow size dispersion. which are attributed to IS(e)-IS3/2(h).. 42.
(49) 2S3i2(h)-IS(e), IP3a(h)-IP(e) and 3S3/2(h)-IS(e), respectively. In emission spectra, a sharp. bend-edge emission was mainly observed while little ameunt ofdefec{ emission was observed.. O of MA capped CdS QDs were determined as simi}ar to those of GSH capped CdS QDs and ranged from 2 to 1 l O/o, which are relatively lower values.. 2.3.3 OA capped CdS QDs OA capped CdS QDs were purchased from Sigma-Aldrich. Figure 2.11 shows steady-state absorption and emission spectra of OA capped CdS QDs. Sharp absorption spectra were observed as similar to that of MA capped CdS QDs. Both emissions from the band-edge and surface states are clearly observed in CdS 420 (this is a name of commodity).. This result suggests that surface states of OA capped CdS QDs are partially immobilized, vvihich is the intermediate state between GSH capped C•dS and MA capped CdS QDs. (P of OA. capped CdS QDs ranged from 9 to 55e/o, which were determined as similar to the procedure. for (b ofGSH capped CdS QDs.. 43.
(50) References (l) La Mer, V. K.; Dinegar, R. H. .1. Am Chem Soc. I95e, ;2, 4847.. (2) La Mer. V. K. Ind. Eng. I952, 44, 1270.. (3)Rao, C. N. R.; Muller, A.; Cheetham, A. K. Nanomaterials Chemistry: Recent Developments and New Directions; Wiley-VCH,. (4)Rogach, A. L.; Semiconductor Nanocrystal Quantum Dots: Synthesis, Assembly Spectroscopy and Appiications; Springer Wien New York, New York, 2008.. (5) Malkov, V. I. Crystal Growth for Beginiiers; World Scientific. Singapore, 20e3.. (6) Peng, X.; Wickharn. J.; Alivisatos P. ,1. Am (Xhem. Soc. I998, 120, 5343.. (7) TalapiR, D. V.; Rogach, A. L.; Shevchenko, E. V.; Kornow'ski, A.: Hasse. M.; VV'eller, H. ,Z Am. Cheni. Soc. 2002. 724,. 5782.. (8) Yu, W. VV'.; Qu, L.; Gt}o, W.; Peng, X. ('hem A4ater. 2003. I5, 2854.. (9) Klimov, V. I. ,1. Phys. Chem. B 2eOe, 104, 61l2.. (10) Gaponik, N.; Talapin, D. V.; Rogach. A. L.; Hoppe, K.;. Shevchenko, E. V.; Kornovv'ski.. A.; Eychmuller, A.; Weller. H. .J. Ph.vs. Chem B 20e2, 106. 7177.. (l 1) Wolcott, A.; Geriofi. D.; Visconate M.; Sun. J.; Schvvrartzberg, A.; Chen, S.; Zhang, Z. ,1.. 1'h.ys. Chem B 2006, lIO, 5759.. (l2) Tomasulo, M.;Yildiz, I.; Raymo, F.M. J. Ph.y.s'. Chenz. B 2006, 1 10, 3853.. (l3) Perez-Conde. J.; Bhattacharjee. A. K.: Chamarro, M.; Lavallard, P.; Petrikov. V. D.; Lipovskii, A. A. Phys. Rev. B 2001, 64, l13303.. (l4) Talapin, D. V. PhD thesis; The University ofHamburg, 2002.. 44.
(51) (l5) Li, C.; Murase. N. Chem. Lett. 2005, 34, 92.. (l6) Mandal, A.; Tamai, N. 1. Phys. Chem. B2008, 172, 8244.. (l7) Osovsky. R.; Klooper, V.; Kolny-Olesiak, J.; Sashchiuk, A.; Lifshitz, E. J. .PhJy's. Chem. C 200Z lll, 1084l. (l8) Zou, L.; Fang, Z.; Gu, Z.; Zhong, X. ,J. Lumin. 2009, 129, 536.. (l9) Ouyang, J.; Kuijiper, J.; Brot. S.; Kingston, D.; Wu, X.; Leek, D. M.; Hu, M. Z.; Ripmeester, J. A.; Yu, K. .1 1'hys. Chem C, 2009, /13, 7579.. 45.
(52) Critical Limiting Supersaturation. Cmax. m t-- ------m---------------Rapid Nucleation. Cmin. l: ll. = o N = o o = o. i.P-". l I GrowthbyDiffusion. -e-,e. o. ---- -e -- ------------ ll- ----. Il ll ll Cs. l I Solubility. mt-l- 1 I ------------ --P. 11 11 11 11 ll Il Il. Time. Figure 2.l Schematic diagram illustrating La Mer's condition for nucleation.. 46.
(53) Solution. e"8Ogeg. crysta1. 8eggk.t"."sgg.x.ggg. ChemicaI potential /L`es. ptc. Figure 2.2 A schematic illustration ofthe conformation and the chemical potential in solution and crystal phase. In the case ofmc > ms, the Rucleation does not occur.. 47.
(54) 6min. 6E 6 l. 14min. 2. Heating time. 6E6 gg. 30s. g. R 8 e. Heating tim. 3sec. 6min. ..>.5. 14min. .s?. -=. c. o. ith .ve. E. w 400 450 500 550 600 650 700 Wavelength /nm. 550. 600 650 700 Wavelength /nm. Figure 2.3 Steady-state absorption and emission spectra of TDPA capped CdTe QDs. With the increase ofthe heating time, both absorption and emission spectra shifts to the red, which. indicates that the size of CdTe QDs gradually increases.. 48. 750.
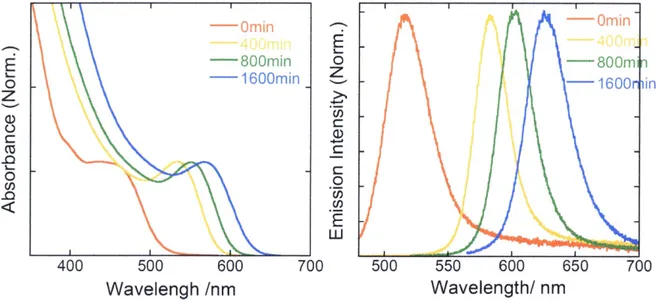
(55) •-••• :••. 800min 1600min. E 6. Omin. 66E 5. Omin. {;•. 800m 1600. ..>N. ln. 2. 8. .sil. ts. s. 98 2. = o. .th. .9. E. ur. 400. 500 600. 700. 500. 550 600 650. Wavelength/ nm. Wavelengh /nm. Figure 2.4 Steady-state absorption and emission spectra ofTGA capped CdTe QDs.. 49. 700.
(56) bCud/S. k. TGA-CdTe. r"". r'. =. t as s.......,n. MA-CdTe. co s:. w 5. o o CdTe bu/k. 10. 20. 30. 40 50. 60. 2e [grad]. Figure 2.5 X-ray diffractograms of CdTe nanocrystals obtained in aqueous solutions. in the. presence of thioglycolic acid (TGA) and 2-mercaptoethylamine (MA). This graph is. taken. from ref 14.. 50.
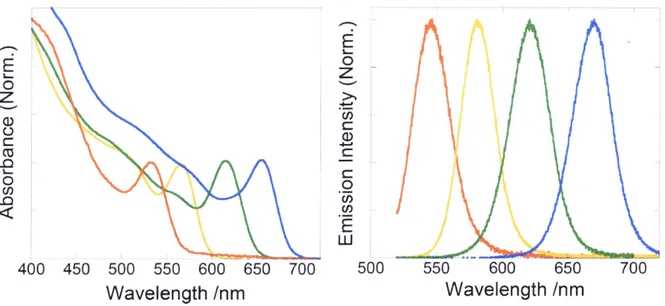
(57) pi. l --.. i6 Ei i• 6. Ai E li,. l. {l-. "I oi zi. ..>5. vi. F Åë1 2 i•. ll. 2 'il?. -= •,I. ru. 9 l8 li. Al < tl. -'. I. .9. EI. L. 1. u. 500. 400 450 500 550 600 650 700. 550 600 650 Wavelength /nm. Wavelength lnm. Figure 2.6 Steady-state absorption and emission spectra ofOA capped CdTe QDs.. 51. 1•. i. i. I. [m"... .,.. 11iii. 700.
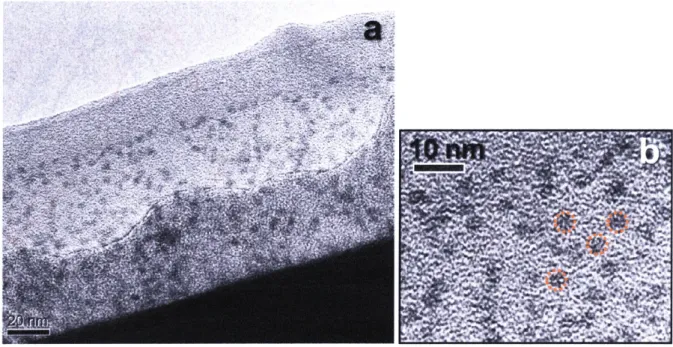
(58) Figure 2.7 TEM images ofCdTe QDs capped with OA/TOP at }ager scale (a) and smaller scale (b).. 52.
(59) 6E6. 1Omin. -6E. 120 min 240 min 360 min. {i!'. 1{i!••. .->. 1Omin 120 min 240 min 360 min. 2. g. .il!il. di. 28 2. s. a,. = o. .di. .9. li,/t,. E. w 300. 350 400 450. 500. Wavelength /nm. 350 400 450 500 550 600 650 Wavelength /nm. Figure 2.8 Steady-state absorption and emission spectra ofGSH capped CdS QDs.. 53.
(60) "siee. "e. . .. ts`'tfl'tuge' <. v"•. $tti'M".'tff&'. kVt9l31k'"s'l":'pt"('$gi. .,{.vx:. Figure 2.9 TEM images of GSH capped CdS QDs.. 54.
(61) 6E6. 6E6 fi. R 8 e. 3OOOc 26OOc 2400c. iiz.. .->. ill,•. 8. Reaction temperature. 3oooc. 2. 26OOc. .S2. .g. =. 24OOc. o. '6 .9. E. 250. 300 350 400 450. 500. 400 450 500 550 600 650 Wavelength lnm. Wavelength /nm. Figure 2.10 Steady-state absorption and emission spectra of MA capped Temperature in the figure represents a reaction temperature for the synthesis.. 55. CdS QDs..
(62) 6E6 l. CdS 400. 6E5. CdS 440 CdS 480. CdS 400 CdS 440 CdS 480. •.>.-. igl.. 2. g. .9 .E. fi. 28 2. =. '6o .9. A. E. m 300. 350 400 450. 500. 400 450 500 550 600 650 Wavelength /nm. Wavelength /nm. Figure 2.ll Steady-state absorption and emission. names are name ofcommodity (Sigma-Aldrich).. 56. spectra of OA capped CdS QDs. Each.
(63) Chapter 3 Carrier muRtiptication in CdTe QDs. 57.
図

+7
関連したドキュメント
Standard domino tableaux have already been considered by many authors [33], [6], [34], [8], [1], but, to the best of our knowledge, the expression of the
q-series, which are also called basic hypergeometric series, plays a very important role in many fields, such as affine root systems, Lie algebras and groups, number theory,
H ernández , Positive and free boundary solutions to singular nonlinear elliptic problems with absorption; An overview and open problems, in: Proceedings of the Variational
The inclusion of the cell shedding mechanism leads to modification of the boundary conditions employed in the model of Ward and King (199910) and it will be
Keywords: Convex order ; Fréchet distribution ; Median ; Mittag-Leffler distribution ; Mittag- Leffler function ; Stable distribution ; Stochastic order.. AMS MSC 2010: Primary 60E05
A lemma of considerable generality is proved from which one can obtain inequali- ties of Popoviciu’s type involving norms in a Banach space and Gram determinants.. Key words
Inside this class, we identify a new subclass of Liouvillian integrable systems, under suitable conditions such Liouvillian integrable systems can have at most one limit cycle, and
Equivalent conditions are obtained for weak convergence of iterates of positive contrac- tions in the L 1 -spaces for general von Neumann algebra and general JBW algebras, as well
