A Study on the Effects of Sight Distance
onthe Driven
Speed
of Vehicles
Makoto Yamamoto
Laboratory of Fore∫t Eng加どgr加g, Fac 「ty of Agriculture
林道における視距が車両速度に及ぼす影響
山 本 誠
(農学部林業工学研究室)
Abstract : The first half of this study shows the quantification analyses of the general design factors of roads, while the secod half deals with the experiments made on these analyses. The analyses were made on the relationship between the geometrical factors of forest roads and the driven speed of vehicles, by using qualitative factors as well as quantitative ones. As a result. it was found that there exist a large partial correlation coefficient between the sight
distance, which is a kind of multi・dimensional fnuction, and the driven speed of vehicles. The reliability of prediction on the vehicles' driven speed may be high if it is based on sight distance. The longer the sight distance, the higher the driven speed of vehicles. It was found that a curve mirrors installed at an intersecting point of curve is effective on the・ sight distance. The sight distance increased by 13 ±10 % for small-sized vehicles, 18±8 96 for medium-sized vehicles, and 6 ±3 % for large・sized vehicles.
Introduction
There have been many studies done to determine the relationship between the group on mechanical factors of forest roads and the driven speed of vehicles that run thereon. However, the correlation coefficient・as found on those studies have not been high enough1). The values of the correlation coefficient might have been 10wbecause the past studies took only those quantitative factors into condideration. None of them have considered the qualitative factors。
In this study the author tries to include various groups of factors, geometrical design, 0f vehicleがperformance, environment, and ergonomics, all including those elements of qualita-tive nature。
The driven speed of vehicles changes subject to various factors such as the geometrical design of roads, the capacity of vehicles, human sensitivity or terrainous environment. However, the group of human factors does not function effectively by themseves. Very often they function only when interacted with other factors. The main human factors herein indicated include those of mental nature and moral nature of human being. Related closely to these two factors is road alignment. The effect of road alignment becomes more con spicuous when one cannot see or tell the state of alignment beyond the curve in front of him。 One can speak of this effect in terms of sight distance, too. Considering the sight dis-tance as a criterion in measuring the vehicleがdriven speed, such. factors as the radius of curve, curve length, drivers゛ mental state, or their law-abiding mind may be included among the parts of the sight distance. The sight distance therefore should be regarded as a
multi-78 Res. Rep. Kochi Univ., Vol. 28, Agr. Sci.
dimensional factor。
In an effort to clarify the function of the sight distance that is played in determining the
vihicles'driven speed, an experiment was concuted to view the behavior of traffic
on existing
forestroads. It was expected to clarifyhow
the driven speed varied according to the
quan-titativeor qualitative changes in the multi-dimensional factor, the sight distance.
Method of Measurment
From the result of the experiments made on how geometric design factors of existing forest roads affect the driven speed of vehicles, it iS・possible to draw their own characteristic
features, but it is rather dぼicult to ascertain the effect of geometrical design factors. In order
to treat this problem properly, it is necessary to design experiments orthogonally and collect as many data from as many forest roads as possible. ‥
The data compiled here have also been used in the study of trffic on the forest roads". The driven speed of vehicles was measured at four points of curve : the first one at a point 20 mteters before point BC, the second at point BC, the third at point EC and the forth at 20 meters after point EC。
The measurements of driven speed were taken by an instrument of traffic counter with a built-in time recorder. Other groups of factors, such as the factors of geometrical design, the human factors, and environmental factors were each measured by people in charge of taking the respective measurements.
Method of Analyses
Because it was necessary to measure the qualitative factors in addition to the quantitative factors, the means of multivariate analyses by quantification method was adopted. The quantification method of this paper (in which the outside criteria is used,) is similar to that of socalled Hayashi's Quantification Scaling Type 13’.
Classiffication of Items and Categories : The data described above are classified as follows : The outside criterion (Y) is the driven speed declined (V), that iS。the dぼerence in speed (40−V)km/h between the design speed (40 km/h)of the road and the actual driven speed (v km/h)of vehicles observed on the road4)。
・The・explanatory variables of the outside criterion (Y)andtheir levels・ were classified into 4 groups as given in Table 1. Each group was divided into several items, which were further sub-dicided into 2∼6 categories. The intra-category borderlines were determined after calculations were repeated several times until the correlation coefficient and the contri-buted ratio came to show the values reliable enough for use".
GROUP U 3 l S 3 p I B O I J J S t U O a S J O S ﹂ o も a ` 0 ぷ H jcQEoo﹂ぶにQQぶ︸﹂os﹂oも心﹂ 3111 79 Table χ The classificationof items and categories ITEM Radius of curve Curve length Curve ratio Gradient Width Side ditch Sight distance Curve・frequency Direction of curve Road edge Road side Road surface Brightness on the surface Traffic density Forest stand CATEGORY Small Medium 1 Medium 2 Large Very large -Short Medium Long -Small Medium Large Very large Super large Narrow Medium Wide No ・ Exist Very short Short Little short Medium Little long Long Few Medium Many In-curve Out-curve S-curve straight Clearness standard Obscurity
High wall without gurd High wall with gurd Ordinary
Without reliable edge
Smooth Medium Rough Brightnss Darkness Very few Medium Many ‘Country forest Mountain forest Remote mount. for
COMMENT R=Less than 10m R=10mt020m R = 21 m to 30 m R = 31 m to 40 tn 41m and over Cl=Less than 10 m Cl = 10 m to 20 m Cl = 21 m and over Less than 2.9 96 3.0%t0 7.0 % 7.1 % and over Less than 2.9 % 3.0%t0 7.0 % 7.1 % and over Less ・ S 4 j 4 6 0 than 3.59 m m t0 4.00 m 01 m and over Less1116213141 mmmmm than 10 m t0 15 m t0 20 m t0 30 m t0 40m and over Less than 2 3 and 4 Greater than 5 Clearness standard Obscurity
Vibro. ace. =Iess than 0. 5g Vibro. ace. =0.51 t0 2.0 g Greater than 2.1 8
1.0 vehicle per an hour and under 1.0±1.0 vehicIe/30 minutes 1.0 vehicle/5 minutes and over
Less than 45 min. from market 46 min. t0 90 min. from market 91 min. and over
80 』 § 1 S J O J O B J I B U O S j a j Res. Kind of vehicles New or used Age Personality
Kochi Univ., Vol. 28, Agr
Keiyon Passenger car
Van type & coach type vehicle Medium size track-empty-Large size track-empty-Large size
track-loaded-As good as new Slightly scrap
Sex
Traffic purpus
Medium size 2 Large size track 1 Large size track 2
New car Used car 01dcar
Less than 25 years 26 t0 35 years 36 years and over
Gently Ordinary rough Male ・I Female Man・transportations Timber・transport. Others
Result of Analyses and Discussions
The reliability of the analyses : The reliability of the over-all analyses may be determined by multiple correlation coefficient p, which was arrived at 0.8764 given in Table 3. The reliability should. therefore, be regarded high. The quantitative comparisons between the observed values and the estimated values are given in Table 2.
Tablel Thecomi>arison betvaeenthe obseruationand theestimationquart tifi・cation Observed value (Y) Estimated value (X) Correlation coefficient Regression epuation Mean -7.317 7.3098 standard dev. 1.23422 1.18575 0.87371 、ヽY gi 0. 99985 χ十〇.00076 X=0、、羽812 Y+ 1.61830
The contributed ratio of each item : The multiple correlation coefficient p between the total 22 items/77 categories and the outside criterion (Y) is 0.8764. This value is reliab】y high. The partial correlation coefficient of each item is given in Table 3. The contributed ratio between each item and outside criterion can be judged from the partial correlation coefficient and the range.
In this study. the partial correlation coefficient is used because the observed data were su-fficient enough in number compared with the number of categories and the characteristics of the two approximately agreed to each other6卜
Ion-81 Table 3 The list of partial correlations and the multifile corr・elationof the multidiviensional factor anaりsis of the geometrical design of mountainous∫orest roads Variable factors Radius of curve Curve length Curve ratio Longitudinal grade Width of road surface Side ditch Sight distance Curve frequency Direction of curve Road edge Road side Road surface
Brightness on the surface Traffic density
Forest stand
Kind of vehicles ・ New or old car
Driver's age Career experience
Personalitv Sex distinction Traffic purpus
Multiple correlation coefficient 0.8764
Partial corr. coeff 0 . 2 8 1 0 0 . 2 8 0 3 0 . 3 4 5 9 0 . 4 0 0 0 0 . 3 2 0 0 0 . 1 4 2 5 0 . 4 1 1 8 0 . 2 9 1 6 0 . 1 5 7 3 0 . 1 0 0 9 0 . 1 8 8 0 0 . 3 6 0 7 0 . 0 6 0 2 0 . 1 0 2 3 0 . 2 7 3 1 0 . 4 2 2 4 0 . 1 3 6 6 0 . 2 0 1 7 0 . 2 0 0 5 0 . 2 7 8 9 0 . 1 4 2 8 0 . 1 8 8 9
gitudinal grade, road surface, curve ratio, width, curve frequency and radius of curve exercise heavy influence on the speed of vehicles. Next influentical items are curve
length, personality of drivers, forest stand, driverがS age, and their career experience. In the following, the two items (kind of vehicles, sight distance) that showned high partial
correlation coefficient value are selected to show further calculations as stepwise.
First, all the remaining items were input to get the multiple correlation coefficient. lt・ was 0.6667. As a next step those 2 items were included for multiple correlation coefficient. The result was 0.8764 as indicated above. This means that these two important factors
alone may be sufficient enough to explain the influence.
The contributed ratio of categories : It is seem from Table 3 that the four factors (kind of vehicles, sight distance. longitudinal grade and road surface) had the highest contributed ratios. Then under what state of condition do these four factors exercise the strongest
influence ?
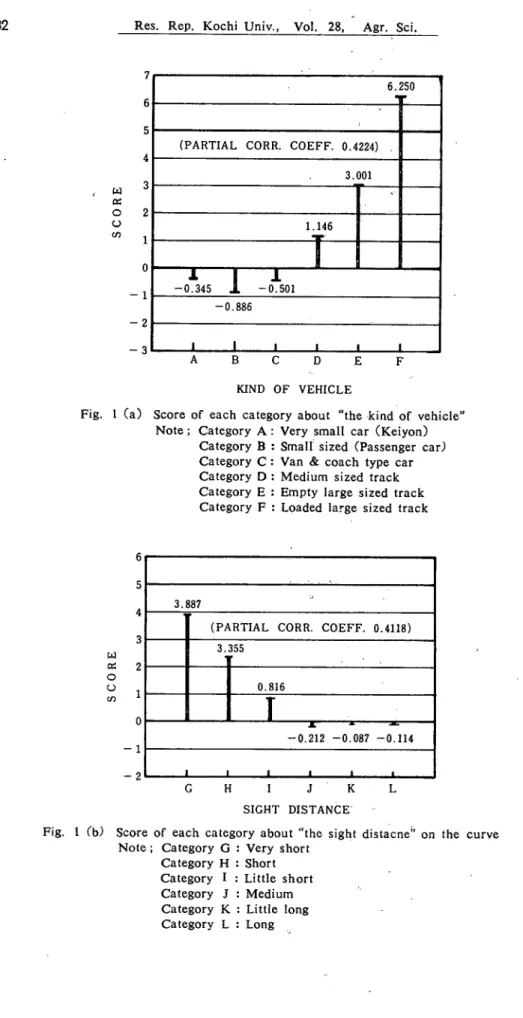
It is not impossible to speculate on a contributed ratio from the deviation value of the categories. From those categories that have the partial correlation coefficient at the signi-ficant level 0f 1 %, Figure l was obtained. Because of the fact arrived at from this study that the partial correlation coefficient of all items showed positive values, it may be said
82 Res. Rep. Kochi Univ. Vol. 28, Agr. Sci 7 6 5 4 CO CM f-4 3H0DS 0 −1 −2 −3 6.250 ? 1
(PARTIAL CORR. COEFF. 0.4224) .
3.001 4 1.146 °−I
-of;145 1 -
Aol
−0.886 1 1 1 1 ● 1 A B C D E F KIND OF VEHICLEFig. 1 (a) Score of each category about “the kind of vehicle" Note ; Category A : Very small car (Keiyon) Category B : Small sized (Passenger Car) Category C : Van & coach type car Category D : Medium sized track Category E : Empty large sized track Category F : LO aded large sized track
6 5 4 3 CM f-H aaoos 0 1 2 d 1 3.887
(PARTIAL CORR. COEFF. 0.4118) 3.355 T 0.816
1 万
-0.212 -0.087 -0.114 1 1 1 1 自 ● G H I J K L SIGHTDISTANCE 一一Fig. 1ぐb) Score of each category about “the sight distacne" on the curve Note; Category G : Very short
CategoryH : Short Categoryl : Little short CategoryJ : Medium 9 CategoryK : Little long − CategoryL : Long 、
2 1 0 9 8 7 ″ り 1 1 1 5 4 3 2 1 0 1 −2 −3 M 8ろ U 11.402-r (PARTIALCORR. COEFF. 0.4000) 4.001 2.109 −
1
-0.707 1 -1.384 1-2.675 ∼ ● 1. 1 1 S N O P Q R LONGITUDINAL GRADE.Fig. 1 Cc) Score of each category about
“longitudinal grade”.
Note ; Category M : Easy favourable
grade
Category N : Ordinary favourable
grade
Category O : steep favourable
grade
Category P : Easy adverse grade
Category Q : Ordinary adverse
grade
Category R : steep adverse grade
1 0 1 1 9 8 7 6 5 4 CO P≪J aaoos 1 0 −1 −2 3 9.474
i
(PARTIALCORR. COEFF. 0.3907)1 1
-1.711 -1.635 ● ● ● S TROUGHNESS OF ROAD SURFACES Fig. 1 Cd) Score of each category about ”the roughness of road surfaces”. Note ; Category S z Smooth Category T S Ordinary Category U : Rough
that the influence of ・those categories that holds the highest score values exercise large inf-luence. For example, the category “loaded large sized truck” under item “kind of vehicle” came to be known as the factor that caused a slow-down of speed. Likewise,“less than 20 meters” under “sight distance”,“greater than 7 %in case of adverse grade” under “grade”, and “rough” under “road surface” became the influencial factors。
The remaining two thirds of the items/categories had the partial correlation coefficient at a signigicant level of 5 %. No further effort shall be needed to explain other items/cate-gories because they had low partial correlation coefficient, and their significant levels are low also。
84 Res. Rep. Kochi Univ., Vol. 28, Agr. Sci.
therefore should not be considered a criterion in estimating‘ the vehicleがspeed. Therefore,
sight distance was adopted in its place. The factor“sight distance”contains an element of alignment factor and of ergonomic factor, and therefore, is a multi-functional factor, and may be a factor more useful than curve ratio(K)2j and travel time factor (B)"' which has been a conventional parameter in evaluating the geometrical design of roads.
Eχperiment
As described above, it is clear that the sight distance, especially when it is short, have a great influence on the driven speed of vehicles. Efforts are therefore made to empirically , observe the relationship between the sight distance and the vehicles speed on forest roads.
The results are shown in Figure 2. The date compiled 恥re were taken in a road having the longitudinal grade of O∼±3%.
6 0 5 0 ( j q / U D ) ︶ 40 30 20 10 S3^^IH3A JO a33dS N3AIHa 0
1 1く>A : PASSENGER CAR | |
O B: COACH TYPE VEH】
| |
CLE
l l loc : EMPTY LOGGING TRACK | | |
●D : LOADED LOGGING TRACK
I I I
T
&
/
彩
1
Å
硝
ゴ
/
/
゛ ¶rB
り J゛詞研
リ
一寸
〃に
抑
y「
| | IN CAFE OF ?゜to 55’ j 4坏
0 10 20 30 40 50 60 70 80SIGHT DISTANCE BY OBSTRUCTIONS ON CURVE(M)
Fig. 2 The relation between the sight distance on the curve
and driven speed of vehicles. /
Short sight distance exists only in a land formation having a steep side slope and a sharp
curve. In such area, it is not possible to scrape out the inside of the out-curve and provide
a visivility berm to improve sight distance. Nor is it spossible in in-curve area to fell out
standing trees at the road Si(!e for better sight distance, because it has relation to a reduction
of productivity in forest land.
Here is a way to improve sight distance. It i'S to set up a curve mirror. A study
there-fore, was made to see how it improved the sight distance and how it affected the speed of
vehicles.
men-120 1 0 0 80 60 か (W)3N0VlSia XHOIS 9 0 85
tioned above. Ideally, it is best to install a curve mirror at an intersecting point of curve to obtain the best sight distance. However, it may not produce the best result because the direction of vision is different from that of the vehicle when the external secant of the curve is very long (the curve is sharp). Besides, more often than not, the lane formation prevents a curve mirror to be installed at a intersecting point of curve.
Actually, more mirrors are being installed at a road shoulder, and therefore, the experi-ments were conducted under such set ups. ‘
Sight distance may be theoretically calculated in the following formula when a mirror was
installed at road shoulder :
SD″≧21(T£).2
車。
子)2−2T£(£s一万1 COS 180−∂- where SI:)´: Sight
distance
T£ : Tangent
length
ES `. External
secant
召 :Widthof surface
θ : Intersection
angle
However,
the sight distance reflectedin the mirror and so recognized by a driver in the
run-ning vehicle for 2∼3 seconds may
not be as long as the theoreticalcalculation tellsus.
The
experiments
with the curve mirror (600 mm
in diameter)
have produced
the results
shown
in Figure 3.
The
speed observed in thiseχperiment was plotted and overlapped with Figure 2 for
com-parison.
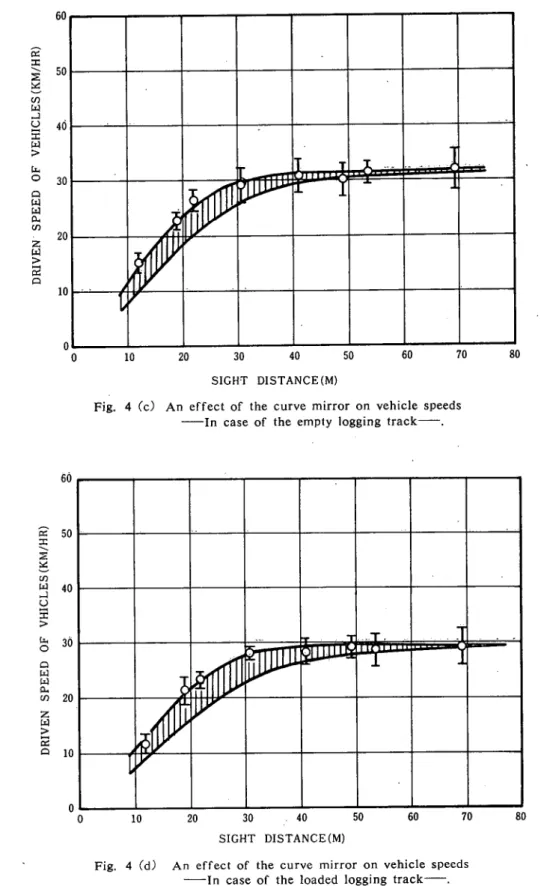
The results obtained are shown in'
Figure 4 (a), (b) and (c).
N
ゝ 亀 、Y
'Nす
乱
| │一THE CALC l lLJLATED SIGHT DISTANCE | | ゝ ● ’l
へ
似
-THE I MEASURIED SIGjr DISTA j:い レ| VICE\こ
ブ
心、
へ
に
に
- l lWhere, IA & Rへ
へ
ヘトー
t
I八¶100 75 50 35 25 18 12 10 R I T? 20 30 40 50 60 80 100 l ● ● ● 10 20 30 40 50 60 70 80 INTERSECTION ANGLE(゜)86
6 0 0 0 in -v (HH/WM)SaiOIH3A μ 4 0 3 0 0 CM a33dS Z 凶 y ← 4 O i Q 1 0 0 ・ 6 0 (HH/W>I)S3aOIH3A JO Q 叫 叫 Q . t n 2 0 1 0 0Res. Rep. iCochi Univ., Vol. 28, Agr. Sci.
SIGHT DISTANCE(M)
Fig. 4 (a) An effect of the curve mirror on vehicle speeds −゛‘-Incase of the passenger car .
T _ − ¶ ・ ‥ J
I
l/1
匹
蝉
回戸
工即エロl
μμ・−/
尹
/
,イ
ド
y
0 10 20 30 40 50 60 70 SIGHT DISTANCE{M)Fig. 4(b)An effect of the curve mirror on・vehicle speeds In case of the coach type car Cmedium sized carjトー−
︵HH/WM)S3131H3A dO a33dS
NHAIHa
A study on the Effects of Sight Distance on the Driven Speed of Vehicles
J V ) 0 . 0 3 0 2 0 1 0 n . ・ j
に-.・。,
T J
_,χ;..i.4.‥J
-r“1?
j
び
1ニL/
− ・ -よ ミ ゝダ
t.
・ − 6 0 0 0 0 ・’0 0 010 -^ CO CM ^ ︵HH/MM)S3131HA J0QQ凶QのZ]ンーQ 0 10 20 30 40 50 60 70 SIGHT DISTANCE (M)Fig. 4 Cc) An effect of the curve mirror on vehicle speeds In case of the empty logging track .
8 0 ・ ミ り ・。 ‘「 .T .
フT
る
づ
芦
plェl 竹-
-■
/
/
し
0 10 20 30 ,40 50 60 70 SIGHT DISTANCE(M)Fig. 4 (d) An effect of the curve mirror on vehicle speeds
In case of the loaded logging track .
8 0 87
88 Res. Rep. Kochi Univ., Vol. 28, Sci.
Conclusion
With introduction qualitative factors into consideration, it became clear that sight dis-tance had a great deal to do in determining the vehicles speed. In forest roads, the sight distance is likely to be short. There may be a few ways to make the sight distance long, but installment of curve mirrors may be the most effective and reasonable way of all. The curve mirror, however, does not exercise the influence on all vehicles to the equal
degree. When a mirror is installed, small sized vehicles increase their driven speed by 13 ±10%,middle sized vehicles by 18 ±8 %, and large sized vehicles by 6±3 %. So the effect of curve mirrors should not be underestimated. The driven speed deviation in large sized vehicles is small perhaps because the speed of large sized vehicles has already been controlled to some extent by other factors.
In this study the largest influence is seen in medium sized vehicles. However, other types of vehicles may also be benefited by the mirror if further consideration is given to the
dia-meter of mirror, the cuvature of the mirror surface, the height and the position of the mirror.
Literature cited /
1) Yamamoto, M., An analysis of the traffics on the forest roads.Bull. KochtUniv.For.
5, 17∼26,1979 (in Japanese with English summary)
2) Yatnamoto, M., An evaluation of geometrical design of forest roads as viewed from their
traffic analyses.Mem. Fac.Agr. Kochtuni。。31, 1∼82, 1977 (in Japanese witn English
summary) 。 1‘
3) Hayashi, C, Multidimensional quantification -- with applications to analysis of social
phenomena. Ann.Sta. Math., 5, 121∼143, 1954 ’
4) Yamamoto, M., Evaluation of geometrical design factors of forest roads.Res. Rep.Kochi
び㎡り。24. 27∼33, 1975 (in Japanese with English summary)
5) Jazwinski, A. H., Stochastic processes and filtering theory. 376 pp, Academic Press New
York & London, 1970
6) Tamura, T., A study on the over・cutting of the earth ground by an earth-moving machine
in the forest road construction. Mem. Fac. Agr. Kochiuni。。34, 1∼85, 1979 (in Japanese
with English summary)
7) Koffman, J., Performance prediction, A graphical method for the determination of vehicle
acceleration. Aut。。Eng. 44, 364∼366, 1954
8) Byrne, J. J., Nelson, R. J. and Googins, p. H., Logging road handbook, The effect of
road design on hauling costs. 65 pp, USDA, Washington, 1960
(Manuscript received : September 29,1979) (Published : February 27,1980)