NIC
から
2MASS
の測光システムへの色変換係数の導出
小野里 宏樹兵庫県立大学 天文科学センター 西はりま天文台 〒679–5313兵庫県佐用町西河内407–2
Determination of color transformation coefficients
from NIC to 2MASS photometric system
Hiroki ONOZATO
Nishi-Harima Astronomical Observatory, Center for Astronomy, University of Hyogo, 407–2 Nishigaichi, Sayo-cho, Hyogo 679–5313, Japan
(Received 2020 November 23; accepted 2020 November 25) 概要
異なった望遠鏡、観測装置で取得された測光データを高精度に比較する際には、得られた等級を同一 の測光システムに変換する必要がある。この論文ではなゆた望遠鏡のカセグレン焦点に搭載されている
Nishiharima Infrared Camera (NIC)で観測した等級を近赤外線での事実上の標準システムとなっているTwo
Micron All Sky Survey (2MASS)のシステムに変換するための色変換式の変換係数を導出した。銀河面の星
間減光の強い領域の観測データを含めることで、非常に赤い天体までを含んだ幅広い色指数の天体を用い て変換係数を導出することができた。その結果、変換係数は小さく、NICと2MASSの測光システムは似て いることが確認できた。
Abstract
Accurate comparison of photometric data acquired by different telescopes and instruments requires the transfor-mation of the magnitudes to the same photometric system. In this paper, I derived color transfortransfor-mation coefficients to convert the magnitudes observed with the Nishiharima Infrared Camera (NIC) equipped on the Cassegrain focus of the Nayuta telescope to the Two Micron All Sky Survey (2MASS) system, which has become the de facto stan-dard system in the near-infrared. I was able to derive the color transformation coefficients using sources with a wide range of colors since the sample contains very red sources affected by strong interstellar extinction in the Galactic plane. As a result, the conversion coefficients are small, and it is confirmed that the NIC and 2MASS photometric systems are similar.
Key words: instrumentation: detectors — instrumentation: photometers
1. Introduction
Nishiharima Infrared Camera (NIC) は兵庫県立大学天文 科学センター西はりま天文台のなゆた望遠鏡のカセグレ ン焦点に搭載されている近赤外線撮像装置である。J、H、 KS の近赤外線の3バンドを一度の露出で取得できること が特徴である。 長期間にわたる観測データが必要な場合、あるいはキャ ンペーン観測を行った場合などには複数の望遠鏡、観測装 置で得られた結果を組み合わせることがある。このとき、 同じ種類のフィルターでの観測であっても望遠鏡、観測装 置、フィルターといった光学系の効率や観測サイトの大 気透過率の違いにより得られる等級には系統誤差が乗っ てくる。したがって、他の観測システムで得られる等級 との比較を高精度に行いたい場合には、この系統誤差を 補正する必要がある。本論文では、 NIC で得られる器械 等級を近赤外線での事実上の標準システムとなっている Two Micron All Sky Survey (2MASS: Skrutskie et al. 2006) システムに変換する係数を導出する。
2. データと解析
色変換係数を求めるため、2020年10月時点で Subaru-Mitaka-Okayama-Kiso-Archive system (SMOKA) でデータ が公開済の2019年4月までのデータのうち自動解析スク リプトで世界座標システム (World Coordinate System,
WCS) の貼り付けまで成功しているデータを使用した。
複数回データが取得されている場合には観測ログや画像 を確認し、天候が良いものの中で星像の半値全幅(full
width at half maximum, FWHM)が最も小さいものを使
用した。加えて近赤外線でも赤い天体をカバーするため に OH 53.6 −0.2 と OH 77.9 +0.2 を中心座標とする観測 を2019年10月28日に行った。使用した観測データの一覧 は表1に記されている。観測領域には銀河面の赤化の影響 を強く受けた領域も含まれるため、−0.1 <∼J − H<∼ 4.0、 −0.3<∼H − KS<∼ 2.0までの幅広い色指数の星が含まれて いる。 取得データの一次処理は、自動解析スクリプトによって 行った。自動解析スクリプトで行われる処理は、ダーク引
縞パターン除去、画像重ね合わせ、WCS貼り付けである (詳細は 石黒 et al. 2011 を参照)。
天体の測光は開口測光で行った。開口の半径は各画像 の星像の FWHM の平均とし、スカイを差し引くための円 環領域の内径は FWHM の4倍、外形は内径 +3ピクセルと した。各天体の等級のゼロ点補正は 2MASS Point Source Catalog (PSC: Cutri et al. 2003)との比較により行った。開 口測光により得られた NIC の器械等級と 2MASS PSC の 差分を取り、測光誤差で重みを付けた加重平均を求め、そ の値を足すことでゼロ点補正を行った。
以上で得られた1316天体の測光結果をもとに色変換式 の変換係数を導出した。色変換式は
mJ, NIC− mJ, 2MASS= aJ(J − H)2MASS+ bJ (1)
mH, NIC− mH, 2MASS= aH(J − H)2MASS+ bH (2)
mKS, NIC− mKS, 2MASS= aKS(H − KS)2MASS+ bKS(3)
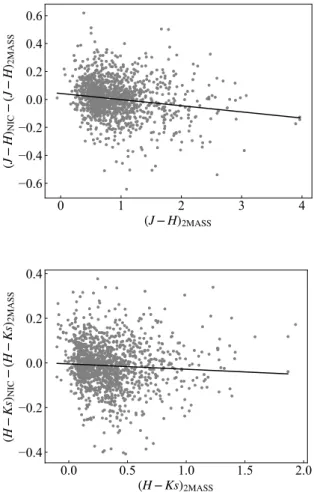
のように色指数の1次式を仮定した。同様に色指数につい ても (J − H)NIC− (J − H)2MASS = aJ −H(J − H)2MASS+ bJ −H (4) (H − KS)NIC− (H − KS)2MASS = aH−KS(H − KS)2MASS+ bH−KS (5) の形で変換係数を導出した。フィッティングは最小二乗法 を用いて以下の手順で行った。まず、全ての点を用いてフ ィッティングを行い、変換係数を導出する。その結果、得ら れた変換式と各データ点の残差を計算しその標準偏差を 求める。次に、変換式との残差が求めた標準偏差よりも 小さいデータ点のみを使用して変換係数を計算する。こ こで得られた変換式を使い再び標準偏差を求め、さらに 新たな変換式との残差が標準偏差よりも小さいデータ点 を全データから選び直して再度フィッティングを行う。こ のイタレーションを収束するまで繰り返し変換係数を導 出した。 3. 結果 2MASSの色指数に対するNICのゼロ点を補正した等級 と2MASSの等級の差は図1に、2MASSの色指数に対する NICと2MASSの色指数の差は図2に示されている。これら の図にはイタレーションを繰り返した後の最終的なフィッ ティング結果も示されている。また得られた変換式は、等 級の差については、 mJ, NIC− mJ, 2MASS = (−0.002 ± 0.065)(J − H)2MASS +(0.030 ± 0.065) (6) mH, NIC− mH, 2MASS = (0.009 ± 0.062)(J − H)2MASS −(0.004 ± 0.064) (7) mKS, NIC− mKS, 2MASS = (−0.002 ± 0.114)(H − KS)2MASS +(0.012 ± 0.050) (8) (J − H)NIC− (J − H)2MASS = (−0.044 ± 0.067)(J − H)2MASS +(0.043 ± 0.065) (9) (H − KS)NIC− (H − KS)2MASS = (−0.024 ± 0.125)(H − KS)2MASS −(0.004 ± 0.052) (10) である。結果を見ると色変換係数の値は小さく、NICの 測光システムと2MASSの測光システムは非常に似ている ことがわかる。一般に近赤外線の測光システムは観測装 置による違いが小さいと言われており、Infrared Survey Facility (IRSF)の Simultaneous three-color InfraRed Imager for Unbiased Survey (SIRIUS: Kato et al. 2007)や Okayama Astrophysical Observatory Wide-Field Camera (OAOWFC:
Yanagisawa et al. 2019)でも似た結果が得られている。た
だし、NIC で得られた色変換係数は上記の例と比べてフ ィッティングの誤差が大きい。この理由は以下のようにフ ィッティングに利用できた精度の良い天体数の少なさに起 因する考えられる。 IRSF Magellanic Clouds Point Source
Catalogには大小マゼラン雲、マゼラニックブリッジを合 わせて1700万天体以上が含まれており、NIC で色変換係 数の導出に用いることができた1316天体と比較すると1万 倍以上の天体数となる。OAOWFC の色変換係数に用いら れた天体数は4300天体で NIC の3倍程度であるが、視野 の広さを利用して稼いだ天体数で信号雑音比(signal-to-noise ratio, S/N比)が25より大きいの素性の良い天体のみ を抜き出せている。一方 NIC では、NIC で得られた測光 結果の S/N比は十分大きいが、比較に用いる 2MASS の測 光結果に S/N比が小さいものが含まれてしまっている。特 に、ターゲット天体が暗く長時間積分を行った天体では 比較星も暗く、2MASS の S/N比が小さい。しかしながら、 2MASSの S/N比が大きい明るい天体のみを抜き出そうと すると、NIC の視野の狭さのために十分な天体数を稼ぐ ことができない。そのために、NIC と 2MASS 等級の差分 のばらつきが大きくなり、色変換係数のフィッティング誤 差も大きくなってしまっている。 4. まとめ なゆた望遠鏡のカセグレン焦点に搭載されているNIC と2MASSとの間の色変換式の変換係数を導出した。銀河 面の星間減光の強い領域を含む様々な観測領域の天体を 用いることで、−0.1 <∼J − H<∼ 4.0、−0.3 < ∼H − KS<∼ 2.0 までの幅広い色指数の星を使用して変換係数を求めるこ とができた。その結果、他の観測装置と同様に色変換係 数は小さく、NICと2MASSの測光システムが非常に似て いることが確認できた。 References 石黒正晃、高橋隼、禅野孝広、時政典孝、&黒田武彦2011、西 はりま天文台年報、21、13
Cutri, R. M., et al. 2003, VizieR Online Data Catalog, II/246 Kato, D., et al. 2007, PASJ, 59, 615
Skrutskie, M. F., 2006, AJ, 131, 1163 Yanagisawa, K., et al. 2019, PASJ, 71, 118
0 1 2 3 4 (J−H)2MASS −0.4 −0.2 0.0 0.2 0.4 mJ,NIC − mJ,2MASS 0 1 2 3 4 (J−H)2MASS −0.4 −0.2 0.0 0.2 0.4 mH,NIC − mH,2MASS 0.0 0.5 1.0 1.5 2.0 (H−Ks)2MASS −0.4 −0.2 0.0 0.2 0.4 mKS ,NIC − mKS ,2MASS
Fig. 1. Magnitude difference between the NIC zero-point calibrated magnitudes and 2MASS magnitudes. The black solid lines represent the best-fit transformation formula described in equations (6)–(8).
0 1 2 3 4 (J − H)2MASS −0.6 −0.4 −0.2 0.0 0.2 0.4 0.6 (J − H )NIC − (J − H )2MASS 0.0 0.5 1.0 1.5 2.0 (H − Ks)2MASS −0.4 −0.2 0.0 0.2 0.4 (H − Ks )NIC − (H − Ks )2MASS
Object name RA (J2000.0) Dec (J2000.0) Observation date Total exposure time (sec) 209 Dido 07h05m09.s346 +72◦21′55.′′92 2014 Apr 6 1200 [CB88] 105 17h 58m 17.s 617 −03◦46′27.′′14 2014 Apr 11 1200 [ETP2005] X 79 18h 43m 29.s 806 −03◦50′14.′′99 2014 Apr 25 600 [ETP2005] X 100 18h43m32.s687 −04◦04′18.′′88 2014 Apr 25 600 2MASS J12401715−0525419 12h40m17.s241 −05◦25′42.′′02 2014 May 2 300
Nova Sco 2014 17h15m47.s005 −31◦27′52.′′74 2014 May 5 50
TrES-3 17h 52m 12.s 811 +50◦33′29.′′85 2014 May 7 600 [CB88] 128 18h15m55.s141 −03◦47′12.′′86 2014 May 8 600 SN 2014bk 13h53m58.s470 +20◦00′51.′′00 2014 Jun 13 600
Nova Del 2013 20h23m28.s897 +20◦46′20.′′20 2014 Jun 13 25
[LM99] CB 130-1 18h 16m 17.s 298 −02◦34′08.′′15 2014 Jun 15 600 [CB88] 190 19h 20m 49.s 580 +23◦28′46.′′47 2014 Jul 24 600 Nova Sgr 2014 18h25m09.s343 −22◦36′16.′′89 2014 Jul 27 20 MAXI J1910−057 19h10m22.s893 −05◦47′56.′′42 2014 Aug 12 300 393 Lampetia 23h59m12.s985 +20◦26′10.′′09 2014 Aug 12 600 Nova Cep 2014 20h 54m 23.s 972 +60◦17′07.′′50 2014 Aug 12 300 [CB88] 132 18h19m36.s052 −06◦04′15.′′60 2014 Sep 5 600 GRB 140907A 03h12m35.s099 +46◦36′18.′′11 2014 Sep 7 600 obj1831 18h31m58.s113 −07◦27′27.′′01 2014 Sep 8 50 Nova Cyg 2014 20h 21m 43.s 895 +31◦03′36.′′23 2014 Sep 15 150 PNV J00432372+4122256 00h 43m 23.s 689 +41◦22′39.′′08 2014 Sep 16 600 V517 Cyg 20h47m19.s698 +43◦44′33.′′06 2014 Oct 1 600 [CB88] 192 19h23m13.s419 +12◦23′45.′′56 2014 Nov 7 600 HD 45314 06h27m15.s965 +14◦53′46.′′65 2014 Nov 9 200 GRXE A 18h 43m 31.s 861 −03◦50′28.′′24 2014 Nov 23 300 [CB88] 242 23h12m09.s446 +61◦37′03.′′41 2014 Dec 2 600 [LM99] CB 22 04h40m38.s358 +29◦54′58.′′91 2014 Dec 2 600 [CB88] 214 20h03m52.s083 +26◦37′34.′′06 2014 Dec 8 600 [CB88] 222 20h 33m 17.s 633 +64◦02′52.′′38 2014 Dec 8 600 [CB88] 26 05h 00m 32.s 424 +52◦07′44.′′90 2015 Jan 10 600 V1647 Ori 05h46m13.s558 −00◦05′56.′′46 2015 Jan 13 600 Orion-KL 05h35m14.s306 −05◦22′13.′′28 2015 Feb 11 20 HAT-P-14 17h20m34.s133 +38◦13′50.′′97 2015 Mar 5 300 SW UMa 08h 36m 48.s 155 +53◦29′00.′′59 2015 Mar 17 1200 GRB 150323A 12h 50m 28.s 327 +50◦11′27.′′72 2015 Mar 23 1200 EBF003 18h42m58.s406 −03◦53′28.′′35 2015 Mar 25 600 [CB88] 126 18h15m25.s844 −03◦47′42.′′57 2015 Apr 8 600
Table 1. (Continued.)
Object name RA (J2000.0) Dec (J2000.0) Observation date Total exposure time (sec)
NGC 3516 11h06m54.s639 +72◦34′48.′′18 2015 Jun 9 1200 V404 Cyg 20h24m03.s955 +33◦52′01.′′96 2015 Jun 28 100 SKYS8 22h 37m 04.s 752 +20◦43′13.′′73 2015 Nov 15 600 [CB88] 44 06h07m21.s759 +19◦31′33.′′32 2015 Nov 29 600 SKYS9 02h03m48.s607 +19◦41′53.′′23 2015 Dec 8 600 HIP 93664 19h04m18.s119 +12◦59′47.′′22 2016 Oct 9 100 V409 Tau 04h 18m 01.s 858 +25◦19′22.′′25 2017 Apr 13 300 Cyg X-3 20h 32m 28.s 210 +40◦56′46.′′33 2017 Apr 14 300 SN 2017eaw 20h34m38.s911 +60◦11′53.′′37 2017 Sep 30 1200 M 56 19h16m36.s117 +30◦11′00.′′01 2017 Nov 2 300
GLAB LAE 1 06h50m48.s481 +41◦16′45.′′43 2018 Mar 28 1200
TN1338 LAE 4 13h 38m 57.s 452 −19◦36′07.′′96 2018 Mar 28 1200 MAXI J1820+070 18h20m22.s495 +07◦10′03.′′44 2018 May 14 160 M 3 13h42m11.s319 +28◦22′31.′′42 2018 Jul 12 50 TrES-5 20h20m55.s635 +59◦26′24.′′00 2018 Aug 1 300 KISS15s 03h 08m 31.s 724 −00◦51′33.′′29 2018 Sep 2 1200 3FGL J1804.5−0850 18h 04m 31.s 325 −08◦50′57.′′12 2018 Oct 25 600 PSO J338.2298+29.5089 22h32m54.s867 +29◦31′03.′′18 2019 Jan 24 2400 OH 53.6 −0.2 19h31m20.s678 +18◦12′51.′′33 2019 Oct 28 2400 OH 77.9+0.2 20h28m26.s373 +39◦06′59.′′91 2019 Oct 28 2400