近畿大学学術情報リポジトリ
74
0
0
全文
(2) (英文題名) Molecular mechanisms of multi-drug resistance induced by EvgA/EvgS, a two-component signal transduction system in Escherichia coli Yoko Eguchi March, 2003 Graduate School of Kinki University Division of Agricultural Science Major: Applied Bioscience (Adviser: Prof. Ryutaro Utsumi). (和文題名) 大腸菌二成分制御系 EvgA/EvgS による 多剤耐性化誘導機構の解明. 近畿大学大学院. 農学研究科. 応用生命化学専攻 江口 陽子 (指導:内海 龍太郎 教授). Submitted to the Graduate School of Kinki University to fulfill the requirement for the Doctorate Degree..
(3) ABBREVIATIONS ABC ACR ATP BENZ bp BSA Cam cat c.f.u. CHO CV Da DNA DNase DOC DOX RNA RND R6G EBR EDTA HEPES IPTG kb Km LB medium MATE MDR MIC NOR nt OD OMF ORF PAGE PCR RNAP SDS SMR Tc Tris TRM UTP UV. ATP-binding cassette family acriflavine adenosine 5’-triphosphate benzalkonium chloride base pair bovine serum albumin chloramphenicol chloramphenicol acetyltransferase gene colony forming units sodium cholate crystal violet dalton deoxyribonucleic acid deoxyribonuclease deoxycholate doxorubicin ribonucleic acid resistance-nodulation-cell division family rhodamine 6G ethidium bromide ethylenediaminetetraacetate 4-(2-hydroxyethyl)-1-piperazineethanesulfonic acid isopropyl-1-thio-D-galactopyranoside kilobases kanamycin Luria-Bertani medium multi-drug and toxic compound extrusion family multi-drug resistance minimum inhibitory concentration norfloxacin nucleotides optical density outer-membrane factor open reading frame polyacrylamide gel electrophoresis polymerase chain reaction RNA polymerase sodium dodecyl sulfate small MDR family tetracycline 2-amino-2-hydroxymethyl-1,3-propanediol trimethoprim uridine 5’-triphosphate ultraviolet.
(4) CONTENTS. CHAPTER I. Introduction. CHAPTER II. Multi-drug resistance induced by EvgA/EvgS signal transduction system in Escherichia coli. 1. section 1. Induction of multi-drug efflux pumps and multi-drug resistance by the EvgA/EvgS system. 3. section 2. Analysis of multi-drug efflux pump genes expression in Escherichia coli. 20. CHAPTER III. Signal transduction network regulated by the EvgA/EvgS system in Escherichia coli. section 1. Signal transduction cascade between EvgA/EvgS and PhoP/PhoQ systems in Escherichia coli.. 30. section 2. Transcriptional cascade of acid resistance genes initiated by the EvgA/EvgS system. 45. Conclusion. 59. CHAPTER IV. ACKNOWLEDGMENTS. 60. REFERENCES. 61. PUBLICATIONS. 70.
(5) CHAPTER I Introduction Emergence of microbial resistance has shadowed the introduction of every new therapeutic agent.. Of particular threat is the occurrence of multi-drug resistance. (MDR), which has been the focus of much recent attention. The MDR phenomenon is often associated with the expression of the transporters that recognize and efficiently expel from the cells a broad range of structurally unrelated compounds.. Analysis of. the available genome sequences of various bacteria revealed that known and putative drug efflux transporters constitute from 6 % to 18 % of all transporters (Paulsen et al., 1998).. In E. coli, as many as 37 putative multi-drug transporters are encoded on the. chromosome.. RND Family (resistance nodulation division). drug. ABC Family (ATP binding cassette). TolC. AcrB. YhiV. AcrF. AcrD. YegNO. CusA. YddA. Mdl. ATP TcmA. SMR Family (small multidrug resistance). YdiN. EmrE. YdhE Na+. YieO. YdiM MATE Family (multidrug and toxic compound extrusion). MFS Family (major facilitator superfamily). YeeO. YdhC YnfM F. H+. YbjZ. EmrY EmrB MdfA EmrD. Fsr. YceE. YceL. Bcr. YidY. YjiO. Putative multi-drug efflux pumps of Escherichia coli. 1. YajR YdeA. Yd e. YdeE. YhiH. ADP. EmrE YdgFE. YojI. H+.
(6) The expression or overproduction of these MDR pumps is caused by several factors. One factor is the mutations occurring within their promoter regions or to their transcriptional regulators.. Another case is the involvement of ‘drug sensors’, such as. the EmrR repressor for the emrAB operon, encoding the EmrAB multi-drug efflux pump in E. coli . EmrR binds substrates of the EmrAB pump and controls its expression (Lomovskaya et a l., 1995).. These mechanisms are well-explained, but only targets. several of the major pumps among the large number of pumps predicted to exist. A question arises toward the remaining pumps: When are they expressed and what are they for? Recently, a connection between two-component signal transduction systems and regulation of MDR pump genes has been reported in E. coli (Kato et al., 2000; Nishino & Yamaguchi, 2001a).. Two-component systems are the major signal transduction. pathways in prokaryotic organisms responding to environmental conditions. another aspect to the regulation of the MDR pump genes.. This added. These pumps may be. expressed by a change in environmental conditions, not necessarily from induction by their substrates.. After all, the biological significance of these pumps is still not defined,. and what makes them express remains a question. In this study, MDR induced by the EvgA/EvgS two-component signal transduction system via the induction of MDR pumps in E. coli was examined in Chapter II-1.. Along with this line, a complete collection of promoter-gfp (green fluorescent. protein) reporter plasmids of MDR pump genes in E. coli were constructed and characterized, in order to investigate the expressions of MDR pump genes (Chapter II-2). From the EvgA/EvgS side, signal transduction network regulated by the EvgA/EvgS system was studied.. A novel signal transduction cascade between EvgA/EvgS and. PhoP/PhoQ (Mg2+ responsive two-component system) is described in Chapter III-1. Furthermore, transcription cascade of acid resistance genes initiated by the EvgA/EvgS system, which is related to the MDR phenotype, is shown in Chapter III-2.. All these. results suggested that the MDR initiated by the EvgA/EvgS system was one part of the complicated signal transduction network, indicating the relationship between MDR and the adaptation to environmental conditions.. 2.
(7) Chapter II. Multi-drug resistance induced by EvgA/EvgS signal. transduction system in Escherichia coli II-1 Induction of multi-drug re sistance pumps and multi-drug resist ance by the EvgA/EvgS system Introduction The EvgAS two-component signal transduction system in Escherichia coli is highly homologous to the virulence-related BvgAS system of Bordetella pertussis (Utsumi et al., 1994). BLAST search indicates the presence of homologous systems in Klebsiella pneumoniae , Vibrio cho lerae and Pseudomonas aeruginosa .. EvgS is a. histidine kinase hybrid sensor, which is composed of an N-terminal periplasmic region and a C-terminal cytoplasmic region that is divided into four domains: linker, transmitter, receiver and output (Hpt) (Perraud et al., 1999).. The periplasmic domain. of EvgS is involved in signal recognition, ultimately transducing the signal into a transcriptional regulation network via a cascade of phosphorylation (Utsumi, 2002; Utusmi et al., 1994). To date, however, the target genes under the control of EvgAS are still poorly characterized.. Auto-phosphorylation of the cytoplasmic region of. EvgS (without the transmembrane and periplasmic region) has been reported to be inhibited in vitro by an oxidized ubiquinone-0 (Bock & Gross, 2002) as is also the case with the anaerobic sensor ArcB (Georgellis et al ., 2001). However, the inhibition of EvgS autophosphorylation by ubiquinone has not been confirmed in in vivo experiments, and the environmental signal(s) sensed by EvgS also remains to be determined. There are two methods of analyzing the function of the EvgAS system: deletion of evgAS and overexpression of the regulator EvgA. Ohshima et al . (2002b) has recently reported the genome-wide transcriptional changes caused by the deletion of each of the two-component systems of E. coli (http://ecoli.aist-nara.ac.jp/xp_analysis/2_ components).. According to the report, a group of two-component systems investigated. showed only subtle changes when deleted. The EvgAS system is among such systems, and its deletion decreased the transcription of as few as three ORFs.. 3. From this result,.
(8) the EvgAS system is considered to be not activated under the conditions employed, and deleting such a non-activated system will give little information.. Overexpression of. the regulator to artificially activate the system is another method for analyzing the EvgA system.. However, artifacts arising from the overexpression may occur (Albright et al.,. 1989; Utsumi et al ., 1994). Moreover, it is difficult to interpret the transcriptional changes resulting from the overexpression: Did it occur from the increased level of non-phosphorylated EvgA or from EvgA phosphorylated by sources other than its cognate sensor EvgS, such as acetyl phosphate? By using a spontaneous E. coli mutant (evgS1 mutant, Kato et al., 2000), which produces a constitutively active EvgS with F577S mutation within the linker region (also a predicted PAS domain, Bock & Gross, 2002), Kato et al. first found that transcription of emrKY, a multi-component drug efflux pump of the MFS (major facilitator superfamily) family, is positively regulated by the EvgAS system.. We. analyzed in this study, transcription patterns for some drug resistance genes in this evgS1 mutant in order to clarify the relationship between the EvgAS system and MDR expression. Materials and Methods Bacterial strains and growth conditions.. The E.coli strains and plasmids used in this study are listed in Table 1. Construction of acrA, phoP, and phoQ mutants derived from KMY1 (wild-type) and KMY2001 (evgS1 mutant) was made by P1 transduction with JA300A (acrA::cat), WP3022 (phoP::cat), and WQ3007 (phoQ::cat) as the donor strains, respectively. Construction of tolC mutants of strains KMA1 and KMA2001 was also made by P1 transduction with W4573tolC::Tn10.. Strains were grown at 37 °C with aeration in. Luria-Bertani (LB) medium (pH 7.5), containing 1 % (w/v) Bacto Tryptone (Difco), 0.5 % (w/v) Bacto Yeast Extract (Difco), and 1 % (w/v) NaCl.. When necessary,. selective antibiotics were added to the medium as follows: 100 µg ampicillin ml-1, 25 µg chloramphenicol ml-1, 12.5 µg tetracycline ml-1, or 25 µg kanamycin ml-1.. 4.
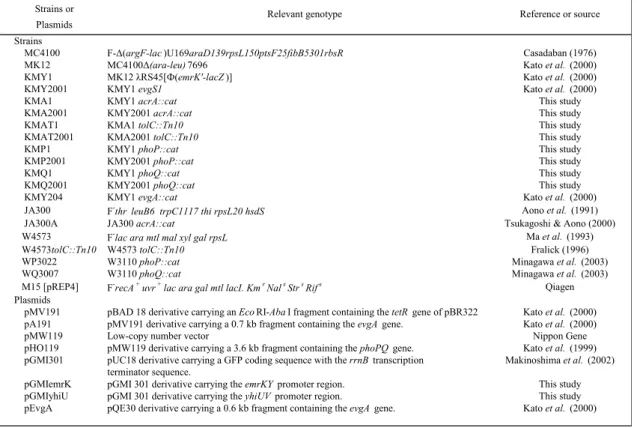
(9) Table 1. Bacterial strains and plasmids used in this study Strains or. Relevant genotype. Plasmids Strains MC4100 MK12 KMY1 KMY2001 KMA1 KMA2001 KMAT1 KMAT2001 KMP1 KMP2001 KMQ1 KMQ2001 KMY204 JA300 JA300A W4573 W4573tolC::Tn10 WP3022 WQ3007 M15 [pREP4] Plasmids pMV191 pA191 pMW119 pHO119 pGMI301 pGMIemrK pGMIyhiU pEvgA. Reference or source. F-Δ(argF-lac )U169araD139rpsL150ptsF25fibB5301rbsR MC4100Δ(ara-leu) 7696 MK12 λRS45[Ф(emrK'-lacZ )] KMY1 evgS1 KMY1 acrA::cat KMY2001 acrA::cat KMA1 tolC::Tn10 KMA2001 tolC::Tn10 KMY1 phoP::cat KMY2001 phoP::cat KMY1 phoQ::cat KMY2001 phoQ::cat KMY1 evgA::cat F-thr leuB6 trpC1117 thi rpsL20 hsdS JA300 acrA::cat F-lac ara mtl mal xyl gal rpsL W4573 tolC::Tn10 W3110 phoP::cat W3110 phoQ::cat F-recA + uvr + lac ara gal mtl lacI. Km r Nal s Str s Rif s. Casadaban (1976) Kato et al. (2000) Kato et al. (2000) Kato et al. (2000) This study This study This study This study This study This study This study This study Kato et al. (2000) Aono et al. (1991) Tsukagoshi & Aono (2000) Ma et al. (1993) Fralick (1996) Minagawa et al. (2003) Minagawa et al. (2003) Qiagen. pBAD 18 derivative carrying an Eco RI-Aba I fragment containing the tetR gene of pBR322 pMV191 derivative carrying a 0.7 kb fragment containing the evgA gene. Low-copy number vector pMW119 derivative carrying a 3.6 kb fragment containing the phoPQ gene. pUC18 derivative carrying a GFP coding sequence with the rrnB transcription terminator sequence. pGMI 301 derivative carrying the emrKY promoter region. pGMI 301 derivative carrying the yhiUV promoter region. pQE30 derivative carrying a 0.6 kb fragment containing the evgA gene.. Kato et al. (2000) Kato et al. (2000) Nippon Gene Kato et al. (1999) Makinoshima et al. (2002) This study This study Kato et al. (2000). Plasmid construction.. Plasmids containing the emrK and yhiU promoter regions were constructed as follows.. The 545 bp emrK promoter fragment and 405 bp yhiU promoter fragment. were amplified by PCR with genomic DNA from strain W3110 and the primers: 5’-GCTGAACAGATCTTCCGCCTTCAGT-3’ and 5’-AATCTGATGCATTATTATCT CTCATTTCTC-3’ for emrK, and 5’-GAAACTAAGATCTATGAGCGACATCGTCA C-3’ and 5’-TCTTCTATGCATTTTAGTCCCTGAAAATTC-3’ for yhiU. primers contain EcoT22I and BglII sites (underlined) suitable for cloning.. These The PCR. products were digested with restriction enzymes and then were ligated into the EcoT22I and BglII sites of pGMI301. Drug susceptibility tests.. The MICs of drugs were determined on LB agar plates containing serial dilutions of the following compounds: doxorubicin hydrochloride (Wako Pure Chemical), crystal violet (Tokyo Kasei Kogyo), rhodamine 6G (Sigma-Aldrich), ethidium bromide (Sigma-Aldrich), acriflavine (Tokyo Kasei Kogyo), benzalkonium chloride (Tokyo. 5.
(10) Kasei Kogyo), SDS (Nacalai Tesque), deoxycholate (Nacalai Tesque), cholate (Nacalai Tesque), norfloxacin (Wako Pure Chemical), and trimethoprim (Wako Pure Chemical). Experiments were repeated at least twice.. The inoculum E. coli cultures were prepared. by diluting overnight cultures to 106 c.f.u. ml-1, and 5 µl of the diluted culture was spotted.. Inoculated plates were incubated for 16 to 20 h at 37 °C.. The lowest. concentration of a drug that completely inhibited growth was identified as the MIC. RNA preparation and S1 nuclease mapping.. Total RNA was extracted with hot phenol from a mid-log phase culture (OD600 = 0.7 - 0.9) at 60 °C (Aiba, 1983). al. (2000). In brief,. S1 mapping was carried out as described by Kato et. 32. P-end labeled probe was prepared by PCR using primers listed. in Table 2, MC4100 genomic DNA as the template, and ExTaq DNA polymerase (Takara). A mixture of 32P-end labeled probe and 100 µg of total RNA were incubated for 10 min at 75 °C, then gradually cooled to 37 °C and incubated overnight for hybridization, followed by S1 nuclease (Takara) digestion for 10 min at 37 °C. Undigested RNA-probe DNA was extracted with phenol, precipitated with ethanol, and subjected to electrophoresis on 6 % (w/v) polyacrylamide sequencing gel.. The. radioactivity of the transcripts was measured by BAS1000 Mac (Fuji Film) and analyzed by MacBAS2.2 (Fuji Film). DNA microarray analysis.. Total RNA from strains KMY1 and KMY2001 was extracted from mid-log phase cultures as in the S1 mapping and was further treated with RNase-free DNase I (Takara). Preparation of fluorescent labeled cDNA, microarray hybridization, and data analysis were performed as described by Oshima et al . (2002a).. In brief, cDNA labeled with. Cy3-dUTP (KMY1) and Cy5-dUTP (KMY2001) was synthesized from each total RNA by random priming.. Labeled cDNA probes were purified and hybridized to a custom. glass slide microarray (Takara), which was spotted in duplicates with 4097 PCR products corresponding to full-length E. coli ORFs and the human -actin gene as a negative control.. The slides were scanned for the fluorescent intensity using a. GMS418 array scanner (Genetic Microsystems) and recorded as 16 bits image files. The signal density of each spot in the array was quantified using Imagene software 6.
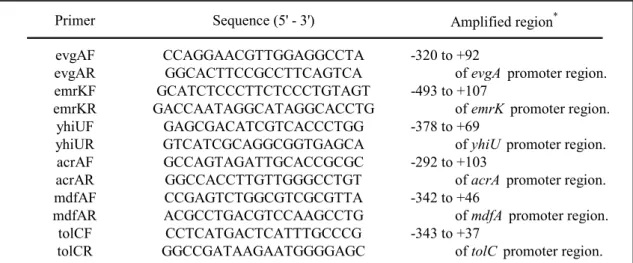
(11) (BioDiscovery).. Normalized relative Cy5/Cy3 ratios of 2 and above was considered. as significant increase in expression, and 0.5 and below as significant decrease in expression. Table 2. PCR primers Primer. Sequence (5' - 3'). evgAF evgAR emrKF emrKR yhiUF yhiUR acrAF acrAR mdfAF mdfAR tolCF tolCR. CCAGGAACGTTGGAGGCCTA GGCACTTCCGCCTTCAGTCA GCATCTCCCTTCTCCCTGTAGT GACCAATAGGCATAGGCACCTG GAGCGACATCGTCACCCTGG GTCATCGCAGGCGGTGAGCA GCCAGTAGATTGCACCGCGC GGCCACCTTGTTGGGCCTGT CCGAGTCTGGCGTCGCGTTA ACGCCTGACGTCCAAGCCTG CCTCATGACTCATTTGCCCG GGCCGATAAGAATGGGGAGC. Amplified region* -320 to +92 of evgA promoter region. -493 to +107 of emrK promoter region. -378 to +69 of yhiU promoter region. -292 to +103 of acrA promoter region. -342 to +46 of mdfA promoter region. -343 to +37 of tolC promoter region.. *. Positions with respect to the translational starting point of the corresponding gene.. Purification of EvgA.. A plasmid expressing EvgA His-tagged at its amino terminus (pEvgA) was transformed into E.coli M15[pREP4].. For expression of EvgA, the transformant was. grown at 37 °C with aeration in 200 ml of 2×YT broth, containing 1.6 % (w/v) Bacto Tryptone (Difco), 1 % (w/v) Bacto Yeast Extract (Difco) and 0.5 % (w/v) NaCl, to a cell density of OD600 = 0.8, followed by addition of IPTG at a final concentration of 1 mM. After 4 hr of incubation at 37 °C with aeration, cells were harvested by centrifugation, washed with sonication buffer (25 mM NaH2PO4, 25 mM Na2HPO4, 1 M NaCl, 5 % (w/v) glycerol), and stored at -80 °C until use. For protein purification, frozen cells were resuspended in 4 ml of the sonication buffer with 1 mM PMSF, lysed by sonication, and centrifuged at 5,000 rpm for 30 min at 4 °C.. The supernatant was. mixed with 2 ml of 50 % Ni(II)-NTA agarose suspension (Qiagen) and loaded onto a column.. EvgA was eluted with sonication buffer containing 100 mM imidazole.. EvgA of this fraction was concentrated, and the buffer was exchanged to storage buffer (50 mM Tris-HCl, pH7.5, 50 mM KCl, 10 mM MgCl2, 1 mM DTT, 50 % (w/v) glycerol) with centrifugal filtration (Ultrafree-MC, Millipore). 7. The protein.
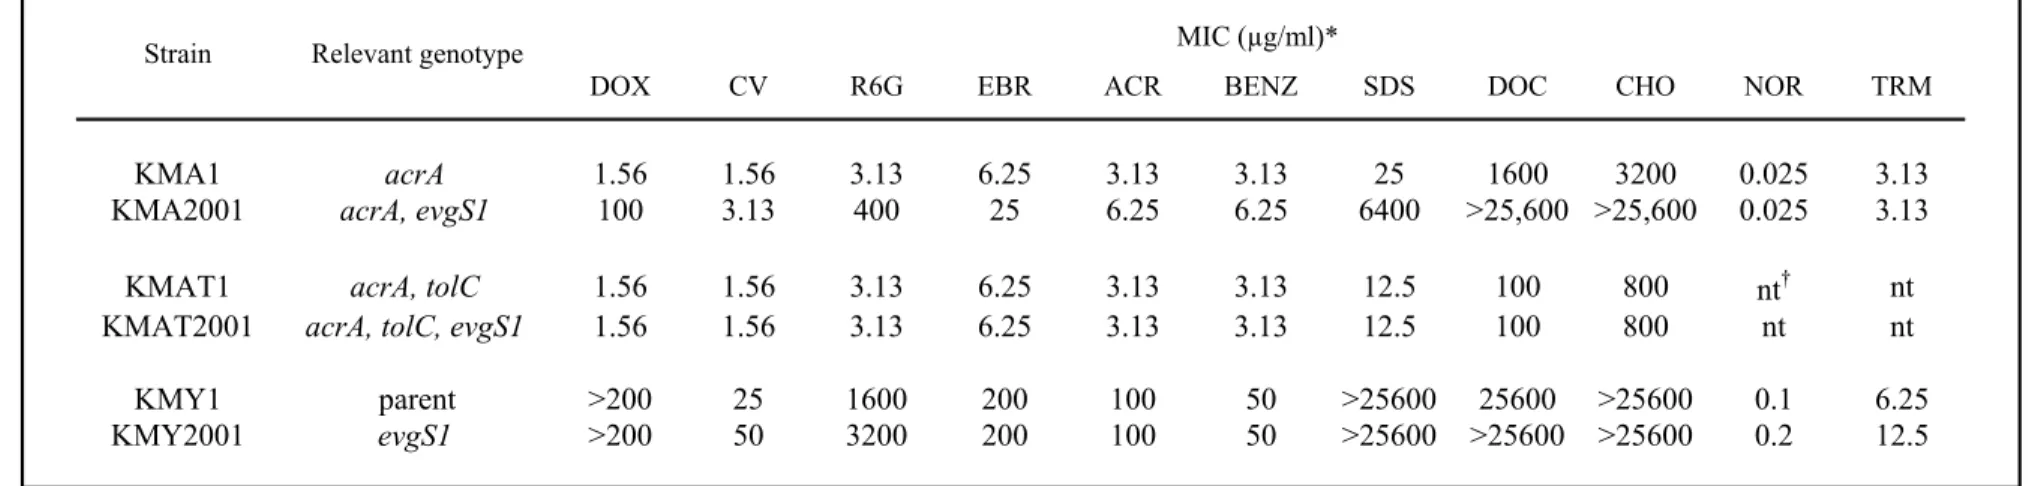
(12) concentration was determined using the Bradford method (protein assay kit, Bio-Rad), and the purity was checked by SDS-PAGE. In vitro transcription assays.. pGMIemrK and pGMIyhiU were digested with EcoT22I and BglII to prepare linear DNAs including the emrK and yhiU promoter regions, respectively, as the template of in vitro transcription. RNA polymerase (RNAP) containing σD was used for the assay, which was performed under standard reaction condition (Kajitani & Ishihama, 1983).. In brief, 0.1 pmol of the template was incubated with 0, 25, 50, 100. pmol of His-tagged EvgA for 10 min at 37 °C in the presence or absence of 10 mM acetylphosphate in a total volume of 33 µl.. Into this reaction mixture, 1 pmol of. RNAP was added and incubated for 20 min at 37 °C to form an open complex.. Then a. substrate-heparin mixture containing [α32P]UTP was added and further incubated for 10 min at 37 °C.. The transcripts were precipitated with ethanol, and subjected to. electrophoresis on 6 % (w/v) PAGE with 7 M urea.. The radioactivity of the transcripts. was measured by BAS1000 Mac (Fuji Film), and analyzed by MacBAS2.2 (Fuji Film).. Results Role of EvgAS two-component system in expression in vivo resistance genes:. of multi-drug. Multi-drug resistance of evgS1 mutant. Multi-drug resistance phenotype of E. coli is determined by a number of genes including multi-drug efflux genes.. To test possible involvement of the EvgAS. two-component system in expression in vivo of the multi-drug resistance (MDR), the sensitivity to various drugs was tested for evgS1 mutant (KMY2001) that produces a constitutively active mutant of EvgS.. This mutant strain KMY2001 showed twofold. increase in MICs of crystal violet, rhodamine 6G, norfloxacin and trimethoprim, and twofold or more increase in deoxycholate compared to the wild-type parent KMY1 (Table 3). To eliminate possible influence of AcrAB pump, the primary multi-drug transport pump (Ma et al., 1993), we then checked the drug-sensitivity of these strains in the absence of acrA (Table 3). Mutant KMA2001 (acrA evgS1 ) showed higher resistance to at least against 9 drugs, doxorubicin (64-fold increase in MIC), crystal 8.
(13) violet (2-fold), rhodamine 6G (128-fold), ethidium bromide (4-fold), acriflavin (2-fold), benzalkonium chloride (2-fold), SDS (256-fold), deoxycholate (>16-fold), and cholate (>8-fold) than KMA1 (acrA) (Table 3), suggesting that the EvgAS system is involved in expression of genes conferring resistance to these drugs.. Increased resistance to. doxorubicin, crystal violet, ethidium bromide, acriflavin, benzalkonium chloride and cholate has been observed after overexpression of EvgA (Nishino & Yamaguchi, 2001a). Resistance to two drugs, norfloxacin and trimethoprim, was essentially the same between KMA1 (acrA) and KMA2001 (acrA evgS1), but twofold increase in MICs of these two drugs was found in KMY2001, suggesting that this modest level of increase in resistance is determined by the AcrAB pump. In order to assess whether the outer membrane channel, TolC, is required for the MDR phenotype, the drug sensitivity was then compared between KMAT1 (acrA tolC) and KMAT2001 (acrA, tolC, evgS1).. Both KMAT1 and KMAT2001 were highly. sensitive to all the drugs tested and no difference was observed in the drug sensitivity between these two strains (Table 3), indicating that TolC is essential for the MDR conferred by the evgS1 mutation. Role of EvgAS two-co mponent system in expression in vivo of multi-drug ef flux genes:. Enhanced transcription by the constitutive evgS1 mutant. Positive autoregulation is found in some two-component systems of E. coli such as PhoPQ (Kato et a l., 1999).. Along this line, the intracellular level of the response. regulator EvgA could be influenced in the constitutive evgS1 mutant.. To test this. possiblity, S1 mapping was performed for evgA mRNA that was prepared in the exponential phase cells grown in LB medium at 37 °C. As shown in Fig. 1, the levels of evgA mRNAs from downstream of both P1 and P2 promoters (Tanabe et al., 1998) in the evgS1 mutant were as high as those in wild-type E. coli , indicating that no strong autoregulation operates in transcription of the evgAS operon. Next, we examined transcriptional levels of multi-drug efflux genes in E. coli mutant expressing the constitutive mutant EvgS using E. coli. DNA microarray. (supplementary data, http://www.nara.kindai.ac.jp/nogei/seiken/array2.html).. Most of. the putative multi-drug efflux related genes (selected on the basis of sequence similarities; Paulsen et al., 1998; Nishino & Yamaguchi, 2001b; Sulavik et al.., 2001) 9.
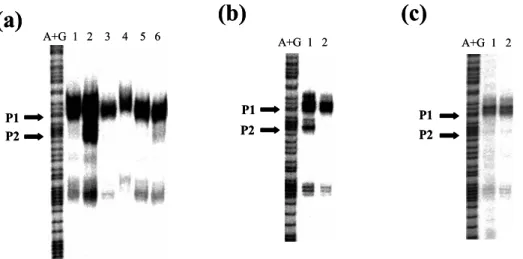
(14) were below the detection level under the steady-state of exponential growth phase, but at least five genes or operons, which were emrKY, yhiUV, acrA, mdfA and tolC, showed increased expression in the presence of constitutive mutant EvgS1 (Table 4).. A+G 1 2. P2. P1. 10. Fig. 1. S1 mapping of the evgA promoter. Lane A+G represents Maxam-Gilbert sequencing ladder, while lanes 1 and 2 represent S1 mapping of evgA for KMY1 (p arent) and KMY2001 ( evgS1 mutant), respectively . Two transcript s of evgA are indicated by arrows..
(15) Table 3. Multidrug resistance of evgS1 , acrA mutant Strain. *. MIC (µg/ml)*. Relevant genotype DOX. CV. R6G. EBR. ACR. BENZ. SDS. DOC. CHO. NOR. TRM. 0.025 0.025. 3.13 3.13. KMA1 KMA2001. acrA acrA, evgS1. 1.56 100. 1.56 3.13. 3.13 400. 6.25 25. 3.13 6.25. 3.13 6.25. 25 6400. KMAT1 KMAT2001. acrA, tolC acrA, tolC, evgS1. 1.56 1.56. 1.56 1.56. 3.13 3.13. 6.25 6.25. 3.13 3.13. 3.13 3.13. 12.5 12.5. 100 100. 800 800. nt† nt. nt nt. KMY1 KMY2001. parent evgS1. >200 >200. 25 50. 1600 3200. 200 200. 100 100. 50 50. >25600 >25600. 25600 >25600. >25600 >25600. 0.1 0.2. 6.25 12.5. 1600 3200 >25,600 >25,600. MICs were determined by plating 104 c.f.u./5 µl spot on LB agar media containing serial dilutions of drugs, and incubated for 16 to 20 hr at 37°C Experiments were repeated at least twice, and the lowest concentration of drug that completely inhibited growth was identified as the MIC. † nt; not tested. DOX, doxorubicin; CV, crystal violet; R6G, rhodamine 6G; EBR, ethidium bromide; ACR, acriflavine; BENZ, benzalkonium chloride; SDS, sodium dodecyl sulfate; DOC, deoxycholate; CHO, sodium cholate; NOR, norfloxacin; TRM, trimethoprim.. 11.
(16) Table 4. Expression ratio of multi-drug efflux genes ORFs. Ratio. *. ORFs. MFS emrK emrY mdfA emrA emrB emrD fsr yceE yceL bcr yidY yjiO yajR ydeA ydeF ynfM ydhC ydiM yebQ yegB yieO. †. 19.5, H H, H 4.4, 4.1 1.2, 1.1 ‡ ND , ND ND, ND 0.9, 0.7 ND, ND ND, ND 0.8, 0.7 ND, ND ND, ND 0.4, ND ND, ND ND, ND 1.0, 1.0 0.7, ND ND, ND ND, ND ND, ND 0.3, 1.3. Ratio. RND acrD acrE acrF acrA acrB mdtA mdtB mdtC yhiU yhiV cusA. ND, ND ND, ND ND, ND 2.3, 2.2 0.8, 1.2 ND, ND ND, ND ND, ND 31.8, 7.5 96.7, 61.1 ND, ND. SMR emrE sugE ydgE ydgF. 0.7, ND 0.7, ND ND, ND 1.0, ND. ORFs. Ratio. ABC ybjY mdlA mdlB yddA yojI yhiH. ND, ND ND, ND 0.7, 0.9 ND, ND ND, ND 0.7, 0.5. MATE ydhE yeeO. 0.8, 0.6 ND, ND. OMF tolC yjcP yohG cusC (ylcB). 2.4, 2.5 ND, ND ND, ND ND, ND. *. Ratio: Ratio of normalized signal intensities of Cy5 (KMY2001) against Cy3 (KMY1) from DNA microarray analysis. Two ratios are shown for each ORF. † H: signal not detected in KMY1, but was significantly detected in KMY2001. ‡ ND: signal not detected. MFS, major facilitator superfamily; RND, resistance-nodulation-cell division family; SMR, small multi-drug resistance family; ABC, ATP-binding cassette family; MATE, multi-drug and toxic compound extrusion family; OMF, outer membrane factor.. For precise estimation of transcription activation of the multi-drug efflux genes in the presence of constitutive evgS1 mutant, S1 mapping was performed for the five genes identified by the microarray assay and the results are shown in Fig. 2(a). For the emrK gene, a single site of transcription initiation was identified in the evgS1 mutant at 109 nt. upstream of the GTG start codon, as previously reported (Kato et al., 2000). For yhiU, three major protection bands, designated as yhiUP1, yhiUP2 and yhiUP3 were detected, at 148, 92 and 87 nt. upstream of the ATG start codon, respectively, only in the evgS1 mutant strain.. Likewise the mdfA mRNA was detected only in the evgS1 mutant when. three times larger amount of RNA was used for S1 mapping.. Transcription initiation. site for mdfA is located at 104 nt. upstream of the initiation codon. 12. Induction of mdfA.
(17) (a). emrK A+G 1 2. C C G G *A G G T T. (b). yhiU A C *A G C A A C. acrA. A+G 1 2. A+G 1 2. mdfA. tolC. A+G 1 2. A+G 1 2. G T P1. G. C. C. A. *T. T. G. T *G G G G T *G A T. P2 P3. T. C. *A. T. T T A C. G T A A *T T G C G G G A *T A C. P1 P2. emrK promoter Inverted repeat for EvgA binding. agtct tcttactaat cctacaggcg taagaattgt attgcaaaag ccacggttta gtcctctgtt gttttttttg 18-bp consensus sequence. cacctcattt aaattaggcc Tccaacgttc . . . .gtg -10 99 nt.. tolC promoter. Putative PhoP box. agcat tgttaatgtc ctggcactaa tagtgaatta aatgtgaatt tcagcgacgt ttgactgccg tttgagcagt -35 P1. P2. catgtgttaa attgaggcac attAacgccc tAtggcacgt aacgccaacc ttttgcggta . . . . atg -10 68 nt.. Fig. 2. (a) S1 mapping of the multi-drug efflux genes. S1 mapping was performed using 100 µg (emrK, yhiU, acrA and tolC) or 300 µg (mdfA) RNA from wild-type KMY1 (lane 1) or evgS1 mutant KMY2001 (lane 2). Transcription start sites are marked with asterisks. Transcripts increased by evgS1 mutation are indicated by arrows. (b) Promoter analysis of emrK and tolC. Transcription start sites determined by S1 mapping are indicated in capital letters. The putative PhoP box (Kato et al., 1999) and the proposed 18-bp consensus sequence for EvgA binding (Masuda & Church, 2002) are boxed. Open arrows indicate the proposed inverted repeat for EvgA binding (Kato et al., 2000).. 13.
(18) by evgS1 mutation was also confirmed by Northern analysis (data not shown).. On the. other hand, transcripts of acrA and tolC were detected in both wild-type and evgS1 mutant even though the level of the major acrA mRNA and the tolCP1 and tolCP2 mRNAs increased in the evgS1 mutant.. Transcription initiation site for the major acrA. mRNA is located at 79 nt. upstream of the start codon in agreement with Martin et al. (1999). As for tolC, the two transcription start sites, tolCP1 and tolCP2, were located at 105 and 97 nt. upstream of the start codon, respectively. Previously Kato et al. (2000) proposed an inverted repeat located in the emrK promoter region between 175 and 200 nt. upstream of the translation start codon as the binding site for EvgA (Fig. 2b).. Similar repeat sequence can be detected in the tolC. and yhiU promoter regions, but not in acrA and mdfA.. On the other hand, Masuda &. Church (2002) proposed an 18-bp inverted repeat motif for EvgA-binding locating between 174 and 191 nt. upstream of the ATG start codon of emrK.. This conserved. motif can be detected in the upstream regions of several highly-induced genes (ydeP, b1500, yegR, emrK, yfdX and yfdW) by overexpression of EvgA. Although this motif is present in the emrK promoter region, it is not in tolC, yhiU, acrA or mdfA. Role of PhoPQ two-component system in tolC transcription. A close examination of the tolC promoter region revealed the presence of a sequence similar to the PhoP box consisting of a direct repeat of (T/G)GTTTA (Kato et al., 1999) between -44 and -29 upstream of the P1 promoter (Fig. 2b). The regulator PhoP of the PhoPQ two-component system for response to the availability of external Mg2+ is known to bind directly to this box and regulates transcription of Mg2+-responsive genes (Yamamoto et al. , 2002;. Minagawa et al. , 2003).. We then. analyzed possible influence of PhoP on tolC transcription. EvgAS-dependent up-regulation from the P2 promoter of tolC (Fig. 3a, lanes 1 and 2) was markedly decreased in the absence of PhoP or PhoQ (Fig.3a, lanes 4 and 6), indicating that the PhoPQ system is also involved in transcription activation of the tolC gene. Deleting phoPQ from the wild-type strain also resulted in a decrease in the level of tolC transcription (Fig. 3a, lanes 1, 3 and 5). We then suspected a signal transduction from the activated sensor EvgS to the regulator PhoP, referred to as “cross-talk” between the two systems. 14. To check this.
(19) (a). (b) A+G 1 2. 3 4. 5 6. (c) A+G 1 2. P1. P1 P2. P2. A+G 1 2. P1 P2. Fig. 3. S1 mapping of tolC. (a) Transcriptional level of tolC in the phoP and phoQ deleted evgS1 mutant. Lanes 1, KMY1; 2, KMY2001 (evgS1); 3, KMP1 (phoP); 4, KMP2001 (phoP, evgS1); 5, KMQ1 (phoQ); 6, KMQ2001 (phoQ, evgS1). (b) Transcriptional level of tolC in evgA-overexpressed strain. Lanes 1, KMY1/pA191 (induced with arabinose); 2, KMY1/pA191 (not induced with arabinose). (c) Transcriptional level of tolC in phoP-overexpressed strain. Lanes 1, KMY1/pMW119; 2, KMY1/pHO119.. (a). EvgA. EvgA+acetyl-P. evgA P1,2. emrKP. EvgA. (b). EvgA+acetyl-P. yhiU P1 yhiU P2 yhiU P3. Fig. 4. Effect of phosphorylated EvgA on in vitro transcription of emrK and yhiU. DNA templates containing promoter regions of emrK (a) and yhiU (b) were incubated with EvgA, RNA polymerase, and with or without the presence of acetylphosphate. Samples were subjected to electrophoresis on 6% polyacrylamide sequencing gel. Transcripts originating from each promoter(s) are indicated by arrows.. 15.
(20) possibility, evgA was overexpressed from an arabinose promoter.. Even in the. wild-type evgS background, up-regulation of tolC was observed after expression of an excess amount of EvgA (Fig. 3b), indicating that cross-talk between EvgS and PhoP was not the major pathway of the regulation in concern. However, a very modest increase in transcription from the P2 promoter was found when the phoQ mutant and evgS1, phoQ mutant were compared (Fig. 3a, lanes 5 and 6).. This increase may derive from a. cross-talk between EvgS and PhoP, although we were not able to detect in vitr o phosphotranfer from EvgS to PhoP (data not shown).. Increase in transcription of tolC. from overproduction of EvgA has also been mentioned by Masuda & Church (2002) and Nishino et al. (2003). In our array results, the evgS1 mutant resulted in increase in transcription of phoP and phoQ, as well as other known PhoP regulons such as mgtA and mgrB (Minagawa et al., 2003). Therefore, we next suspected a simple cascade of signal transduction where the increased level of PhoP by the EvgAS system enhances the transcription of tolC. Transformation of the wild-type strain with a plasmid containing the phoPQ genes increased the transcriptional level of phoP to the level found in the evgS1 mutant (data not shown), but did not increase the transcriptional level of tolC (Fig. 3c), denying the involvement of the simple cascade. Signal transduction from the EvgAS to the PhoPQ system is currently under investigation.. In addition, direct binding of EvgA to the tolC. promoter was not detected in our DNase I footprinting analysis (data not shown). Activation by EvgA of in vitro transcription of emrK. To confirm the transcription activation of multi-drug efflux genes, emrKY and yhiUV, by phosphorylated EvgA, transcription in vitr o of truncated DNA templates containing either the emrK or yhiU promoter region was carried out in the presence or absence of EvgA, which was phosphorylated by acetylphosphate.. As shown in Fig.. 4(a), transcription of emrK was activated 2.3-fold by the addition of 100 pmol of EvgA without prior-treatment with acetylphosphate.. In the presence of acetylphosphate,. however, the transcription was activated 4.3-fold by 100 pmol of EvgA, indicating that the phosphorylated EvgA directly activates emrK transcription. On the other hand, the increased amount of EvgA did not enhance transcriptional level of evgA, which is transcribed divergently from emrK, neither in the absence nor presence of 16.
(21) acetylphosphate.. This result is consistent with our S1 mapping (Fig. 1) and array. results (expression ratio of evgA; 0.82, 0.66) indicating once again that transcription of evgA is not enhanced by the activation of EvgS. Transcription in vitro was also carried out for the yhiU promoter.. Addition of. both EvgA and phosphorylated EvgA did not show any effect on transcription of yhiU (Fig. 4b). We have also performed DNaseI footprinting analysis of EvgA against the promoter region of yhiU, but failed in detecting direct binding of EvgA (data not shown). These results suggested that yhiU transcription is either indirectly regulated by EvgA or requires an additional factor.. Discussion It has been reported that overexpression of the regulator EvgA confers multi-drug resistance (MDR) to a drug-hypersusceptible E. coli strain, which lacks the major multi-drug efflux pump gene, acrB (Nishino & Yamaguchi, 2001a, 2002), and acid resistance to exponentially growing cells (Masuda & Church, 2002). In addition to the up-regulation of the multi-drug efflux genes confirmed in the present study, activation of EvgS also up-regulated the acid resistance-related genes, gadABC, hdeAB, ydeP, ydeO and yhiE (supplementary data, http://www.nara.kindai.ac.jp/nogei/seiken/array2.html) as in the EvgA overexpressed strain (Masuda & Church, 2002). We have found that acid resistance is also conferred to an exponentially grown evgS1 mutant (data not shown).. Although as many as 225 ORFs were positively regulated by the EvgS. activation from our array data, only 79 ORFs were identified from the array data reported for an EvgA overexpressing strain (Masuda & Church, 2002).. This difference. mostly comes from how the positive ORFs were selected: we chose ORFs with changes of twofold or more, Masuda and Church chose those with changes of more than fourfold (133 ORFs showed changes of more than fourfold in our array).. Another reason may. be that the activation of the EvgAS system regulates the EvgAS-regulated genes more efficiently than by the overproduction of EvgA.. In fact, transcriptional levels of tolC. were higher in the evgS1 mutant than in the EvgA overexpressed strains in our S1 mapping (Fig. 3a lane 2 and Fig. 3b lane 1). A difference in the microarray employed. 17.
(22) may also contribute to the difference in sensitivity.. Whereas Masuda and Church used. an array of short oligonucleotides, we used an array of full-length ORFs.. Longer. nucleotides on the array will result in higher intensity of signals, resulting to better detection of ORFs with low expression. However, when the genes most affected were compared, the two array data were highly similar, in spite of the differences in the strains and arrays used.. This confirms that the overproduction method is valid for. analyzing the EvgAS system, and the overproduction method can probably be employed for other non-activated two-component systems. MDR was conferred by EvgS activation in the present study, clearly indicating the involvement of the EvgAS system to MDR.. From our drug susceptibility tests. (Table 3), the MDR phenotype conferred by the evgS1 mutation required TolC. Although EmrKY, YhiUV and AcrAB are three-component efflux pumps requiring TolC for their activity (Nishino & Yamaguchi, 2002; Fralick, 1996), MdfA is a single-component efflux pump not requiring TolC (Edgar & Bibi, 1997, 1999). Thus, contribution of the increased expression of MdfA to the MDR found in the present condition was considered to be small.. However, since single-component pumps such. as MdfA can cooperate with three-component pumps with the latter presumably pumping out the drugs from the periplasm (Lee et al. , 2000), possibility of MdfA cooperating with the YhiUV and EmrKY pumps still remains.. Furthermore, since. KMY2001 did not show prominent resistance compared with KMY1, contribution of AcrAB was considered as negligible. Therefore, the MDR conferred by the evgS1 mutation was suggested to be mainly caused by the orchestrated expression of emrKY, yhiUV, and tolC.. Overexpression of EmrKY results in resistance against deoxycholate,. and overexpression of YhiUV to resistance against rhodamine6G, erythromycin, doxorubicin, ethidium bromide, tetraphenylphosphonium bromide, SDS, deoxycholate, crystal violet, and benzalkonium (Nishino & Yamaguchi, 2001b). The variety of drugs to which the evgS1 mutant showed resistance fits well with the proposed drugs extruded by EmrKY and YhiUV. We have also shown that the phosphorylated form of EvgA increased the in vitro transcription of emrKY (Fig. 4a), indicating a direct regulation of emrKY by the EvgAS system.. The other pump, yhiUV, was not up-regulated solely by phosphorylated EvgA. (Fig. 4b), thus suggesting the participation of other transcriptional factors. 18. From our.
(23) microarray analysis, a number of transcriptional factors such as ydeO, yhiF, and yhi E were up-regulated in the evgS1 mutant (supplementary data, http://www.nara. kindai.ac.jp/nogei/seiken/array 2.html).. These factors may be involved in the direct. regulation of yhiUV. It has been reported that TolC is a member of the Mar-Sox-Rob regulon and contains a consensus sequence of the Mar-Sox-Rob box at a location upstream (-96 to -73) of the structural tolC gene (Aono et al., 1998).. The putative Mar-Sox-Rob box is. located just downstream of the tolC P2 (Fig. 2b).. Together with our array results. indicating a decreased level of marA transcripts by the evgS1 mutation (expression ratio; 0.18, 0.25), unchanged rob level (1.3, 1.4), and non-detectable soxS level, the up-regulation of tolC by EvgAS is considered to be independent of the global regulators, MarA, SoxS or Rob. In this study, we have found that the PhoPQ system, involved in the adaptation to Mg2+ limiting environments by regulation of genes related to Mg2+ transport and LPS modification (Groisman, 2001), was essential to the regulation of tolC by EvgAS. This regulation did not involve cross-talk between EvgS and PhoP, nor a simple cascade due to an increase in the PhoP level. Another cascade of signal transduction, in which the phosphorylated EvgA activates the PhoPQ system followed by the up-regulation of tolC, was suggested (Fig.3).. Such a cascade between different. two-component systems has been reported between PhoPQ and PmrAB systems via the pmrD gene in Salmonella (Groisman, 2001). In the present study, our data suggested that the activation of the sensor EvgS initiated a transcriptional network with the phosphorylated EvgA serving as the master regulator, and have led to MDR by a coordinated transcription of emrKY, yhiUV , and tolC . Further investigation of this network will clarify the biological function of the EvgAS system, and identify the environmental signal to which EvgS responds. These findings will contribute to deepen our knowledge of the mechanism underlying the occurrence of MDR.. 19.
(24) II-2 Construction a. nd character ization of the. promoter- gfp reporter. plasmid collection of multi-drug resistance pump genes in Escherichia coli Introduction Drug efflux mechanisms have become broadly recognized as major components of resistance to many classes of antibiotics.. Some efflux pumps selectively extrude. specific antibiotics, while others referred to as multi-drug resistance (MDR) pumps expel a variety of structurally diverse compounds with differing antibacterial modes of action.. Antibiotic-specific efflux pumps are usually encoded on transmissible. plasmids and transposons, while genes encoding many MDR pumps are normal constituents of bacterial chromosomes.. Thus, bacteria have the potential to develop. multi-drug resistance without acquisition of multiple specific resistance determinants (Lomovskaya & Watkins, 2002). In E. coli, analysis of the complete genome sequence has revealed as many as 37 putative MDR pump genes (selected on the basis of sequence similarities; Paulsen, 1998; Nishino & Yamaguchi, 2001b), which are classified into five types; MFS (major facilitator superfamily), RND (resistance nodulation cell division), ABC (ATP-binding cassette), SMR (small muti-drug resistance) and MATE (multi-drug and toxic compound extrusion). However, in the microarray result of E. coli shown in Table 4 of Chapter II-1, only eleven out of the predicted 37 pump genes were significantly expressed in the wild type cells grown to mid-log phase in LB medium.. Although we. do not know whether the remaining pump genes will ever have the chance to be expressed, these genes are still regarded as a potential threat of developing future MDR. It is important to point out that most of the former studies on MDR pump genes expression were performed under laboratory condition (aerobic rich media, log phase). Since E. coli in its natural habitat is exposed to diverse environmental condition, changing the growth condition, growth phase, or adding various substrates may induce the expression of the remaining transporters. Thus an efficient screening method for detecting the expression of MDR pump genes responding to environmental cue will be useful for gaining insight into how these pumps participate in the development of MDR. In the present study, promoters of each of the 37 putative drug transporter genes in E. coli were ligated to a reporter gene (GFP, green fluorescent protein), in order to analyze their transcriptional activity. By use of this complete set of promoter-gfp reporter constructs, expression of the 37 MDR pump genes were analyzed under various 20.
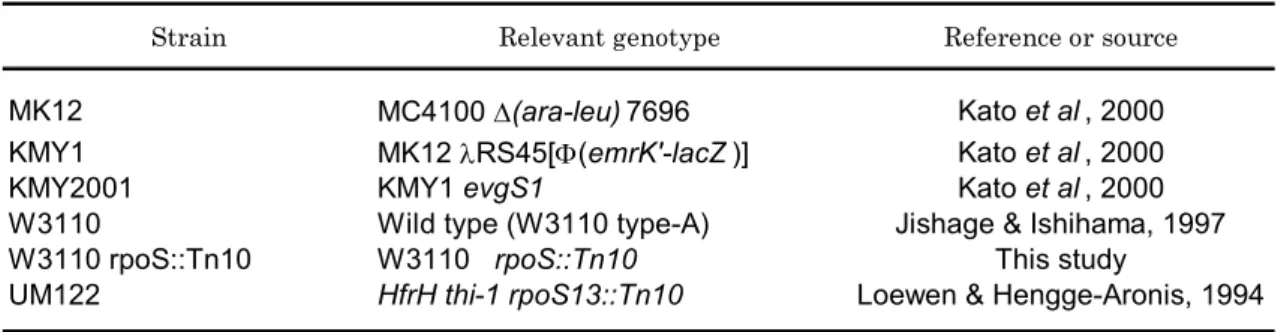
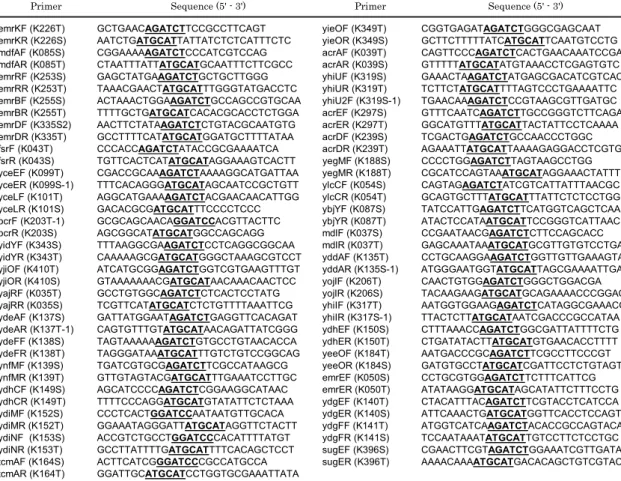
(25) growth conditions. Materials and Methods Bacterial strains and growth condition. The E. coli strains used in this study are listed in Table 1. Construction of rpoS mutant of W3110 was performed by P1 transduction with UM122 as the donor strain. Strains were grown at 30 or 37°C in Luria-Bertani (LB) medium (pH 7.5), containing 1% Bacto Tryptone (Difco), 0.5% Bacto Yeast Extract (Difco),and 1% NaCl. Ampicillin at 100 g/ml was added to the medium for selection. Table 1 Bacterial strains Strain. Relevant genotype. MK12 KMY1 KMY2001 W3110 W3110 rpoS::Tn10 UM122. MC4100 (ara-leu) 7696 MK12 RS45[(emrK'-lacZ )] KMY1 evgS1 Wild type (W3110 type-A) W3110 rpoS::Tn10 HfrH thi-1 rpoS13::Tn10. Reference or source. Kato et al , 2000 Kato et al , 2000 Kato et al , 2000 Jishage & Ishihama, 1997 This study Loewen & Hengge-Aronis, 1994. Plasmid construction. Putative promoter regions of MDR pumps were amplified by PCR with genomic DNA from strain W3110 and the primers listed in Table 2.. These primers contain. EcoT22I, BglII or BamHI sites (underlined) suitable for cloning.. The PCR products. were digested with restriction enzymes and then ligated into the EcoT22I and BglII sites of pGMI301 (Fig. 1A). The inserted region of the constructed plasmid was confirmed by sequencing, and the plasmid was named as pGMI-“gene name”, where the “gene name” stands for the gene corresponding to the inserted promoter. GFP fluorescence assay. The reporter plasmids were transformed into strains KMY1, KMY2001, W3110 or W3110rpoS::Tn10 for the assay. The transformed strains were grown on LB agar medium (1.5% agar) (solid culture), in 10 ml of LB medium with constant aeration (liquid culture with agitation), or in 10 ml LB medium without aeration (liquid culture without agitation). 21. Each medium contained ampicillin for selection.. For liquid.
(26) cultures, 1 ml of the cell culture was sampled at appropriate time points.. Cells were. harvested by centrifugation, washed once with phosphate-buffered saline without Mg2+ [PBS(-)], and resuspended in PBS(-) to give a cell density of OD600 = 0.6 – 0.8.. As for. solid cultures, colonies were collected with a sterilized toothpick and were suspended in PBS(-) to an OD600 of 0.6 – 0.8.. For the measurement of fluorescence, 0.3 ml of the. cell suspension was applied to 0.4 × 96 flat-bottomed wells, and the fluorescence was measured with Wallac 1420 ARVOsx ( PerkinElmerTM life sciences) at an excitation of 485 nm and an emission of 535 nm.. The fluorescent intensity of each sample was. divided by its OD600 value for normalization, and the value of the control strain (W3110/pGMI301) was subtracted as the background.. Table 2. PCR primers Primer emrKF (K226T) emrKR (K226S) mdfAF (K085S) mdfAR (K085T) emrRF (K253S) emrRR (K253T) emrBF (K255S) emrBR (K255T) emrDF (K335S2) emrDR (K335T) fsrF (K043T) fsrR (K043S) yceEF (K099T) yceER (K099S-1) yceLF (K101T) yceLR (K101S) bcrF (K203T-1) bcrR (K203S) yidYF (K343S) yidYR (K343T) yjiOF (K410T) yjiOR (K410S) yajRF (K035T) yajRR (K035S) ydeAF (K137S) ydeAR (K137T-1) ydeFF (K138S) ydeFR (K138T) ynfMF (K139S) ynfMR (K139T) ydhCF (K149S) ydhCR (K149T) ydiMF (K152S) ydiMR (K152T) ydiNF (K153S) ydiNR (K153T) tcmAF (K164S) tcmAR (K164T). Sequence (5' - 3') GCTGAACAGATCTTCCGCCTTCAGT AATCTGATGCATTATTATCTCTCATTTCTC CGGAAAAAGATCTCCCATCGTCCAG CTAATTTATTATGCATGCAATTTCTTCGCC GAGCTATGAAGATCTGCTGCTTGGG TAAACGAACTATGCATTTGGGTATGACCTC ACTAAACTGGAAGATCTGCCAGCCGTGCAA TTTTGCTGATGCATCACACGCACCTCTGGA AACTTCTATAAGATCTCTGTACGCAATGTG GCCTTTTCATATGCATGGATGCTTTTATAA CCCACCAGATCTATACCGCGAAAATCA TGTTCACTCATATGCATAGGAAAGTCACTT CGACCGCAAAGATCTAAAAGGCATGATTAA TTTCACAGGGATGCATAGCAATCCGCTGTT AGGCATGAAAAGATCTACGAACAACATTGG GACACGCGATGCATTTCCCCTCCC GCGCAGCAACAGGATCCACGTTACTTC AGCGGCATATGCATGGCCAGCAGG TTTAAGGCGAAGATCTCCTCAGGCGGCAA CAAAAAGCGATGCATGGGCTAAAGCGTCCT ATCATGCGGAGATCTGGTCGTGAAGTTTGT GTAAAAAAACGATGCATAACAAACAACTCC GCCTGTGGCAGATCTCTCACTCCTATG TCGTTCATATGCATCTCTGTTTTAAATTCG GATTATGGAATAGATCTGAGGTTCACAGAT CAGTGTTTGTATGCATAACAGATTATCGGG TAGTAAAAAAGATCTGTGCCTGTAACACCA TAGGGATAAATGCATTTGTCTGTCCGGCAG TGATCGTGCGAGATCTTCGCCATAAGCG GTTGTAGTACGATGCATTTGAAATCCTTGC AGCATCCCCAGATCTCGGAAGGCATAAC TTTTCCCAGGATGCATGTATATTCTCTAAA CCCTCACTGGATCCAATAATGTTGCACA GGAAATAGGGATTATGCATAGGTTCTACTT ACCGTCTGCCTGGATCCCACATTTTATGT GCCTTATTTTGATGCATTTTCACAGCTCCT ACTTCATCGGGATCCCGCCATGCCA GGATTGCATGCATCCTGGTGCGAAATTATA. Primer yieOF (K349T) yieOR (K349S) acrAF (K039T) acrAR (K039S) yhiUF (K319S) yhiUR (K319T) yhiU2F (K319S-1) acrEF (K297S) acrER (K297T) acrDF (K239S) acrDR (K239T) yegMF (K188S) yegMR (K188T) ylcCF (K054S) ylcCR (K054T) ybjYF (K087S) ybjYR (K087T) mdlF (K037S) mdlR (K037T) yddAF (K135T) yddAR (K135S-1) yojIF (K206T) yojIR (K206S) yhiIF (K317T) yhiIR (K317S-1) ydhEF (K150S) ydhER (K150T) yeeOF (K184T) yeeOR (K184S) emrEF (K050S) emrER (K050T) ydgEF (K140T) ydgER (K140S) ydgFF (K141T) ydgFR (K141S) sugEF (K396S) sugER (K396T). Primers contain Eco T22I, Bgl II or Bam HI sites (bold letters and underlined) suitable for cloning.. 22. Sequence (5' - 3') CGGTGAGATAGATCTGGGCGAGCAAT GCTTCTTTTTATCATGCATTCAATGTCCTG CAGTTCCCAGATCTCACTGAACAAATCCGA GTTTTTATGCATATGTAAACCTCGAGTGTC GAAACTAAGATCTATGAGCGACATCGTCAC TCTTCTATGCATTTTAGTCCCTGAAAATTC TGAACAAAGATCTCCGTAAGCGTTGATGC GTTTCAATCAGATCTTGCCGGGTCTTCAGA GGCATGTTTATGCATTACTATTCCTCAAAA TCGACTGAGATCTGCCAACCCTGGC AGAAATTATGCATTAAAAGAGGACCTCGTG CCCCTGGAGATCTTAGTAAGCCTGG CGCATCCAGTAAATGCATAGGAAACTATTT CAGTAGAGATCTATCGTCATTATTTAACGC GCAGTGCTTTATGCATTTATTCTCTCCTGG TATCCATTGAGATCTTCATGGTCAGCTCAA ATACTCCATAATGCATTCCGGGTCATTAAC CCGAATAACGAGATCTCTTCCAGCACC GAGCAAATAAATGCATGCGTTGTGTCCTGA CCTGCAAGGAAGATCTGGTTGTTGAAAGTA ATGGGAATGGTATGCATTAGCGAAAATTGA CAACTGTGGAGATCTGGGCTGGACGA TACAAGAAGATGCATGCAGAAAACCCGGAC AATGGTGGAAGAGATCTCATAGGCGAAACG TTACTCTTATGCATAATCGACCCGCCATAA CTTTAAACCAGATCTGGCGATTATTTTCTG CTGATATACTTATGCATGTGAACACCTTTT AATGACCCGCAGATCTTCGCCTTCCCGT GATGTGCCTATGCATCGATTCCTCTGTAGT CCTGCGTGGAGATCTTCTTTCATTCG ATATAAGGATGCATAGCATATTCTTTCCTG CTACATTTACAGATCTTCGTACCTCATCCA ATTCAAACTGATGCATGGTTCACCTCCAGT ATGGTCATCAAGATCTACACCGCCAGTACA TCCAATAAATATGCATTGTCCTTCTCCTGC CGAACTTCGTAGATCTGGAAATCGTTGATA AAAACAAAATGCATGACACAGCTGTCGTAC.
(27) B. A. pGMI301 eGFP coding gene. rrnB. Promoter regions selected for this study. 1. Approx. 500 bp upstream of the ATG start codon: ydhE. EcoT22I rrnB. pGMIydhE. BglII PCR Fragment. bla. 2. Genes constituting an operon:. promoter region BglIIor BamHI. emrK. EcoT22I. emrY. pGMIemrK. Ligation eGFP coding gene. rrnB. 3. Genes with multiple promoters: emrR. promoter. pGMIemrR. rrnB. emrB. pGMIemrB yhiU. yhiE. bla. emrA. yhiV. pGMIyhiU1 pGMIyhiU2. pGMI-gene name. Fig.1 Construction of promoter-gfp reporter plasmids. Results and Discussion Construction of the promoter collection of MDR pump genes. For a comprehensive study of the expression of MDR pump genes, promoters of the putative 37 genes were ligated to an eGFP coding gene (Clontech) in pGMI301 (Makinoshima et al ., 2002) as described in Fig. 1A.. Since promoters of most of the. putative MDR pump genes are still not determined, DNA fragments spanning from the ATG start codon to approximately 500 bp upstream of the ATG start codon were used as putative promoter regions.. For genes constituting an operon, the promoter of the. operon was selected, and the name of the first gene in the operon was used for naming the reporter plasmid (Fig. 1B).. However, in the case of emrB and yhiV pumps,. additional promoters are reported or predicted within the operon.. Thus, two reporter. plasmids were constructed for each of these pumps; pGMIemrR and pGMEemrB for emrB (Lomovskaya et al., 1995)) and pGMIyhiU1 and pGMIyhiU2 for yhiV (Chapter II-1, Masuda & Church, 2003). A total of 38 reporter-plasmids were constructed (two plasmids each for emrB and yhiV; only one plasmid for yegMNO and yegB because these two pump genes constitute a yegMNOB operon). As discussed in Chapter II-1, the two-component system, EvgA/EvgS, regulates 23.
(28) the expression of the emrKY pump genes.. In an aim to confirm that the promoter-gfp. reporter plasmid constructed in this study responds to the known regulation, the promoter activity of emrKY was assayed in an EvgS activated strain (evgS1 mutant). The EmrY pump belongs to the MFS family and requires the membrane fusion protein, EmrK, for its activity. Since emrK and emrY constitute an operon, pGMIemrK was constructed for analyzing their promoter activity.. As shown in Fig. 2A, GFP. fluorescent intensity was apparently higher in KMY2001(evgS1 mutant) / pGMIemrK than in KMY1 (wild type) / pGMIemrK, when cells were grown on LB agar medium for approximately 20 hr at both 30 and 37°C.. In liquid culture with agitation,. KMY2001/pGMIemrK showed higher fluorescent intensity than KMY1/pGMIemrK at 30°C, but the difference between the two strains was not significant at 37°C.. This may. be due to involvement of another emrKY promoter, which is unrelated to regulation by the EvgA/EvgS system.. Furthermore, expression of emrKY in the evgS1 mutant has. been shown to be temperature-dependent; activated at 30°C and repressed at 42°C (Kato, The emrKY promoter activity in KMY2001/pGMIemrK was also activated at. 2000).. 30°C in both culture methods (Fig. 2).. Thus these results indicated that the. reporter-plasmid actually responded to the EvgA/EvgS system and validated the reporter plasmids of MDR pump genes constructed in this study.. A. B ×104 4 Fluorescent intensity / OD600. Fluorescent intensity / OD600. ×104 4. 3. 2. 1. 30℃. 3. 2. 1. 37℃. 30℃. 37℃. Fig. 2 GFP-fluorescence assay of emrK promoter. Cells were incubated at 30 or 37℃for approximately 20 hr prior to the assay. Intensity of GFP fluorescence was normalized by its respective OD600 value. Values represent the mean ± standard error of three independent experiments. A, solid culture; B, liquid culture with agitation. Open columns, KMY1(parent)/pGMIemrK; solid columns, KMY2001(evgS1 mutant)/pGMIemrK.. 24.
(29) Characterization of MDR pump gene expression. The 38 reporter-plasmids were transformed into W3110, a wild type strain of E. coli, and the transformants were grown for 7 days at 37°C under three different conditions; A, solid culture (representing bacterial growth on a surface); B, liquid culture with agitation (aerobic growth); C, liquid culture without agitation (micro-aerobic growth). Samples were taken and their fluorescence assayed at 1, 2, 3, 5 and 7 days after inoculation. During the 7-day cultivation, promoter activity was detected from 28 out of the 38 reporter-plasmids (corresponding to 27 MDR pump genes, summarized in Table 3). Promoters of all the members of the MATE and SMR families were activated, whereas only seven out of the 19 pumps of the MFS family were activated.. Promoter activity. was also detected from five out of the six pumps of the RND family, and four out of the five pumps of the ABC family.. To our regret, no activity was found from reporter. plasmids of the remaining ten MDR pumps in any of the culture method. This may be due to the absence of specific inducing signals such as activation of the EvgA/EvgS system for pGMIyhiU2 or the BaeR/BaeS system for pGMIyegM (Nagakubo et al., 2002; Baranova & Nikaido, 2002). Another reason may be that the inserted promoter region. did not carry the complete promoter region.. Nevertheless, promoter activities. of as many as 28 reporter plasmids were detected, indicating that these promoters do possess the ability to express.. This increase in the number of expressing genes. compared to those detected from the microarray (Table 4 of Chapter II-1) may be due to the longer cultivation period and to the multiple copies of reporter-plasmid in the cell. The promoter activities during the 7-day cultivation for eighteen promoters (the remaining ten only showed low activities) are shown in Fig. 3.. Strain. W3110/pGMIacrA showed the highest expression among the tested promoters, as was expected since the AcrAB pump is known as the major MDR pump in E. coli.. High. promoter activity was also found in plasmids, pGMIemrR, pGMIyhiI, pGMIydgF, pGMIydhE and pGMIydiN.. Preference in cultivation methods in terms of promoter. activation differed among the promoters.. Among the eighteen promoters in Fig. 4,. cells grown in either solid culture or liquid culture with agitation showed the highest activity, whereas liquid culture without agitation showed the lowest activity. However, not much difference among the cultivation methods was observed for the ten low-expressing promoters (Table 3). promoters may prefer anaerobic growth. 25. There is a possibility that some of these.
(30) Table 3 Promoter activity of drug efflux genes during the 7-day cultivation Type RND. ABC. Gene. Reporter plasmid. acrAB yhiUV (mdtEF) yhiUV (mdtEF) acrEF acrD yegMNO (mdtABC) cusA. (pGMIacrA). ybjYZ (macAB) mdl yddA yojI yhiH. (pGMIybjY). (pGMIyhiU) (pGMIyhiU2) (pGMIacrE) (pGMIacrD) (pGMIyegM) (pGMIylcC). (pGMImdl) (pGMIyddA) (pGMIyojI) (pGMIyhiI). MATE ydhE (mdtK) yeeO. (pGMIydhE). SMR emrE ydgE (mdtI) ydgF (mdtJ) sugE. (pGMIemrE). (pGMIyeeO). (pGMIydgE) (pGMIydgF) (pGMIsugE). Maximum activity* A. B. C. ++++ + + ++ ++. +++ + + +. + + ++++. + + +++. + + +. +++ ++. +++ ++. ++ +. ++ ++ +++ ++. + ++ ++++ +. + + ++ -. ++++** + + ++ +. Type MFS. Gene emrKY mdfA emrAB emrAB emrD fsr yceE (mdtG) yceL (mdtH) bcr yidY (mdtL) yjiO (mdtM) yajR ydeA ydeF ynfM ydhC ydiM ydiN tcmA yieO. Reporter plasmid. (pGMIemrK) (pGMImdfA) (pGMIemrR) (pGMIemrB) (pGMIemrD) (pGMIfsr) (pGMIyceE) (pGMIyceL) (pGMIbcr) (pGMIyidY) (pGMIyjiO) (pGMIyajR) (pGMIydeA) (pGMIydeF) (pGMIynfM) (pGMIydhC) (pGMIydiM) (pGMIydiN) (pGMItcmA) (pGMIyieO). Maximum activity A. B. + + ++++ + + + ++ +++ +. ++ + +++ ++ + + + ++ + ++ +. *: The maximum activity of each promoter during the 7-day assay is indicated. A, solid culture; B, liquid culture with agitation; C, liquid culture without agitation. **: The activity (GFP fluorescence intensity / OD600) is classified into 5 ranks: -, 0 - 1,000; +, ,000 - 10,000; ++, 10,000 - 50,000; +++, 50,000 - 100,000; ++++, >100,000. Genes or operons in bold letters indicate pumps whose expression was detected in a microarray analysis of mid-exponential phase cells (Chapter II-1).. 26. C. + + + + + + + + + +.
(31) Fluorescent intensity / OD600 Fluorescent intensity / OD600. ×104 20. W3110 / pGMIacrA. W3110 / pGMIemrR. ×104 40 30. 15. 20. 20. 10. 10. 10. 5. 1. 2. 3. days. 5. 7. W3110 / pGMIydgF. 0. 1. 2. 3. days. 5. 7. W3110 / pGMIydhE. ×104 20. W3110 / pGMIyhiI. ×104 20. 30. 0. 0. 1. 15. 15. 10. 10. 10. 5. 5. 5. 1. 2. 3. days. 5. 7. W3110 / pGMIacrD. ×104 5. 0. 1. 2. 3. days. 5. 7. W3110 / pGMIydgE. ×104 3. 0. 2. 3. days. 5. 7. W3110 / pGMIydiN. ×104 20. 15. 0. 1. 2. 3. days. 5. 7. W3110 / pGMIemrE. ×104 3. 4 3 2. 2. 2. 1. 1. 1 0. 1. 2. Fluorescent intensity / OD600. 3. days. 5. 7. W3110 / pGMIynfM. ×104 3. Fluorescent intensity / OD600. Fluorescent intensity / OD600. Fluorescent intensity / OD600. ×104 40. 0. 1. 2. 3. days. 5. 7. W3110 / pGMIyeeO. ×104 3. 0. 1. 2. 2. 1. 1. 1. 0. 1. 2. ×104. 3. days. 5. 7. W3110 / pGMIylcC. 2. 0. 1. 3. days. 5. 7. W3110 / pGMIsugE. ×104 1.5. 1.5. 2. 0. 1. 1. 0. 5. 0. 5. days. 5. 7. 2. 3. days. 5. 7. W3110 / pGMIyieO. ×104 1.5. 1. 3. W3110 / pGMIemrK. ×104 3. 2. 2. 1 0. 5 0. 1. 2. 3. days. 5. 7. W3110 / pGMIemrB. ×104 1.5. 0. 1. 2. 3. days. 5. 7. W3110 / pGMIyojI. ×104 1.5. 0. 1. 1. 0. 5. 0. 5. 0. 5. 1. 2. 3. days. 5. 7. 0. 1. 2. 3. days. 5. 7. 0. 2. 3. days. 5. 1. 2. 3. days. 5. Fig. 3 Promoter activity of drug efflux genes during the 7-day cultivation Cells were cultured at 37 ℃ by three methods; diamonds, solid culture; squares, liquid culture with agitation; triangles, liquid culture without agitation. Intensity of GFP fluorescence was normalized by its respectiveOD600 value. Values represent the mean of two independent experiments. Note that scales of the y-axes differ among graphs.. 27. 7. W3110 / pGMIyjiO. ×104 1.5. 1. 0. 1. 7.
(32) pGMIydgF. 300000. Fluorescent intensity / OD600. Fluorescent intensity / OD600. pGMIydgE 60000. 40000. 20000. 0 1. 2. 3. 5. days. 200000. 100000. 7. 0 1. 3. days. 5. 7. pGMIacrA. 600000. Fluorescent intensity / OD600. 2. Fig. 4 Effect of rpoS-deletion on the promoter activity of ydgE and ydgF. 400000. Cells were grown at 37 ℃ in liquid cultures with agitation. Open squares, plasmids transformed intoW3110; solid squares, plasmids transformed into W3110rpoS::Tn10. Values represent the mean of two independent experiments. Note that scales of the y-axes differ among graphs.. 200000. 0 1. 2. 3. days. 5. 7. During the 7-day cultivation, the maximum activity was mostly observed on day 1 or 2. Since GFP accumulates in the cell, most of these promoters were considered to be activated during exponential or early stationary phase. However, in the case of W3110/pGMIydgF and W3110/pGMIydgE, the maximum activity was found on day 3 in solid culture and in liquid culture with agitation.. The increase in GFP fluorescent. intensity from day 2 to 3 clearly shows expression of the ydgF and ydgE promoter during this stationary phase. The genes ydgF and ydgE constitute an operon, and encode YdgFE, a two-component type SMR transporter (Jack et al. , 2000). Overexpression of YdgFE conferred resistance to deoxycholate, nalidixic acid, fosfomycin and SDS (Nishino & Yamaguchi, 2001b). One cellular factor related to stationary phase is the alternative sigma factor RpoS. In order to check whether RpoS was involved in the expression of the ydgF and ydgE promoters at stationary phase, pGMIydgF and pGMIydgE were transformed into an rpoS-deleted strain.. When the strains were grown in liquid medium with agitation,. the intensity of GFP fluorescence in the rpoS-deleted strains began to decrease from day 3, whereas that in the wild type strains did not begin to decrease until day 5 or 7 (Fig. 4).. On the other hand, when pGMIacrA was transformed, no prominent change. in expression pattern was found between rpoS-deleted and wild type strains (Fig. 4). These results indicated that RpoS is involved in the expression of promoters of the 28.
(33) ydgF and ydgE genes at stationary phase. Conclusions In the present study, a full set of promoter-gfp reporter constructs of the putative 37 MDR pump genes in E. coli was completed. By using this collection, expression of as many as 27 out of the 37 genes was detected, demonstrating that these genes indeed possessed the potential of contributing to the MDR phenotype. A variety of expression patterns throughout the 7-day incubation period was observed among the promoters, suggesting the influence of environmental factors upon the expression of MDR pump genes.. Specifically, promoters of ydgFE were activated later in the stationary phase,. which involved the alternative sigma factor, RpoS.. These results indicated that. induction of the MDR pump genes was influenced by various growth conditions and the present collection of reporter plasmids should serve as an efficient tool in screening such conditions.. 29.
(34) Chapter III Signal transduction network regulated by system in Escherichia coli III-1 Signal transduction cascade betw. the EvgA/Ev. gS. een Evg A/EvgS an d PhoP/PhoQ. systems in Escherichia coli Introduction The two-component signal transduction system is the major system in bacteria for sensing environmental stresses and transducing the information inside the cells for adaptation. This system is basically composed of a histidine kinase sensor residing in the inner membrane and a cognate response regulator in the cytoplasm. In Escherichia coli, 29 histidine kinase sensors, 32 response regulators, and one HPt (histidine containing phosphotransmitter) domain have been found by analysing the E. coli K-12 genome (Mizuno, 1997).. Each sensor responds to individual environmental stresses to. cope with the numerous environmental conditions that E. coli faces; however, 29 sensors are apparently insufficient and it is posited that there exists a complex regulatory network between the two-component systems (Oshima, 2002b). Transcriptome analysis using the microarray technique is an extremely efficient method for analyzing regulatory networks. Oshima et al. (2002b) performed a global analysis of two-component regulatory system mutants of E. coli K-12 for a single growth condition (Luria-Bertani medium, aerobic, mid-exponential phase) and proposed the existence of a network of functional interactions, such as cross talks and cascade signal transductions between the systems.. In their study, some of the 36. two-component deletion mutants showed little or no change in their mRNA profiles, indicating that these two-component systems were not strongly operating under their culture condition. One of these low or non-operating systems in mid-exponential phase cells grown in a rich medium, is the EvgA/EvgS system.. The EvgA/EvgS system in E. coli is. highly similar to the BvgA/BvgS system, which controls the expression of adhesions, toxins, and other virulence factors in Bordetella pertussis (Arico et al., 1991; Stibitz & Yang, 1991; Utsumi et al ., 1994). Although the environmental signal to which the sensor EvgS responds is still unidentified, studies using a mutant with a constitutively active EvgS (evgS1 mutant, Kato et al., 2000) or using overexpression of the response 30.
(35) regulator EvgA demonstrated that the EvgA/EvgS system confers multi-drug resistance to a drug-hypersusceptible strain, which lacks constitutive multi-drug efflux genes acrAB (Ma et al. , 1993), and acid resistance to exponentially growing cells (Chapter II-1; Masuda & Church, 2002; Masuda & Church, 2003; Nishino & Yamaguchi, 2001a; Nishino & Yamaguchi, 2002; Nishino et al. , 2003). In the results of the microarray analysis of the mutant with a constitutively active EvgS in Chapter II-1, we found that as many as 225 ORFs showed significant increase in transcription and that 144 ORFs showed significant decrease in transcription (http://www.nara.kindai.ac.jp/nogei /seiken/array2.html).. Comparison of this result with the systematic analysis of 36. two-component deletion mutants by Oshima et al. (2002b), revealed a surprisingly close relation between the EvgA/EvgS system and another two-component system, PhoP/PhoQ, which senses external Mg2+ concentration (Groisman, 2001). Signal transduction between these two systems is investigated in this study. Materials and Methods Bacterial strains and growth conditions.. The strains and plasmids used in this study are listed in Table 1. The phoP strains (KMP1, KMP2001) and phoQ strains (KMQ1, KMQ2001) were constructed with P1 transduction from the donors WP3022 and WQ3007 (Minagawa et al., 2003) to the recipients KMY1 (wild-type) and KMY2001 (evgS1 mutant).. Bacteria were grown. at 37ºC in Luria-Bertani (LB) medium (pH 7.5), containing 1% Bacto Tryptone (Difco), 0.5% Bacto Yeast Extract (Difco) and 1% NaCl.. MgCl2 was added to a final. concentration of 30 mM when necessary. For induction of the arabinose promoter of pA191, arabinose at a final concentration of 0.2% (w/v) was added to the culture at OD600 = 0.2.. Ampicillin, chloramphenicol, kanamycin and tetracycline were used at. 100g/ml, 25 g/ml, 25 g/ml, and 12.5 g/ml, respectively. Site-directed mutagenesis.. In order to create pOH2001D52A, a low-copy plasmid carrying the evgA with substitutions of Asp52 to Ala, site-directed mutagenesis was performed using the QuikChange. Site-Directed. Mutagenesis. Kit. (Stratagene),. primers. 5’-GATATCGTCATCATTGCTGTCGATATCCCC-3’ and 5’-GGGGATATCGACAGC AATGATGACGATATC-3’ (the site of mutation is underlined), and pOH2001 carrying the evgA and evgS1 genes. 31.
(36) TABLE 1. Bacterial strains and plasmids used in this study Strains or plasmids Strains MC4100 MK12 KMY1 KMY2001 KMP1 KMP2001 KMQ1 KMQ2001 KMY204 WP3022 WQ3007 MG1601 Plasmids pMV191 pA191 pMW119 pOH2001 pOH2001D52A pHO119. Description. Source or reference. F-(argF-lac )U169araD139rpsL150ptsF25fibB5301rbsR MC4100(ara-leu) 7696 MK12 RS45[(emrK'-lacZ )] KMY1 evgS1 KMY1 phoP::cat KMY2001 phoP::cat KMY1 phoQ::cat KMY2001 phoQ::cat KMY1 evgA::cat W3110 phoP::cat W3110 phoQ::cat MC4100 mgtA:: placMu55. Casadaban, 1976 Kato et al ., 2000 Kato et al ., 2000 Kato et al ., 2000 r KMY1×P1(WP3022)→Cam KMY2001×P1(WP3022)→Camr KMY1×P1(WQ3007)→Camr KMY2001×P1(WQ3007)→Camr Kato et al ., 2000 Minagawa et al. , 2003 Minagawa et al. , 2003 Kato et al ., 1999. pBAD 18 derivative carrying an Eco RI-Aba I fragment containing the tetR gene of pBR322 pMV191 derivative carrying a 0.7 kb fragment containing the evgA gene. Low-copy number vector pMW119 derivative carrying a 5.2kb fragment containing the evgA, evgS1 genes from KMY2001 pOH2001 derivative carrying an evgA D52A. pMW119 derivative carrying a 3.6kb fragment containing the phoPQ gene .. Kato et al ., 2000 Kato et al ., 2000 Nippon Gene Laboratory stock. This study. Kato et al ., 1999. Camr: chloramphenicol resistance.. TABLE 2. PCR primers Gene. Primer. crcA. crcAF: 5'-TGG TGT TAG CTG CGG CTG TG-3' crcAR: 5'-GGC TGT TGC CAG GTT TGT GC-3'. ybjG. ybjGF: 5'-GGC CCC AGC AGC CAT TGT AA-3' ybjGR: 5'- CCA GCA TAA CTT CCC GAC GC-3'. proP. proPF: 5'-GTG GTT TGC CTC TTC GAC CG-3' proPR: 5'-CCC AGT GAT GCT GCG GTA AT-3'. ompT. ompTF: GCG GCC CAC GAC TTA GAA GT-3' ompTR: GCA ATA GGG GTT GTC AGG AC-3'. GenBank AE000167 4147-4166 4631-4612 AE000186 5782-5763 5271-5290 AE000483 4827-4846 5398-5379 AE000161 8964-8945 8479-8498. RNA preparation and S1 nuclease mapping.. Total RNA was extracted as described in Chapter II-1.. Total RNA of. EvgA-overexpressing strains was prepared from cells grown for an additional 30 min at 32.
(37) 37°C after reaching OD600 0.8 for ample induction of EvgA from the arabinose promoter.. S1 mapping was carried out as described in Chapter II-1.. 32. P-end labeled. probe was prepared by PCR using primers described by Minagawa et al. (2003) and those listed in Table 2, MC4100 genomic DNA as the template, and ExTaq DNA polymerase (Takara). PhoP detection.. Cells were grown to OD6000.8 at 37ºC in LB medium with constant shaking, collected by centrifugation, and re-suspended in 25% sucrose, 40 mM Tris-HCl (pH 8.0). After treatment with 1 mM EDTA and 0.5 mg/ml lysozyme at 0ºC for 10 min, cells were lysed by adding 0.5% Brij-58.. The Brij lysate was supplemented with 0.01 M. MgCl2 and 0.2 M KCl, and digested at 37ºC for 10 min with 20 g/ml RNaseA in the presence of 1 mM PMSF, followed by sonication.. The supernatant after centrifugation. for 30 min at 15000 r.p.m. was used as the cell lysate. The protein concentration of cell lysates was determined by the Bradford method (Protein Assay Kit, Bio-Rad). Equal amounts of protein (16 g/lane) were separated by SDS-PAGE.. The proteins. were then transferred to a polyvinylidene difluoride membrane (Immobilon-P transfer membranes, Millipore), probed with anti-PhoP serum, and visualized by goat anti-rabbit IgG. conjugated. with. alkali. phosphatase. and. 5-bromo-4-chloro-3-indolyl. phosphate/nitroblue tetrazolium (Immunblot Kit, Bio-Rad). galactosidase assay.. Cells grown to OD600 0.8 at 37ºC in LB medium were subjected to -galactosidase assay in duplicates and expressed as Miller units (Miller, 1972). The data shown are means and standard errors from three individual cultures. Results DNA microarray-based analysis of the interaction between EvgA/EvgS and othe r two-component systems.. In order to search for two-component systems interacting with the EvgA/EvgS system, we first selected up-regulated genes of other two-component systems by picking up genes which were down-regulated by individual deletion of each two-component system (http://ecoli.aist-nara.ac.jp/xp_analysis/2_components ; Oshima et al., 2002b). We then matched them with the up-regulated genes by the activation of 33.
(38) the sensor EvgS (http://www.nara.kindai.ac.jp/nogei/seiken/ array2.html, Chapter II-1). As shown in Table 3, expression of 14 genes out of 27 PhoP/PhoQ up-regulated genes was enhanced in the evgS1 mutant, clearly indicating interaction between the EvgA/EvgS. and. PhoP/PhoQ. systems.. The. expression. ratio. of. the. 14. PhoP/PhoQ-regulated genes, which were up-regulated by the constitutively active evgS1 Of these 14 genes, nine, namely, hemL, mgtA, phoP ,. mutation, is shown in Table 4.. phoQ, rstA, rstB, slyB, yrbL, and mgrB, were members of the PhoP/PhoQ-dependent Mg2+ stimulon reported by Minagawa et al. (2003).. These genes are directly regulated. by PhoP via phosphorylation from the sensor PhoQ.. TABLE 3. Interaction between EvgAS and other two-component systems. a. a. Two-component systems. Ratio. phoPQ rssB envZ ompR basSR narXL narQ yojN hydHG yfhA rcsB uhpAB yfhK narP uvrY ypdAB citAB yehUT dcuSR. 14/27 3/23 2/54 0/12 0/4 2/25 0/17 0/13 1/17 0/11 0/3 0/8 0/9 1/37 1/18 1/23 0/7 2/29. Two-component systems. Ratio. ntrBC arcA arcB baeSR cpxRA creBC kdpDE phoBR rstAB torSR yedWV ygiXY barA cusRS fimZ cheABY atoSC. 1/8 0/38 3/112 0/8 1/16 1/1 0/10 0/8 2/22 1/24 0/7 0/6 1/24 1/7 1/22 1/28 0/32. Ratio: Number of up-regulated genes in the constitutively active evgS1 mutant among the genes up-regulated by the corresponding system / number of up-regulated genes by the corresponding system (http://ecoli.aist-nara.ac.jp/xp_analysis/2_components, Oshima et al ., 2002). 34.
(39) Enhanced expression of PhoP regulons by EvgA/EvgS.. To further analyze the promoter regions of EvgA/EvgS-enhanced PhoP regulons, S1 mapping was performed for the 14 genes listed in Table 4.. Enhanced expression in. the evgS1 mutant for 13 genes (note that phoP, phoQ and rstA, rstB form operons) was confirmed (Fig. 1, lane 2), validating our microarray data.. Expression of these. transcripts was dependent on PhoP/PhoQ, since deletion of phoP or phoQ resulted in a prominent decrease in transcription, even in the evgS1 mutants (Fig. 1, lanes 3-6). This decrease in transcription was complemented by pHO119, a plasmid carrying the phoPQ operon with its native promoter (data not shown). Thus, the enhancement of these promoters by EvgA/EvgS is clearly PhoP/PhoQ-dependent, indicating signal transduction from the EvgA/EvgS system to the PhoP/PhoQ system.. As for the. remaining copA gene, transcripts were searched for in a range of 1000 bp upstream of the translational start codon, but no transcript was detected in our S1 mapping for reasons unknown. TABLE 4. Up-regulation of PhoPQ regulated genes by constitutively active evgS1 mutation PhoPQ-regulated genes. Expression ratioa. PhoPQ-regulated genes. Expression ratio. copA crcA hemL mgtA ompT phoP phoQ. 10.0, 9.3 b 58.9, H 3.5, 3.2 14.7, 18.6 5.4, 7.0 7.2, 7.2 4.5, 6.3. proP rstA rstB slyB ybjG yrbL mgrB. 13.3, 17.8 3.6, 5.4 5.0, 3.5 3.0, 3.6 5.9, 5.3 2.9, 2.5 5.6, 2.5. a. Ratio of normalized signal intensities of Cy5 (KMY2001) against Cy3 (KMY1) from DNA microarray analysis. Two ratios are shown for each gene (http://www.nara.kindai.ac.jp/nogei/seiken/array2.html). b H: signal not detected in KMY1, but was significantly detected in KMY2001.. Promoters of PhoP regulon activated by EvgA/EvgS.. All the nine genes reported by Minagawa et al. (2003) conserve a consensus sequence of PhoP binding [PhoP box; a direct repeat of (T/G)GTTTA separated by five nucleotides] at their -35 region with a maximum mismatch of two nucleotides. Promoter regions of the four remaining genes, crcA, ybjG, proP, and ompT, are shown in Fig. 2 in comparison with several PhoP regulons. PhoP boxes with a mismatch of two and three nucleotides were found in the -35 regions of ybjG and crcA, respectively, suggesting that these two genes may be directly regulated by PhoP. 35. On the other hand,.
(40) A+G 1. 2. 3. 4. 5. 6. A+G 1. PcrcA. crcA. P1hemL. hemL. mgtA. PmgtA. ompT. PompT. P1phoP. 3. 4. 5. 6. P2proP. proP. PrstA. rstA. P1slyB. slyB. PybjG. ybjG PyrbL. yrbL. PmgrB. mgrB wi ld ev gS 1. ph p oP hoP ,e vg S1 ph ph oQ oQ ,e vg S1. wi ld ev gS 1 ph ph o oP P ,e vg S1 ph ph oQ oQ ,e vg S1. phoP. 2. FIG. 1. S1 mapping of EvgA/EvgS-regulated PhoP regulons. Lanes A+G, Maxam-Gilbert sequencing ladder; 1, KMY1; 2, KMY2001 (evgS1); 3, KMP1 (phoP); 4, KMP2001 (phoP, evgS1); 5, KMQ1 (phoQ); 6, KMQ2001 (phoQ, evgS1). Transcripts increased in the evgS1 mutants are indicated by arrows.. 36.
図

+7


関連したドキュメント
An easy-to-use procedure is presented for improving the ε-constraint method for computing the efficient frontier of the portfolio selection problem endowed with additional cardinality
The inclusion of the cell shedding mechanism leads to modification of the boundary conditions employed in the model of Ward and King (199910) and it will be
(Construction of the strand of in- variants through enlargements (modifications ) of an idealistic filtration, and without using restriction to a hypersurface of maximal contact.) At
It is suggested by our method that most of the quadratic algebras for all St¨ ackel equivalence classes of 3D second order quantum superintegrable systems on conformally flat
This paper develops a recursion formula for the conditional moments of the area under the absolute value of Brownian bridge given the local time at 0.. The method of power series
Answering a question of de la Harpe and Bridson in the Kourovka Notebook, we build the explicit embeddings of the additive group of rational numbers Q in a finitely generated group
Then it follows immediately from a suitable version of “Hensel’s Lemma” [cf., e.g., the argument of [4], Lemma 2.1] that S may be obtained, as the notation suggests, as the m A
In order to be able to apply the Cartan–K¨ ahler theorem to prove existence of solutions in the real-analytic category, one needs a stronger result than Proposition 2.3; one needs
