鹿児島大学リポジトリ
20
0
0
全文
(2) GILLETTE and SAKAI. Introduction. The cultivation of rice has been practiced in Guyana since the 1800s; beginning with the pre- and-post slavery era to its emergence as a major industry during the late 1880s and early 1900s. Although faced with many obstacles through time, the rice farmers have been able to weather the storms of globalization and political and institutional pressure, through sheer determination and ingenuity. Government efforts to reduce the political influence of the East Indians greatly reduced the productivity of the rice industry. These polices restricted the farmers’ capacity to store and produce the grain, while simultaneously shifting resources and investment away from the development and maintenance of infrastructure necessary for the growth of the industry. This was highlighted in studies carried out by Lakhan et al [14] [15], Hanrahan [11], Collymore [3], etc. Institutional pressure and control have played a key role in the suppression of the rice industry and in hindering farm productivity, particularly during the 1960s to 1980s. Lakhan et al have proposed that finance and credit, machinery and extension facilities should be provided to rice farmers to increase rice production (Lakhan, V C, et al [16]). However, it is a fact that climatic conditions in Guyana are ideal for the planting and harvesting of rice in both the spring and summer seasons (Lakhan, V C [13]); this is a major reason for the rice industry’s pre-eminence in the Guyanese economy. This paper presents a comprehensive picture of the history of Guyana’s rice industry and discusses the key events that molded it into its current state. This is done by analyzing production, cultivated acreage and export data collected for the period, 1970 to 2016 and by reviewing historical accounts and documented interviews by authorities on this subject. This made it possible for the authors to establish a timeline and to match historical accounts with the corresponding data. . Background. Rice has been cultivated in Guyana for almost two centuries, during which time it has expanded from a garden, sustenance crop grown by slaves on the sugar plantations to an industry that now occupies more than 130,000 ha of land and provides livelihood for an estimated 25% of the population (International Rice Research Institute [12]). As of 2011, approximately 7900 households cultivated paddy accounting for 60.2% of households. In 2008, the rice sector accounted for 12.5 percent of the agricultural GDP and 14.9 percent of the national export earnings (Guyana Rice Development Board [7]). Rice is the staple grain of Guyana and is a major income earner for the country. Expansion of the rice industry was greatest during 1950–77 when the cultivated acreage tripled and production increased (International Rice Research Institute [12]). However, today the industry is witnessing a reduction in the number of farmers and farms, but with the consolidation of smaller plots there is an increase in average acreage. The rice sector’s historic performance since the country’s independence can be clearly divided into two periods – the period of state control of the economy (1966–89) and the period of liberalization of the economy (1990 to the present) (World Bank [26]).. 26.
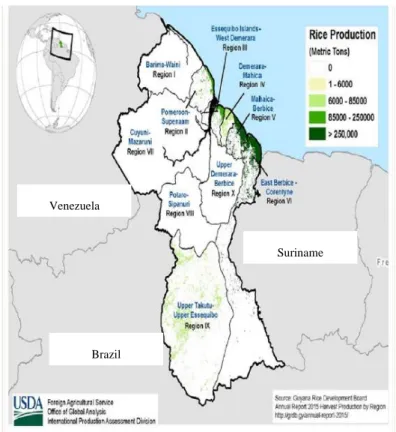
(3) Vicissitudes of rice. In 1946, the Guyana Rice Board (GRB) was established, bringing together government officials and farmers to develop policy for the sub-sector (National Development Strategy [18]). However, in the subsequent years, farmer representation on the board diminished to the point where there was no farmer representation at all. The Rice Regulation of Manufacturing and Marketing Act of 1985 dissolved the GRB and in its place, created three separate entities, namely, the Guyana Rice Export Board (GREB), the Guyana Rice Milling and Marketing Authority (GRMMA) and the National Paddy and Rice Grading Centre (NPRGC) (National Development Strategy [18]). The initial function of the GRMMA was to purchase and then sell paddy and rice to the domestic and export markets. During the period of state control, prices were controlled; farmers were restricted from freely selling their produce and were assigned geographical regions where they were permitted to sell their produce. Further restrictions also provided the government with the means to prevent farmers from hoarding paddy/rice. The price set by the government was based on a predetermined, estimate of the cost of production. This period saw a decrease in cultivated area from 120,000 hectares in 1968 to 60,000 hectares by 1989. However, overall production increased due to investments in improved varieties, extension services, and the provision of farm inputs and other forms of subsidies. However, in the mid-1980s, the government changed its pricing system, allowing farmers to sell in markets of their choice. During this period the devaluation of the exchange rate caused an increase in the price of rice relative to other agricultural commodities. The sale of state-owned mills had a positive effect on the sector mainly through increased competitiveness among stakeholders. These factors contributed to raising prices which motivated farmers to increase production. By 1991 the total area harvested increased by 43% and production increased by 60%; by 1998 the area harvested increased by 75% and production by 100%. Rice cultivation is done primarily on a thin strip of fertile land along Guyana’s coast (Fig. 1.) which has an equatorial climate. This area is divided into six administrative regions of which five regions are known as rice production areas namely, Pamaroon Supernaam (Region 2), Essequibo Islands West Demerara (Region 3), Demerara Mahaica (Region 4), Mahaica Berbice (Region 5) and East Berbice Corentyne (Region 6). Of these regions, Region 5 and Region 6 are the highest rice producing areas. These lands are below sea level (2m), are dependent on the tidal flow for drainage and are under the constant threat of salt water intrusion or floods during periods of extreme high tide or abnormally high rainfall. Rice cultivation is supported by an extensive drainage and irrigation network which was initially constructed by the Dutch over 150 years ago and is now managed by the National Drainage and Irrigation Authority (NDIA). The total length of the main drainage infrastructure is about 500 km, while the length of the secondary drainage system is 1,500 km (Food and Agriculture Organization [5]). These structures sometimes fail (due to maintenance issues; blockages due to the infiltration of trash; excess water in the system, etc.) and since the lands are already below sea level, the failure of the drainage systems can lead to major losses in production. This is true in particular for Regions 5 and 6 which already demonstrate a high degree of volatility in production. Other reasons for volatility in these regions were: reduced sowing areas; weed infestation; pests and diseases, and the lack of irrigation facilities. The rice supply chain in Guyana is characterized by a direct interaction between farmers, millers and exporters. About 70% of the rice produced is exported while the remaining 30% is domestically consumed. The key participants within the supply chain are farmers, millers and exporters with the support of government and non-government organizations such as banks, microfinancing institutions, input suppliers and shipping companies. It should be noted that in addition to 27.
(4) GILLETTE and SAKAI. government, institutions such as the Guyana Rice Development Board (GRDB) and the Rice producers Association (RPA) also provides some extension services to farmers.. Venezuela. Suriname. Brazil. Fig. 1. Rice producing areas in Guyana. Mills in Guyana are licensed by the Guyana Rice Development Board. Today, vertical integration is common within the industry. Millers and exporters are now integrating their activities up-and-downstream with large millers starting to export, and exporters entering the milling business. Access to credit is a major issue within the industry, especially for small mills who require financing for the purpose of upgrading their facilities to increase productivity. This is also the case for farmers who find it difficult to access financing from commercial banks who are averse to the risks in agriculture like, frequent flooding, bankruptcy of mills, default by big farmers etc. Since banks require land as collateral, farmers who occupy leasehold lands are unable to acquire financing. Large farmers are more likely to acquire financing from commercial banks but smaller farmers source credit from alternative sources such as rice mills, input suppliers, equipment suppliers and microfinance institutions. While these sources provided some support, the interest rates are relatively high; millers and exporters receive a rate of 14% from commercial banks and farmers receive a rate of 21% from microfinance institutions.1 Lending to rice millers declined from G$5.9 billion in 2000 to G$1.7 billion in 2008 (John Tracey [19]). This, in addition to the doubling of paddy prices resulted in a mismatch with available financing. This constraint is currently being managed by millers by either securing funds from other sources or more commonly by delaying payments to producers (farmers) until payment has been received from buyers, thereby directly increasing the risk of late payment or default between farmers and millers (World Bank [26]). 1. Interview with Guyana Rice development board personnel 28.
(5) Vicissitudes of rice. Transportation of rice and inputs occur through Georgetown port which is a relatively small port with a limited maximum cargo-boat size of 6000 tons. This limited capacity increases the cost of inputs and cost of exportation.. Pre-emancipation rice cultivation. Guyana’s relatively long tradition of rice production began more than 200 years ago. It was first practiced by enslaved Africans brought to Guyana during the seventeenth, eighteenth and early nineteenth centuries to cultivate sugarcane on the then Dutch colonies of Essequibo, Demerara and Berbice. These slaves hailing from the West African coastal areas, came primarily from the upper and lower coast of Guinea where rice was grown and served as their staple food. Under plantation conditions many slaves cultivated rice in small plots during their spare time to supplement their sparse food rations. This was not always permitted because many planters preferred to have their entire land under sugarcane cultivation or other cash crops such as cotton and coffee for export. On the other hand, a few planters, made it a requirement for slaves to produce rice on small plots to supplement their food ration (Winston McGowan [23]). Apart from plantation cultivated rice, there were documented cases of runaway slave settlements often in the hinterlands, producing large quantities of rice, plantains, yams, etc. Charles Edmonstone, the captain of a Demerara militia unit, led an expedition in 1810 which captured and destroyed a significant quantity of rice produced by the so called “Bush Negros”. The quantity destroyed was moderately calculated to be enough to support 700 Negroes for 12 months (Winston McGowan [23]).. Post Emancipation rice cultivation. The abolishment of slavery in 1838 triggered a decline in rice production. Many ex-slaves opted to abandon rice cultivation and cultivate ground provisions (cassava, eddoes, yams, sweet potatoes, etc) which constituted a major part of their diet. With the end of slavery in 1838 and the growing population of indentured East Indian laborers who were recruited to take the place of former slaves, the period that followed saw a growth in the demand for rice, particularly during the 1850s–1860s. The rice was imported from India. This significant increase in demand served as stimulus for renewed efforts to cultivate rice in the colony and thus in 1853, a company was formed for the cultivation of 150 acres in Vive La Force located on the West Bank of Demerara. However, this endeavor and others like it, proved to be unsuccessful. In another attempt during the 1850s, rice cultivation received a boost when the East Indian laborers began the cultivation of rice on 16 acres of land in Leonora village on the West Coast of Demerara for subsistence purposes. This proved to be very successful and a good stimulus. Thereafter cultivation gradually increased in the colony until around 1870, after which it reduced again. This situation took a turn for the better from 1873, when the practice of re-indentureship was halted. Former sugar plantation laborers left the plantations and began to lease lands specifically to produce rice. This resulted in the Essequibo Coast of Guyana becoming the most important rice producing area. Anna Regina and Better Success located on the. 29.
(6) GILLETTE and SAKAI. Essequibo Coast were the main centers of production where 300–400 free Indians cultivated approximately 1,500 acres of land. Regardless of these developments, rice production was still haphazard until the 1880s and most of the rice demand was met by imports from India. The limited state of rice cultivation is said to be due to some historical and contemporary factors. These factors include: 1) rice had not been a principal part of the diet of the African slaves; 2) post emancipation, ground provisions and not rice was the preferred crop of a majority of freed Africans; 3) unwillingness of white planters to invest in rice cultivation; 4) ecological, technical and climatic obstacles, for example, it was easier to convert sugarcane land to ground provision cultivation than to rice production and there was a shortage of technical expertise and traditional tools such as cutlasses, hoes and rice-grass knives that were used particularly in the 1850s and 1860s; 5) there was severe opposition by sugar planters who used their political influence to ensure that resources and labour were diverted away from rice and any other economic activities (Winston McGowan [23]). The aforementioned factors resulted in a lack of diversification in the colony’s economy and when the sugar industry experienced a prolonged crisis in 1884, rice cultivation received the much-needed capital and other resources for growth. This resulted in rapid growth in rice production and by the 1920s British Guyana’s rice industry was firmly established. This progression was reflected in the usage of land. By 1931, approximately 30% (49,000 acres) was under rice cultivation as compared to a mere 2,000 acres cultivated in the 1880s. The main factor responsible for this dramatic expansion in rice cultivation was the prolonged crisis faced by the sugar industry during the period 1884 to 1904. The crisis stemmed from competition between Guyanese sugarcane and other Caribbean region grown sugarcane, which effectively drove prices of sugar down from £22, 4s per ton in 1883 to £9, 12s by 1896. This caused the collapse of many plantations and the subsequent weakening of the political power of many plantation owners, thus allowing for the reallocation of land, labour and capital to alternative economic activities, leading to the emergence of industries such as the rice and gold (Winston McGowan [24]). The reduction in wages caused by the sugar crisis led many indentured Indian laborers to cultivate rice, after the expiration or termination of their employment with the sugar plantations. The rice industry was stimulated by the availability of cheap land obtained from sugar planters and the government. These lands were provided to ex-indentured laborers in lieu of providing them with a return passage to India. The sale of these lands was made possible due to reduced prices and relaxed terms of sale of crown land. Some planters were known to rent parts of their land to laborers for rice cultivation, in the hopes of recruiting them during the sugar crop time. In 1901 production shortfalls in India curtailed imports and resulted in shortages in the colony. This benefitted the local rice industry allowing them to charge higher prices. The higher prices encouraged more cultivation. The introduction of new, more productive varieties and the establishment of mills further served to stimulate the growth of the rice industry and by 1907, a total of 44 mills were established in the colony. Guyana’s newly emergent rice industry also benefited tremendously from the first World War; the unavailability of wheat and other grains boosted domestic demand for rice. Further, transportation issues affecting rice imports from India greatly reduced rice imports from approximately 2,519 tons between 1909 and 1913 to 72 tons in 1917. Local farmers took advantage of this situation by producing more rice to fill the gap and by producing rice flour as a substitute for wheat flour. Furthermore, through greater capital investment, new technologies such as tractors and other machinery were integrated into the production process (Winston McGowan [24]).. 30.
(7) Vicissitudes of rice. Land under rice cultivation during the period 1884 to 1920, went from 2,000 acres to 55,000 acres and had significant effects on the Guyanese economy. The most important of which was the diversification or modification of the economy which till then was dominated by sugarcane and its two by-products, rum and molasses (Winston McGowan [25]). By 1920, almost all the sugar plantations in Essequibo had been converted to rice land and was now second to sugarcane as one of the colony’s main exports. However, it was not until the 1940s that rice assumed a position of major importance when production rose to 55,000 tons annually (Winston McGowan [25]). Rice cultivation created significant labor shortages which greatly affected the sugar industry, forcing it to mechanize to compensate for the labor shortages. This was manifested by the growing use of tractors from 1917. Rice gradually became a major part of the Guyanese diet, not only for Indians but also for Africans, Chinese and the general working class. As of 1920, local rice production was able to meet local demand, eliminating the need for importing rice. The colony was exporting approximately 8,000 tons of rice annually, primarily to the British West Indies and the other Guyanas. The cultivation of rice had another strong impact on the food supply in the colony. Higher rice prices generated incentives for farmers (who previously grew ground provisions and vegetables), to convert their land to rice lands. Thus by 1919 there was a shortage of ground provisions, fruits and vegetables. This triggered a 100-150% increase in the local prices of ground provisions, fruits and vegetables. Similarly, cattle farmers also turned to rice cultivation to take advantage of the high profitability. As with the case of fruits and vegetables, the consequence of this was a scarcity of milk and a sharp increase in its price. By 1920, the aforementioned situation, in addition to the impact of the first World War propelled rice to greater significance in the colonial economy. British Guyana had become the leading producer of rice in the Caribbean (Winston McGowan [25]).. Institutional framework. The Rice Producers Association (RPA) The Rice Producers Association (RPA) was established by the Act No.7 of 1946; this organization was a product of the industrialization of British Guyana. However, due to its capitalist structure, the organization proved to be more beneficial to wealthy merchants and millers instead of farmers who continued to live at subsistence levels (Guyana Chronicles [6]). Mechanization in the industry, led notably by businessman Kayman Sankar created a boom in the industry; however, this did not translate into subsequent gains for farmers because the system was said to be in favor of the millers and merchants. Even though farmers succeeded in keeping the industry viable, they were unable to attain wealth due to oppression by some millers. Until 1957, the RPA served the interests of bureaucracy instead of representing the rights of farmers for whom it was established. This changed under the leadership of Dr. Cheddi Jagan, whose vision restored the organization to its true mandate while regaining farmers’ confidence.. 31.
(8) GILLETTE and SAKAI. Government support/control institutions In 1946, the Guyana Rice Board (GRB) was established, bringing government officials and farmers together to develop policy for the sub-sector (National Development Strategy [18]). This board was soon dissolved by the Rice Regulation of Manufacturing and Marketing Act of 1985 which fostered the establishment of three new institutions, namely, the Guyana Rice Export Board (GREB), the Guyana Rice Milling and Marketing Authority (GRMMA) and the National Paddy and Rice Grading Centre (NPRGC).. Guyana Rice Milling and Marketing Authority (GRMMA) GRMMA was originally intended to purchase and sell paddy and rice. This institution also had its own milling facilities which supplied rice to both domestic and export markets. GRMMA purchased paddy at fixed prices set by government according to a formula based on the cost of production. It should be noted however, that beginning from the early 1980s, some private millers were authorized to buy and sell to the domestic market at fixed prices, and from the mid-1980s, they were allowed to export (National Development Strategy [18]).. Guyana Rice Export Board (GREB) GREB serves the function of regulating rice exports. It also serves to support the GRMMA by arranging export of its rice. However, from 1985, it was given the responsibility of licensing exporters and approving the quality and price of each export transaction. This was done at a fee equivalent to 3% of the value of the export price received by the exporter.. National Paddy and Rice Grading Centre (NPRGC) The NPRGC was tasked with the responsibility of grading and certifying paddy and rice both for domestic use and export. This institution established national standards for grading, and assigned personnel to the mills to monitor the grading process (National Development Strategy [18]). The high level of intervention by these institutions resulted in severe restrictions on internal trade. Farmers were constrained to sell within specific geographical areas. As a measure to combat “hoarding of paddy” further restrictions were put in place to regulate the amount of rice or paddy a farmer could hold. Of the many policies and institutional arrangements, the pricing formula proved to be responsible for disincentivizing rice farming in Guyana. The Rice Regulation of Manufacturing and Marketing Act of 1985 placed the responsibility for setting the legal price for different grades of paddy under the mandate of the Ministry of Agriculture. Farmers had the option of selling either GRMMA or to the millers. These millers would then sell to wholesalers or abroad directly at prices negotiated and approved by the GREB. In cases where it was sold to wholesalers, the rice was then sold to retailers, who in turn sold to consumers at ministry-set prices. The paddy price was determined by calculating the cost of purchased inputs and adding a multiple of this total to represent non-purchased, farm-supplied costs. To arrive at the post-mill price, milling costs were added to the riceequivalent price of paddy. The wholesalers' price was calculated by adding a gross mark up to the miller’s price, typically 12 percent, and the retailers' price was determined by adding a further gross mark up to the wholesalers' price (National Development Strategy [18]).. 32.
(9) Vicissitudes of rice. These policies severely restricted farmers however, and due to a lack of alternatives many farmers continued to cultivate rice. Land and production consolidation were among the most prominent side effects of these policies. Small farmers in particular began to abandon production, selling their lands or renting it to larger farmers or converting it for more lucrative options. This meant that the power to produce was in fewer hands. The rapid exodus resulted in rice production reaching a low of 93,000 metric tons in 1990. Rice exports were correspondingly depressed during the 1980s, falling to a low of 29,000 metric tons in 1985 (see Table 1.). By the late 1980s, the obvious failure of the policy framework prompted the dismantling of the pricing and institutional structure. Farmers were now free to sell wherever they wanted. The government also sold all of its mills, retaining only GRMMA. This greatly improved competition and provided incentives for farmers to re-enter the industry. Thus by 1991 the area harvested increased by 46% and output by 60%, with a strong positive trend in the following years too. The 1994 Rice Act streamlined the previous institutional arrangements. The Guyana Rice Milling and Marketing Authority (GRMMA) was dissolved and a small parastatal rice company was created to operate the Burma mills, the only remaining state-owned company. The GREB and NPRGC have been merged into the new Guyana Rice Development Board (GRDB) (National Development Strategy [18]). The main functions of the GRDB are: •. To develop the rice industry in Guyana and to promote the expansion of the exports;. •. To establish facilities for the conduct of research relating to rice and extending the benefits derived from the research to the rice farmers through an established system;. •. To engage in such promotional and developmental activities which the Board deemed necessary for the purpose of developing the rice industry (Guyana Rice Development Board [8]).. The disappearance of the small farmer. Literature has cited two factors which contributed to the gradual decline in the number of small-scale rice farms. Firstly, globalization and liberalization (Wazir Mohamed [21]) and secondly, the efforts by the Burnham government to correct the historical disparity between African and East Indian ownership and their disparate involvement in the rice industry.. Globalization and liberalization In 1955 there were approximately 22,156 rice farmers while in 1970 the total was recorded to be approximately 45,000. Of the total recorded in 1955, 900 were large farmers with plots larger than 16 acres. At the time, the vast majority (15,000) cultivated less than 15 acres, that is 2 to 8 acres while the remaining farmers cultivated less than 2 acres each (Wazir Mohamed [21]). Over time, the number of farmers decreased while the average farm size increased. In 1999, Fazal Ally (late general secretary of the Guyana Rice Producers Association) stated in a Guyana Review report that the number of rice farming families had declined to approximately 15,000. He also indicated that 70% of the now 200,000 acres under cultivation was under the control of less than five large companies. From 1970 to 2000 the number of farmers declined by approximately 30,000 while the average farm size increased to 15 acres. This represented a reversal of the trend of the previous 80-100 years which saw a proliferation of small farmers. The industry had now become dominated by larger. 33.
(10) GILLETTE and SAKAI. farmers while small farmer families who could not compete were forced to become farm workers in an effort to maintain their livelihood. Many farmer families have also migrated from rural communities looking for better opportunities. These are clear signs of the effects of globalization and an indication of Guyana’s ties to the global economy. This economic environment ensured that only those farmers with the greatest access to information, technology and resources which made them more efficient, could survive. Mr. Dharamkumar Seeraj, General Secretary of the Guyana Rice Producers Association, in an interview with an OXFAM Canada team in 2001 explained the situation, stating that with global economic change we see, “the break-up of farming families, because farmers have to leave home in search of employment… we see the migration of young potential farmers and qualified people.” He further noted that this also affected the younger members of farmer households who make up a significant proportion of the rural community. “We see children called out of school because farming families can no longer afford the cost of transportation, uniforms, and school books. We see cases of suicide, farmers literally dying from the pressure of not being able to pay the banks – heart attacks on the increase, high blood pressure… there are fallouts at all levels.” (Wazir Mohamed [21]). Intervention by the Burnham government The period of the early 1970s to the mid-1980s, during which the industry was going through its transition to globalization, the production, marketing, pricing, access, and availability of rice came under state control. This situation negatively affected the farmers’ right to their crop. Statistics revealed that in 1970 the total area harvested area was 119,182 hectares and by 1990, the total harvested area fell by 43.1% to a low of 51,368 hectares (Table 1.).. Table 1. Paddy production and value for the period 1970–1990 Year 1970 1971 1972 1973 1974 1975 1976 1977 1978 1979 1980 1981 1982 1983 1984 1985 1986 1987 1988 1989 1990. Hectare Harvested 119,182 94,551 79,462 92,821 105,741 108,486 84,027 130,528 114,846 90,227 95,991 89,053 95,280 75,807 92,987 77,777 83,977 75,146 74,223 68,544 51,368. Paddy production (tons) 222,469 187,535 147,130 152,360 255,886 297,099 172,904 358,290 308,207 240,556 281,846 276,006 302,671 246,064 299,628 260,207 293,073 243,398 226,862 237,183 155,740. Yield (tons/acre) 1.8 1.9 1.8 1.6 2.4 2.7 2.0 2.7 2.6 2.6 2.9 3.0 3.1 3.2 3.2 3.3 3.4 3.2 3.0 3.4 3.0. Rice Equiv. (tons). Quantity Exported (tons). 144,605 121,989 95,639 99,034 165,657 172,259 103,754 214,972 184,985 144,328 169,107 165,604 181,603 147,639 179,785 156,124 171,044 145,879 132,281 142,310 93,444. Source: Guyana Rice Development Board Annual report 2016. 34. 59,347 67,515 69,949 47,814 50,827 82,035 70,681 65,855 104,761 84,080 81,008 78,010 35,676 41,715 47,498 29,339 38,634 68,987 55,926 40,575 50,943. Value (US$) 18,047 21,334 25,251 25,005 49,025 84,937 73,594 66,812 95,983 80,814 87,491 110,009 60,767 64,933 80,945 56,594 57,234 157,128 139,165 367,427 513,220.
(11) Vicissitudes of rice. The efforts by the Burnham government to address the imbalance between African and East India influence in the rice industry, started a chain of events that had a significant impact on the rice industry. To quote the former minister of finance, Mr. Carl Greenidge, the Burnham government, “tried to de-emphasize rice in favor of other agriculture and industrialization to which its own, predominantly urban supporters were attached.” (Wazir Mohamed [21]) The government of the day viewed the imbalance of influence within the rice industry between the two major ethnic groups as a cause of concern and thus took measures through institutional policies to reduce East Indian influence on decision making. These policies undermined the democratic mechanisms installed during the late 1940s and early 1950s and consequently hindered farmer participation in decision-making bodies. Burnham’s death in the mid-1980s paved the way for the new president H.E. Desmond Hoyte, who embraced neoliberal economics and politics to implement the so-called “Economic Recovery Program” in 1989. With the policies under this program, Guyana began the transformation into a market economy which in turn resulted in the upheaval of the institutional framework that was organized around small farmers. The result of this is a change in the dynamics of land and resource ownership and its accumulation in fewer hands. Trade agreements and marketing of Guyana’s rice. The two major export markets for rice were the European Union (EU) and the Caribbean, with 52 percent of total exports going to the EU and 34 percent heading for CARICOM countries in 2009 (World Bank [26]). Historically, the market was primarily focused on the EU, which provided preferential market access (US400/mt for grade B rice) to the other countries and territories (OCTs).2 Dependence on these preferential markets has given farmers a false sense of security because Guyana’s rice did not have to compete in the global market with producers such as Thailand and Vietnam where the cost of production is lower; US200/mt as compared to Guyana’s US337/mt on large farms and US395/mt on small farms; the United States has a production cost of US250-270/mt. However due to declining access to preferential markets, exports have been shifted towards the Caribbean region, with Jamaica as the main Caribbean destination for rice exports followed by Trinidad and Haiti accounting for 90% of Guyana’s Caribbean rice exports. Guyana rice exports benefit from a 20 percent CARICOM tariff on extra regional rice imports and also from lower shipping costs due to its geographic proximity to the Caribbean markets (World Bank [26]).. The EU Market. Guyana benefited from its share of the African, Caribbean, and Pacific (ACP) quota of 125,000 tons of rice and 20,000 tons of broken rice (Guyana Rice Industry [10]). As a result, there is a 65% levy deduction. Furthermore, in addition to the ACP “direct quota” Guyana benefited from the so-called ACP/OCT quota. The OCT quota stipulated that rice produced in an ACP state and processed in an OCT state was eligible for levy-free access into the EU. This served to further increase the demand for Guyana’s paddy by countries desirous of exploiting this loophole to gain access into EU markets. However due to pressure from the Italian government and other EU member states, the EU was forced to 2. There are 20 overseas countries and territories (OCTs) that are linked to Denmark, France, the Netherlands, and the. United Kingdom, and they are associated with the European Union. 35.
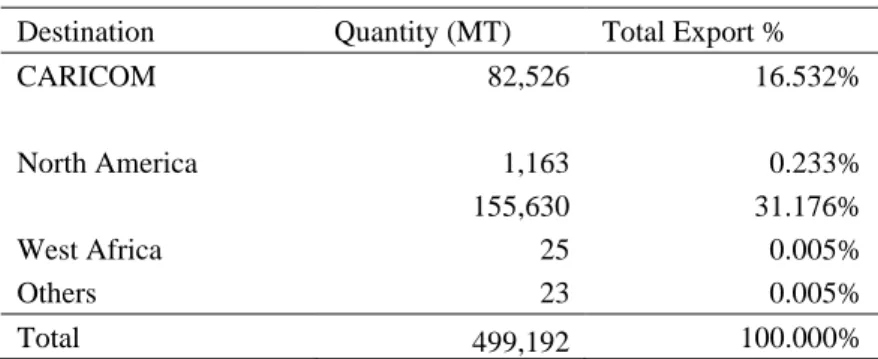
(12) GILLETTE and SAKAI. change its policy and thus, in 1998 the Cereal Management Committee of the EU divided up the quota for rice from ACP countries to the EU into four categories. They are as follows:. 1. ACP direct quota of 125,000 metric tons of husked rice equivalent. This was divided into three tranches: January. 41,668 Tons. May. 41,666 Tons. September. 41,666 Tons. 2. ACP direct quota of 20,000 metric tons of broken rice. This was divided into two tranches: January. 10,000 Tons. May. 10,000 Tons. 3. The OCT quota of 35,000 metric tons. Granted first in January and then the unutilized amount was granted in May. 4. A combination of OCT and ACP quota. Any ACP “direct quotas” that remained unutilized at the end of each tranche could be applied for and shipped to the EU through OCT (Guyana Rice Industry [10]). Guyana, as a member of the ACP group benefited from the Cotonou agreement on preferential market access to the EU (European Commission [4]). For 27 years ACP countries benefited from greater preferential access compared with other EU trade partners. However as of 2008, the agreement came to an end as the EU adopted trade programs that were more compatible with WTO programs. This change resulted in a reduction of preferential margin to 2-2.5% in relation to the Globalized System of Preferences (GSP) of the WTO. Furthermore, 50% of exports no longer receives preference.. CARICOM Market. As stated earlier, as a member of CARICOM, Guyana benefits from a 20% Common External Tariff (CET) that is applied to rice imported from outside the region (World Bank [26]). Exports to CARICOM accounts for a significant portion of Guyana’s rice exports at 16.532% (Table 2). Within CARICOM, Trinidad and Tobago and Jamaica are the best markets for Guyana accounting for 5.36% and 8.77% of exports respectively (Table 3.).. 36.
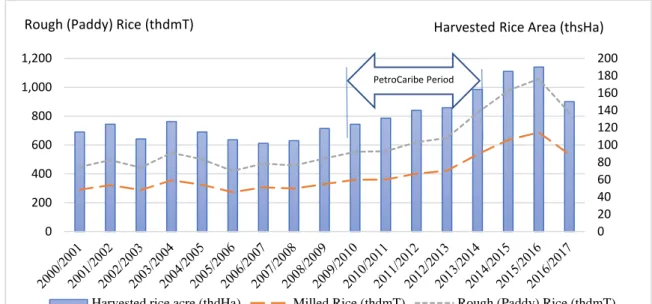
(13) Vicissitudes of rice. Table 2. Export quantity and percentage by destination Destination CARICOM. Quantity (MT) 82,526. Total Export % 16.532%. 1,163 155,630 25 23. 0.233% 31.176% 0.005% 0.005% 100.000%. North America West Africa Others Total. 499,192 Source: GRDB annual report 2016. Table 3. Export quantities and percentages by CARICOM destination for the period 2014-2016 Country (CARICOM). 2014. Export Percentage (%). Export Percentage (%). 2015. Export Percentage (%). 2016. Antigua Bahamas. 1,100 -. 0.22 -. 812 -. 0.15 -. 839 25. 0.17 -. Barbados. 2,435. 0.48. 2,763. 0.50. 2,808. 0.57. 1,451 971 1,754 50,264 389 611 3,574 1,558 24,328 88,435. 0.28 0.20 0.34 10.02 0.07 0.12 0.71 0.31 4.85 17.60. 101 1,249 1,777 47,913 343 715 4,076 1,181 24,926 85,856. 0.02 0.23 0.34 8.90 0.07 0.13 0.80 0.23 4.63 16.00. 1,055 1,815 43,777 343 837 3,781 485 26,761 82,526. 0.22 0.37 8.77 0.07 0.17 0.76 0.10 5.36 16.56. Belize Dominica Grenada Jamaica St. Kitts St. Lucia St. Vincent Suriname Trinidad Sub-Total. Source: GRDB annual report 2016. PetroCaribe Rice Compensation Scheme. On October 21, 2019 Guyana signed the PetroCaribe agreement with Venezuela as a means of bartering rice for oil. This was a yearly renewable agreement in which the Venezuelan government set the maximum quantity of paddy and white rice for the year and sets a premium price above the global market price. The value of paddy and rice to be shipped would then be subtracted from the amount due for oil shipped to Guyana. As a result of this agreement Guyana’s overall oil import bill and public debt has been effectively reduced. This is primarily as a result of the relatively long-term financing terms of 17–25 years at 1% interest, with a 1–2-year grace period. Guyana also receives an implicit subsidy in the form of the premium paid over the world price. Through the PetroCaribe agreement, Guyana was able to conserve its valuable foreign exchange. This would have otherwise been used to pay off its oil debt. These factors coupled with the relatively high world market price provided a stimulus for growth in the industry. Thus, during the period of the PetroCaribe agreement, estimated paddy yield, estimated rice yield and acres reaped showed significant increase (Clegg, P. [2]).. 37.
(14) GILLETTE and SAKAI. Rough (Paddy) Rice (thdmT). Harvested Rice Area (thsHa). 1,200. 200 180 160 140 120 100 80 60 40 20 0. PetroCaribe Period. 1,000 800 600 400 200 0. Harvested rice acre (thdHa). Milled Rice (thdmT). Rough (Paddy) Rice (thdmT). Source: Guyana Rice Development Board Fig. 2. Acreage harvested, paddy yield and rice yield in Guyana, 2000-2016. In fact, estimated paddy yield increased from 533 metric tons in 2009 to 823 metric tons by mid-2013 (Fig. 2.). Subsequently Guyana exported about 267,000 metric tons of rice and 445,000 metric tons of paddy valued at US$214 million and US$224 million respectively. This was accomplished under a total of six (6) sales contracts covering the period 2009-2013. This increase in production and exports propelled rice ahead of sugar as a contributor to GDP, with the gap being the widest by 2013 (Fig. 3.).. G$ millions. Percentage. 40,000. 10. 35,000. 8. 30,000 25,000. 6. 20,000 4. 15,000 10,000. 2. 5,000 -. 0 2006/2007. 2007/2008. 2008/2009. 2009/2010. 2010/2011. Rice as a %of GDP current prices. 2011/2012. Sugar. 2012/2013. 2013/2014. Rice. Source: Guyana Rice Development Board Fig.3. Contribution of Rice to GDP at current prices (2006-2013). The management of quota allocation to millers for the supply of rice and paddy under the PetroCaribe Agreement was placed under purview of the Guyana Rice Development Board (GRDB). Quotas were allocated to all rice mills on the basis of their annual production value (Wenner Mark D, et al [22]). This provided incentives for millers to purchase and produce more, while farmers benefitted from higher prices arising from competition among the millers. Competition to 38.
(15) Vicissitudes of rice. win quota rights to export to Venezuela also contributed to the discontinuation (by many mills) of the paddy grading system (A, B, and C grades). As a result, farmers supplied millers directly and earned a standard rate, regardless of destination (Clegg, P. [2]). The growth in exports to Venezuela which began in 2009 benefitted Guyana greatly, however, these benefits came at the expense of exports to other rice trade destinations. The most important of which were the Netherlands, Jamaica, Trinidad and Tobago and Haiti. Exports to these destinations declined during the period 2009-2012, however, exports rebounded in 2013 when production exceeded the demands of Venezuela. In November of 2015 Venezuela announced that it would not be renewing the contract for 2016 and proceeded to suspend the remaining balance under the Compensation Agreement of 2015. The compensation agreement was viewed by observers as being under threat of either modification or cancellation for some time, given the internal economic and political challenges facing Venezuela (Clegg, P. [2]). The effect of the loss of this market was that lower prices were being offered to farmers. This greatly reduced incentives for farmers to produce, particularly small farmers whose cost of production per acre was relatively higher. Price per bag (165lbs) fell from G$3500 to $1,500-$1,800 (Wenner Mark D, et al [22]). Both production and harvested quantities fell rapidly from 2015 onward as farmers attempted to adjust to the changing market situation (Fig. 4.).. Harvested Rice Area (thdHa). Rough (Paddy) Rice (thdmT). 1,200. 200 180 160 140 120 100 80 60 40 20 -. 1,000 800 600 400 200 0. Harvested rice acre (thdHa). Milled Rice (thdmT). Rough (Paddy) Rice (thdmT). Source: Guyana Rice Development Board 2016 annual report Fig. 4. Paddy and rice production and harvested area, 2007-2017. The suspension of the PetroCaribe agreement also had a profound effect on millers. Due to high production costs, millers were less able to subsidize their participation in lower price markets where profit margins are low to non-existent. This particularly had a negative impact on those millers who were indebted to financial institutions. Some millers scaled back their operations while others were forced into bankruptcy.. Strategies for Development. In 2013 the government of Guyana formulated a national strategy for Guyana’s agricultural sector entitled “AGRICULTURE–ECONOMIC AND SOCIAL PROSPERITY”. According to the official publication on the strategy… 39.
(16) GILLETTE and SAKAI. “A National Strategy for agriculture in Guyana 2013-2020, Guyana’s vision for Agriculture 2020 seeks to change the view that agriculture is for subsistence livelihood while it also seeks to promote agriculture as a wealth generator and entrepreneurial enterprise, producing food and non-food commodities to meet local and export demand.” (Ministry of Agriculture [17]) Unlike previous agricultural strategies like those applied shortly after independence, which focused on the 5Cs (citrus, cassava, coconut, cocoa and cattle) or the 4Ps approach (pepper, plantain, pineapple, and pumpkin) adopted in recent years, this strategy utilizes the F-5 approach. This strategy was meant to build on strategies previously employed. Below is a brief explanation of what each aspect of the F-5 approach entails. •. Food security- consolidating the end of hunger in Guyana, ensuring everyone in every community has enough food.. •. Fiber and nutritious food accessibility for the citizens – nutrition security for all.. •. Fuel production – helping develop alternative fuel sources, reducing dependence on fossil fuels and creating a bio-energy industry in Guyana.. •. Fashion and health products – an agro-processing industry which will create a new industry in Guyana.. •. Furniture and crafts – an industry which is expected to grow in importance in Guyana (Ministry of Agriculture [17]).. The strategy identified 25 priority areas for success, of which only one was directed towards the development of the rice industry (Table 4). This focused on sustaining high levels of production, creating value-added products and bolstering exports.. Table 4. Guyana’s Vision for Agriculture 2020- Twenty-five Priority Areas for Success. 3 5 7. Vision 2020 Sustaining and Expanding Guyana's Agro-Diversity Policy and Program Water Security and Management (A Modern and Efficient D^I System) Soil Health Increased Livestock Production and Diversity. 9. Sustained High Rice Production and Value-Added for Rice Products and Exports. 10. 11. Increased Crop Production and Diversity. 12. 13. 14. 15 17 19. Marketing of Agricultural Products Internationally Human Resource Development – Improving Training and Capacity Building for Agriculture Developing an Agri-Fuel Industry in Guyana Risk Reduction and Disaster Management. 21 23. Land Availability, Land Zoning, And Land Tenure Strengthened Organizational Structure. 22 24 25. 1. 2 4 6 8. 16 18 20. Farming Systems and Techniques, Biotechnology and Precision Agriculture. Infrastructure Development (Other Than D&I) Plant and Livestock Health and Protection Increased Fish Production and Diversity Sugar Production To >450,000tonnes And ValueAdded Exports Increased Agro-Processing and Value Added Products for Local and Export Market Upgrading of Transportation, Packaging, Storage And Cargo Space. Food and Nutrition Security Environmental Sustainability Hydro-Meteorology Long Term Investment in Research And Development Policies and Legislative Framework Financing Mechanisms for Agriculture. Source: A National Strategy for Agriculture in Guyana 2013-2020 pg. 41. 40.
(17) Vicissitudes of rice. Under this strategy, priority area number 9 which is “Sustained high rice production and value-added rice products and exports”, seven strategic activities along with seven indicators were identified. Table 5. below indicates the number of activities and indicators for each priority area while Table 6. gives a detailed description of those activities and indicators. Table 5. Nine of the 25 priority areas with their associated activities and indicators. 1 2. 3. 4 5. 6 7 8 9. Priority areas Overall goals and indicators Priority area 1: sustaining and expanding Guyana’s agro-diversity policy and program Priority area 2: reorientation and modernization of farming systems, techniques biotechnology and precision agriculture Priority area 3: further advancing water security and water management - drainage and irrigation system expansion and strengthening Priority area 4: continued strengthening of support infrastructure for agriculture - outside of drainage and irrigation Priority area 5: strengthening soil health as an important part of increased productivity and quality Priority area 6: expansion and improvement of plant and animal health to improve production – (a) plant health Priority area 6: expansion and improvement of plant and animal health to improve production – (b) livestock (animal) health Priority area 7: increased production of livestock Priority area 8: increased production of fish and fish products Priority area 9: sustained high production of rice. # of activities. # of indicators. 13. 13. 14. 14. 16. 16. 12. 12. 14. 14. 52. 52. 23 28 49 7. 23 28 49 7. Source: A National Strategy for Agriculture in Guyana 2013-2020 pg. 50. Table 6. List of activities and indicators identifies for priority area number 9 9. 1 2. 3 4 5. 6. 7. PRIORITY AREA 9: SUSTAINED HIGH PRODUCTION OF RICE See various activities described in GRDB’s Rice Strategy 2012-2020. The following See indicators in GRDB’s Rice Strategy 2012- 2020. The activities are some selected ones from the following are some of the indicators taken from the Rice strategy Strategy 2012-2010 Maintain cultivation at average of 80,000 Maintain average rice production greater than 500,000 ha per to maintain production of average tonnes of rice throughout the period to 2020 and above 500,000 tonnes annually 1 cultivation of about 80,000ha per crop Attain paddy yield of at least 6 tonnes per ha by 2 020 with Continue to improve paddy yield per ha 2 no region less than 5.5 tonnes Promote the use of precision farming methods for the rice industry, focusing on (a) More than 40% by 2015 and 80% by 2020 farmers agronomic practices, including soil testing using the 6-point practice promoted by GRDB and balanced nutrition with mixed (b) Rice farms conduct soil testing at least once per year fertilizers 3 (c) fertilizers matching soil test results Promote packaged rice sales for Guyana’s Increase packaged rice sale to about 20% of Guyana’s rice rice 4 sales by 2020 Encouraged value-added rice products, At least 20,000 tonnes of rice are utilized for value-added including flour, cereal and rice snacks 5 products by 2020, with an export component in place At least three rice factories utilizing energy conversion Promote the use of agro-energy technology technology and reducing cost of power by at least 10% per to produce power for the rice industry 6 year by 2020 Review the Rice Factory Act to more The Rice Factory Act is reviewed and recommendations effectively meet the needs of the rice for amendments made to HOD by end of 2014 and industry 7 relevant action by 2016 Source: A National Strategy for Agriculture in Guyana 2013-2020 pg. 66 41.
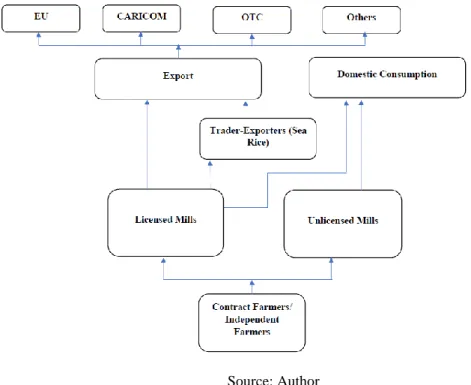
(18) GILLETTE and SAKAI. Based on the list of activities and indicators given in Table 6., emphasis is being placed mainly on production, improved technology and value addition. However, there is no focus on improving the rice supply chain to change the lack of competitiveness in the industry, due to the lack of adequate market players (Fig. 5). There is also no provision to give greater financial incentives to farmers, particularly small farmers, which would aid them in the process of modernization and efficiency enhancement. There is also no real effort to improve financing within the sector to support the modernization of the sector through the use of improved technology. If these matters are not addressed, the industry will continue to face a decline in the number of small farmers and encounter subsequent socioeconomic fallouts resulting from their exit.. Source: Author Fig. 5. Guyana Rice Supply Chain 2011. Conclusion. Guyana’s rice industry had humble beginnings during the 1800s when rice was cultivated on small plots for the sole purpose of supplementing the food rations of slaves working on the Dutch sugar plantations. However, it was the abolishment of slavery and the subsequent arrival of East Indian laborers in 1838 that triggered an increase in demand during the 1850–1860, that created incentives for the production of rice. Furthermore, the suppression of production by the politically powerful sugarcane planter class served to hinder the development of the rice industry. The prolonged crisis faced by the sugar industry during the period 1884 to 1904, which divested the planter class of their political power, was the key factor that catapulted rice production into being a major contributor to the colonial economy. The main institutions that shaped the early rice industry were the Guyana Rice Milling and Marketing Authority (GRMMA), Guyana Rice Export Board (GREB), National Paddy and Rice Grading Centre (NPRGC). However, the policies of these institutions severely restricted farmers. The obvious failure of the policy framework prompted the dismantling of these institutions and led to the subsequent establishment of the Guyana Rice Development Board (GRDB). 42.
(19) Vicissitudes of rice. The change in farmer demographics, more specifically the reduction of the number of small farmer households and the consolidation of land and resources into the hands of fewer larger farmers during the period 1970–1999 was triggered by two main factors. First, by globalization and liberalization and second by the efforts of the Burnham government to correct the historical disparity between African and East Indian ownership and their disparate involvement in the rice industry. Historically Guyana has depended heavily on preferential trade agreements. The most notable of which are those with EU markets as a member of the African, Caribbean, and Pacific (ACP) group of countries through the Cotonou, CARICOM and the PetroCaribe agreement which barter rice for oil. The current strategy for developing the agriculture sector and by extension the rice industry is the “AGRICULTURE– ECONOMIC AND SOCIAL PROSPERITY” strategy, also known as the National Strategy for Agriculture in Guyana 2013-2020. However, this strategy focuses heavily on production, the implementation of new technologies and value addition while neglecting the improvement of the rice supply chain and creating better financial incentives for farmers, (particularly small farmers) which would aid them in the process of modernizing and efficiency enhancement. If not addressed, the before mentioned situations can have dire implications, particularly for small farmers who make up the largest portion of the population of rice-producing rural areas in Guyana. These include the continued reduction in the standard of living, resulting from the loss of livelihood. Therefore, the profitability of rice farming should be investigated in order to ascertain whether or not rice cultivation is a profitable venture, which category of farmers and which factors affect profitability. These will assist the government in developing a more effective and inclusive strategy by yielding the relevant information needed to effectively meet the development needs of all stakeholders involved and more specifically the farmer.. Reference. [1] Caribbean Community Secretariat 2018, REVISED COMMON EXTERNAL TARIFF OF THE CARIBBEAN COMMUNITY. [2] Clegg, P. 2013. Venezuela and oil diplomacy: The end of the road for PetroCaribe? September. http://www.eir.info/2013/09/12/venezuela-and-oil-diplomacy-the-end-of-the-road-forpetrocaribe/ [3] Collymore, C (1986), ‘The plight of agriculture in Guyana’, Thunder 18(2), 31-39 [4] European Commission 2010, The Contonou Agreement, http://www.europarl.europa.eu/intcoop/acp/03_01/pdf/mn3012634_en.pdf [5] Food and Agriculture Organization, http://www.fao.org/nr/water/aquastat/countries/guyana/index.stm [6] Guyana Chronicles, The story of the rice industry in Guyana –as related in an interview with Former GeneralSecretary of RPA, late Mr. Pariag Sukhai May 4, 2015, https://guyanachronicle.com/2015/05/04/the-story-ofthe-rice-industry-in-guyana-as-related-in-an-interview-with-former-general-secretary-of-rpa-late-mr-pariagsukhai [7] Guyana Rice Development Board GRDB Annual Report 2009 [8] Guyana Rice Development Board (GRDB), https://grdb.gy/about-us/ [9] Guyana Rice Development Board (GRDB) annual Report 2016 43.
(20) GILLETTE and SAKAI. [10] Guyana Rice Industry, https://unep.ch/etb/etp/events/Agriculture/guyana.pdf [11] Hanrahan, M S (1982), Expanded Production of FoodCorps in Guyana’s Agriculture Sector Planning Project, prepares by Checci and company of the Guyana Ministry of Agriculture, USAID Contract No 504-0077, Washington DC [12] International Rice Research Institute, Impact of science on rice 120, 1985 [13] Lakhan, V C (1990), ‘Resource development in the agriculture sector of Guyana’, in Wilkinson, P F and Found, W C (eds) Resource Analysis Research in Developing Countries: The Experience of Ontario Geographers Faculty of Environmental Studies, New York University, ON, pp 19-27 [14] Lakhan, V C and Singh, P (1990), ‘Development policies and the performance of Guyana’s agriculture sector’, paper presented at CAGONT/ELDAAG Conference, 13 October, 1990, Brock University, St Catharines, ON [15] Lakhan, V C and Stebelsky, I (1987), ‘The relationship between yield and water management in the rice industry of Guyana’, in Nelson, J G and Knight, K D (eds) Research, Resources and the Environment in Third World Development, Department of Geography, Publication series No 27, University of Waterloo, Waterloo, ON, pp103-112 [16] Lakhan, V C, Rawana, D and Lall, A (1988) ‘Resource allocation in agriculture: the Guyana. experience’, Canadian Journal of Developmental Studies IX(2), 235-245 [17] Ministry of Agriculture, A National Strategy for Agriculture in Guyana 2013-2020 [18] National Development Strategy, Chapter 26: THE RICE INDUSTRY DRAFT April 19, 1996 http://www.guyana.org/NDS/chap26.htm [19] Presentation by the chairman of the Guyana Association of Bankers, Mr. John Tracey, at the Symposium on Agricultural Risk and Insurance, December 7, 2009. [20] United Stated Department of Agriculture Foreign Agriculture Services 2017, Commodity Intelligence Report, (https://ipad.fas.usda.gov/highlights/2017/03/Guyana/index.htm) [21] Wazir Mohamed 2009, Guyana Rice industry a Historical Perspective, Guyana Journal, http://www.guyanajournal.com/Wazir_Mohamed_Guyana_Rice_Industry.html [22] Wenner Mark D. Rogers Roger, Clark Dillon, 2016, Guyana’s PetroCaribe Rice Compensation Scheme Has Ended, Assessment and Policy Implications, Inter-American Development Bank [23] Winston McGowan 2008, The beginning of rice cultivation in Guyana (Part 1), Randall Butisingh’s Weblog, (https://randallbutisingh.wordpress.com/2008/11/18/the-beginnings-of-rice-cultivation-in-guyana-part-13/) [24] Winston McGowan 2008, The beginning of rice cultivation in Guyana (Part 1), Randall Butisingh’s Weblog, (https://randallbutisingh.wordpress.com/2008/11/20/the-beginnings-of-rice-cultivation-in-guyana-part-33/) [25] Winston McGowan 2008, The beginning of rice cultivation in Guyana (Part 2), Stabroek News, (https://www.stabroeknews.com/2008/11/06/features/the-beginnings-of-rice-cultivation-in-guyana-part-2/) [26] World Bank, Guyana Rice Supply Chair, Risk Assessment, February 2011, PG 3. 44.
(21)
図

+4


関連したドキュメント
We use these to show that a segmentation approach to the EIT inverse problem has a unique solution in a suitable space using a fixed point
In recent years, several methods have been developed to obtain traveling wave solutions for many NLEEs, such as the theta function method 1, the Jacobi elliptic function
The main problem upon which most of the geometric topology is based is that of classifying and comparing the various supplementary structures that can be imposed on a
It is also well-known that one can determine soliton solutions and algebro-geometric solutions for various other nonlinear evolution equations and corresponding hierarchies, e.g.,
Then it follows immediately from a suitable version of “Hensel’s Lemma” [cf., e.g., the argument of [4], Lemma 2.1] that S may be obtained, as the notation suggests, as the m A
Our method of proof can also be used to recover the rational homotopy of L K(2) S 0 as well as the chromatic splitting conjecture at primes p > 3 [16]; we only need to use the
Since weak convergence is preserved by continuous mappings, the weak convergence in H α provides weak convergence results for H 0 α -continuous functionals of paths and for some
In this paper we prove in Theorem 5.2 that if we assume (1.1) satisfying the conditions of the Equivariant Hopf Theorem and f is in Birkhoff normal form then the only branches
