Aspartate Aminotransferase Activities in the
Tissues of Tilapia zillii
著者
SAMESHIMA Muneo, NAKASHIMA Hiroyasu
journal or
publication title
鹿児島大学水産学部紀要=Memoirs of Faculty of
Fisheries Kagoshima University
volume
31
page range
175-183
別言語のタイトル
Tilapia zillii組織中のアスパルテート・アミノト
ランスフェラーゼ
Vol. 31 pp. 175-183 (1982)
Aspartate Aminotransferase Activities in the
Tissues of Tilapia zillii
Muneo Sameshima*1 and Hiroyasu Nakashima*1*2
Abstracts
GOT, GDH and SDH activities in various tissues of Tilapia zillii were measured. The activity of the GOT in heart was the highest, followed by liver, brain and intestine. This tendency was very resemble to GOT activities in tissues of Tilapia nilotica l) (recently it has been called Sarotherodon niloticus). In cases of GDH and SDH, the activities were the highest in intestine.
Zymography for the GOT isozymes in the tissues of T. zillii was performed on starch gel at pH 8.4. The cytosol fraction made two distinctive bands and one light band on anode side of the zymogram, whereas the mitochondrial fraction yielded two clear bands on the cathodal side.
According to the results of subcellular fractionation, total GOT activities in liver or intestine of T. zillii was distributed in cytosol and mitochondria as form of s-GOT and m-GOT in the ratio of 4 :6, respectively.
GOT activity is closely related to physiological status of animals2). It is well known that two isozymes of GOT exist in animal cells3,4). One of them is contained in the cytosol and other one
exists in the matrix of the mitochondria. The two isozymes from any tissue differ in chemical,
physical and immunochemical properties, but it has recently been shown that the primary
structures of the isozymes from pig heart are homologous5'. The physiological functions of
aspartate and malate are to make malate-aspartate shuttle by MDH isozyme and GOT isozyme. After oxaloacetate in the mitochondria is converted to aspartate by mitochondrial
GOT, it diffuses across the mitochondrial membrane into the cytosol, where it is converted to
oxaloacetate again by cytosol GOT. Mitochondrial GOT contributes to the conversion of aspartate to glutamate with the aid of a mitochondrial GOT shuttle. On the other hand, it is said that GOT controls the flow of aspertate into nucleic acid metabolism6*. A relationship has
Laboratory of Marine Biochemistry, Faculty of Fisheries, Kagoshima University.
Present address: Kumamoto Fisheries High School, Reihoku-Cho, Kumamoto, 863-25 Japen. Abbreviations: In this paper, following abbrevitions are used.
GOT : Aspartate aminotransferase (EG. 2. 6. 1. 1) GDH : Glutamate dehydrogenase (EC. 1.4. 1.2) SDH : Succinate dehydrogenase (EC. 1.3. 99. 1)
m-GOT : Mitochondrial GOT
s-GOT : Cytosol GOT
MDH : Malate dehydrogenase (EC. 1. 1. 1. 37) LDH : Lactate dehydrogenase (EC. 1. 1. 1. 27) Tris : Tris (hydroxymethyl) aminomethane
176 Mem. Fac. Fish., Kagoshima Univ. Vol. 31 (1982)
been reported between the activity of this enzyme and growth of young chick7), lake
chubsucker (Erimyzon sucetta)B) and green sunfish (Lopomis cyanellus)^.
Previous paper11 has shown the activity of GOT in various tissues of T. nilotica. In order to more fully chracterize the GOT of tilapia tissues, this paper concentrated upon aspects of the isozymes of GOT prepared from the subcellular fractions of the tissues of T. zillii.
Materals and Methods
Reagents: NADH (grade 3, from yeast), MDH and LDH were obtained from Sigma Chemical
Co.. L-Aspartic acid, 2-oxoglutaric acid, pyridoxal-5'-phosphate, sucrose, Triton X-100 and specially prepared reagents for electrophoresis were obtained from Nakarai Chemicals Ltd.,
Kyoto. Potato starch was purchased from Wako Chemical Industries Tokyo.
Animals: T. zillii, which had a body length of 15 to 20 cm, were purchased from Kagoshima
Prefecture Fisheries Experimental Station, Freshwater Branch at Ibusuki. Eel (Anguilla
japonica) was purchased from a local fish market. Liver of pig was supplied from the Municipal Butchery of Kagoshima. Tilapia were cultured in separate tanks, and the water temperature
was maintained between 25 and 27°C.
Preparation of tissues and subcellular fractionation491010: Fishes were killed by
decapitation. The excised internal organs were washed in isolation medium
[sucrose (250
mM), EDTA (1 mM), pH 7-8] and were blotted the excess water with filter paper and were
weighed. The liver was finely chopped with scissorsin isolation medium, washed several times,
and then homogenized in 40 ml of the same medium whth a Potter-Elvehjiem Homogenizer
having a Teflon pestle. The homogenizing procedure was performed in iced water bath. Centrifugal procedure was conducted at 4*C using Centrifuge Kubota KC-70 D and Kubota
KR-180 B. But for the sedimentation of the heavy and light microsomal fractions and cytosol
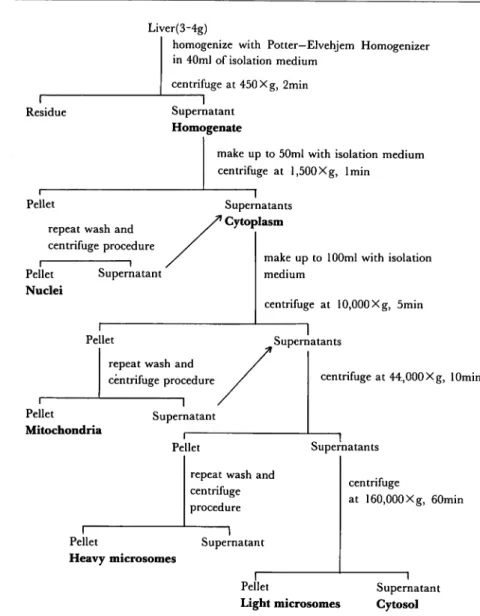
fraction, Ultra Cantrifuge IEC 60 B was used at 4*C. The separated pellets were suspened in distilled water by stirring for 10seconds with Ultra Turrax Homogenizer (IKA-Germany). The fractionation procedure of liver is summarized in Fig.l.
Measurement of protein concentration: The protein concentration was measured by
Lowrys method121.
Enzyme assays: All spectrophotometry measurements were performed with Hitachi 101
Spectrophotometer, with cell housing regulated at 30°C, or Shimadzu UV-200 S Double Beam
Spectrophotometer with U- 125 MU Recorder. Stock solution of substrates were adjusted to pH 7.5 with KOH. Each enzyme activities were expressed as /*. moles of product formed per
minute per g of the fresh tissues.
GOT3'4*1314' The enzyme activity was assayed a modified method of Karmen,3). The assay solution contained 1.5 ml L-aspartate (240mM, pH 7.4), 1.5 ml potassium phosphate buffer (200
mM, pH 7.5),0.2 ml NADH (approximately 0.1 mM), 10 fi\ MDH (750 units, 5 mg protein/ml),
Residue
Pellet
Liver(3-4g)
homogenize with Potter—Elvehjem Homogenizer
in 40ml of isolation medium
centrifuge at 450Xg, 2min 1
Supernatant Homogenate
make up to 50ml with isolation medium centrifuge at l,500Xg, lmin
1
Supernatants
7Cytoplasm
177
repeat wash and centrifuge procedure
make up to 100ml with isolation
medium centrifuge at 10,000Xg, 5min Pellet Nuclei Supernatant I Pellet
repeat wash and centrifuge procedure Pellet Mitochondria Supernatant I Pellet I Pellet Heavy microsomes
repeat wash and centrifuge procedure Supernatant i Supernatants centrifuge at 44,000Xg, lOmin Supernatants centrifuge at 160,000Xg, 60min Pellet Light microsomes Supernatant Cytosol
Fig. 1. Procedure for Subcellular Fractionation of Tilapia Liver.
incubation in the cell containing the mixed solution for 1 minute, reaction was initiated by
addition of 0.2 ml of 2-oxoglutarate (300 mM) and the decrease in O.D. at 340 nm was measured. QDjj4.i5.i6) ^he assay solution consisted of 3 ml potassium phosphate buffer (lOOmM, pH 7.5) containing NH4CI (200mM), EDTA (0.1 mM), 0.2 ml NADH (approximately0.1 mM), 0.15 ml
L-leucine (5 mM), 10 fi\ LDH (550 units, 10 mgprotein/ml), the samplesolution (0.1-0.3 ml) to
be assayed, and 0.2 ml of 10% Triton X~100.
After incubation in the cell apploximately 1
minute at a temperature of30°C, thereaction was initiated byaddition of0.2mlof2-oxoglutarate
(300 mM), and the decrease in O.D. at 340 nm was recorded.178 Mem. Fac. Fish., Kagoshima Univ. Vol. 31 (1982)
SDH,7) The assay solution contained 0.75 ml of potassium phosphate buffer solution (200 mM,
pH 7.5), 0.1 ml of potassium cyanide (45 mM), 0.2 ml of succinic acid (600 mM, pH 7.5), 0.1 ml of 2,6-dichlorophenolindophenol (1.5 mM), 0.3 ml 1% crystalline bovine serum albumin solution, 0.2 ml of phenazine methosulfate (9 mM), 0.2 ml of 10% Triton X-100 solution and 1 ml of water. The reaction was initiatiated by addition of 0.5 ml of the enzyme solution. The decrease in O.D. was recorded at 600 nm.
Starch gel electrophoresis4,8,9202,) Partially hydrolyzed potato starch, prepared by method of
POULIC etal.,m (14 g) was suspended in 100 ml of gel buffer solution and was heated to make a gel plate. The gel buffer is consisted of 90 parts of 16 mM-Tris and 3.3 mM-citric acid, and 10 parts
of 20 mM-lithium hydroxide and 76 mM-bolic acid20*. Electrophresis was performed at 4°Cfor 4
hours at 400 V. The gel was stained for GOT-protein by incubation in 50 ml of Tris-HCI buffer (100 mM, pH 7.4) containing L-aspartate (219 mg), 2-oxoglutarate (131 mg) and fast blue B salt (250 mg).
Results
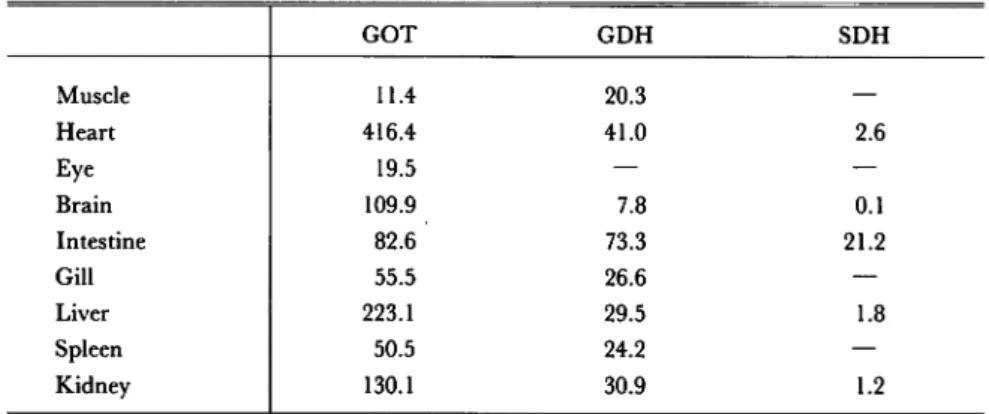
GOT, GDH and SDH activities in several tissues of T. zillii: Table 1 shows GOT, GDH
and SDH activities in several tissues of T. zillii- Prior to measurements of the enzymatic activities, the sample tissues were homogenized with distilled water by Turrax Homogenizer for 5 seconds.
Table 1. GOT, GDH and SDH Activities in Tissues of T. zillii.
GOT GDH SDH Muscle 11.4 20.3 — Heart 416.4 41.0 2.6 Eye 19.5 — — Brain 109.9 7.8 0.1 Intestine 82.6 73.3 21.2 Gill 55.5 26.6 — Liver 223.1 29.5 1.8 Spleen 50.5 24.2 — Kidney 130.1 30.9 1.2
Enzyme activities: p moles of products/g of fresh tissues/min
The GOT activities of heart, liver, brain and intestine were 416.4, 223.1, 109.9 and 82.6 // moles of products/g of fresh tissues/minute, respectively. The activity of GOT in heart was the highest, followed by the liver, brain and intestine in decreasing order. In the case of GDH, the activity was the highest in intestine, followed by heart, kidney and liver. In the case of SDH,
Fig. 2. Starch Gel Electrophoresis of Several Tissue Homogenates from T. zillii and Pig.
Fig. 2 shows the results of starch gel electrophoresis of the same samples. Electrophoresis was
carried out at 4°Cfor 3.5 hours at 400 V. The gels were staind for GOT active proteins.
The
electrophoregrams gave two distinctive cationic bands and two or three anionic bands. Pig liver
was used as a reference.
Effects of pH value and temperature on the enzyme reaction: The effects of pH and
temperature on activity of the GOT prepared from T. zillii Hver. were measured. Fig. 3 shows the effects of pH on the enzyme reaction. The buffer systems used were sodium acetate buffer (for pH 5.4), potassium phosphate buffer (for pH 6.5-8.0) and Tris-HCl buffer (for pH 8.0-9.0). The optimal pH value of the GOT on the enzyme reaction was about pH 8.0. Fig. 4
shows the relation between progress of enzyme reaction and temperature. It was said the GOT was relatively stable to higher temperature.
too
•> 50
PH
Fig. 3. Effect of pH Value on the Activity of GOT from T. zillii Liver.
30 Reaction time
Fig. 4. EfTect of Temperature on the Activity of GOT from T zillii Liver. (pH value of reaction mixture: 8.0)
180 Mem. Fac. Fish., Kagoshima Univ. Vol. 31 (1982)
Distribution of GOT and GDH activities in subcellular fractions from liver and
intestine of T. zillii: Liver of T. zilliiwas fractionated by the method explained in Fig. 1. The
procedure was designed to obtain a high yield of mitochondria and to minimize contamination of cytosol components from particulate fractions. Triton X-100 was used in the assys for GOT and GDH in all fractions. The results shownin Table 2 are protein concentration in the original
Table 2. Protein Concentration of Enzyme Solution.
T. zillii Eel Pig
Liver Intestine Liver Liver
Homogenate 205.6 ^g/ml 150.9 ^g/ml 237.2 ^g/ml 268.8 jug/ml Nuclei 27.1 13.2% 33.8 22.4% 44.8 18.9% 33.3 12.4% Mitochondria 28.8 14.0 19.3 12.8 40.1 16.9 57.5 21.8 Heavy microsomes 17.3 8.4 14.3 9.5 20.2 8.5 31.4 11.7 Light microsomes 20.3 9.9 8.9 5.7 28.2 11.9 14.8 5.5 Cytosol 101.8 49.5 70.5 46.7 103.4 43.6 130.4 48.5 Recovery(%) 95.0 97.1 99.8 99.5
homogenates and fractions. Total activities of the enzymes in the homogenate and subcellular fractions are shown in Table 3. Percentage values of the activities are added in parentheses of the Table. In Tables 2 and 3, livers of eel and pig are used as control. It is evident that for GOT and GDH, the original activity could be accounted for by subsequent fractionation. Recoveries of enzyme activity and protein of liver and intestine of T. zillii were average of about 95%. GOT activity in the liver of the three species, tilapia, eel and pig, and in the intestine of T.
zillii was higher than the GDH activity. In the case of liver and intestine of T. zillii,
contamination of GDH activity in the cytosol fraction was found to be 3.5 and 5.4%,
respectively. Generally speaking, GDH does not exist in the cytosol fraction, therefore the
existance of GDH in the cytosol fraction was considered to be due to contamination by
mitochondrial components.
Starch gel electrophoretic analysis of cytosol and mitochondrial fractions were performed by
the method of Barret etal.,l9) The gels were stained for GOT activity. A tipical example was shown in Fig. 5. The cytosol fraction yielded two distinctive bands and one of light band on the anode side of the zymogram, whereas the mitochondrial fraction yielded two distinctive bands on the cathode side. There were no cathodal band in the cytosol fraction nor anodal band in the mitochondrial fraction.
Table 3. Distribution of Enzyme Activities in Subcellular Fractions Prepared from Tissues of Tilapia, Eel and Pig.
T zillii Liver Intestine GOT GDH GOT GDH Homogenate 257.7(100.0) 79.5(100.0) 77.4(100.0) 68.3(100.0) Nuclei 22.9( 8.9) 9.0( 11.4) 5.0( 6.5) 4.8( 7.0) Mitochondria 93.2( 36.1) 51.8( 65.6) 24.3( 31.4) 35.7( 52.3) Heavy microsomes 18.9( 7.3) 10.3( 13.0) 10.4( 134) 16.1 ( 23.6) Light microsomes 1.7( 0.7) 1.3( 1.6) 2.0( 2.6) 1.5( 2.2) Cytosol 112.0( 43.5) 2.8( 3.5) 31.2( 40.3) 3.7( 5.4) Recovery (%) ( 96.5) ( 95.1) ( 94.2) ( 90.5) Eel Pig Liver Liver GOT GDH GOT GDH Homogenate 431.9(100.0) 78.4(100.0) 130.6(100.0) 99.5(100.0) Nuclei 39.6( 9.2) 12.9( 16.5) 13.8( 10.6) 21.3( 21.4) Mitochondria 158.2( 36.6) 50.0( 63.8) 57.1( 43.7) 65.5( 65.8) Heavy microsomes 24.9( 5.8) 5.9( 7.5) 4.6( 3.5) 1.4( 4.4) Light microsomes 6.2( 1.4) 0.4( 0.5) 2.2( 1.7) 1.6( 1.6) Cytosol 162.1( 37.5) 1.8( 2.3) 50.8( 38.9) 0.9( 0.9) Recovery (%) ( 90.5) ( 90.6) ( 98.4) ( 94.1)
Enzyme activities: ju moles of products/g of fresh tissues/min
( + ) <->
Cytosol fraction
II 1
Mitochondrialfraction
1 1
Fig. 5. Starch Gel Electrophoresis of Cytosol and Mitochondrial Fraction
182 Mem. Fac. Fish., Kagoshima Univ. Vol. 31 (1982)
Discussion
The results in Table 1 indicate that Quantitative activities of GOT, GDH and SDH differ in
various tissues. Intestine and liver had high activities of GOT, GDH and SDH. The results in Fig. 2 show that the electrophretic pattern differs with various tissues in the anionic bands. It is
considered that the anionic bands were subforms ofthe supernatant isozymes and cationic bands
weresubforms of the mitochondrial isozymes based on the report of Baumer et al.,4) and the data
in Fig. 5. GDH is an enzyme restricted to the mitochondria matrix, and this enzyme was
selected as a reference enzyme since it is established as a latent mitochondrial enzyme22).
According to the results shown in Tables 2 and 3, it may be suggested that s-GOT prepared
from the intestine and liver of T. zillii were cotaminated with 3-6% and 4~6% of m-GOT,
respectively, during the fractionation procedure. Therefore, in the cytosol fractions, the activities ofGOT may be 41-44% and 35-42% in liverand intestine, respectively. Boyd3) made similar measurementsof GDH in his studiesof the distribution of GOT activity in rat liver. The
remaining GOT (56-59% and 58-65% in the liver and intestine, respectively) and all of the
GDHand SDH were distributed among the particulate fractions with the highest activities in the
mitochondrial fraction.
Table 3 shows the percentage values of the total activities in the
particulate fractions.Acknowledgement
The authors express their thanks to Professor T. Katayama, Faculty of Fisheries, Kagoshima
University, and Dr. S. Plakas, Collage ofResource Deveropment, University ofRhode Island,for
their critical reading the manuscript.
References
1) SAMESHIMA, M., M.A. MAZID and Y. HORINOUCHI (1980): Mem. Fac. Fish., Kagoshima Univ., 29,
301-312.
2) Wada, H. and H. Kagamiyama (1972): S.Akabori ed. "Koso Handbook", 274-276, Asakura, Tokyo
(in Japanese).
3) BOYD, J.W. (1961): Biochem. J., 81, 434-441.
4) Baumer, M.E. and S. DOONAN (1976): Int. J. Biochem., 7, 119-124. 5) Doonan, GJ. et al. (1974): FEBS Lett., 49, 25-28.
6) Sheid, B., H.P. Morris and J.S. Roth (1965): J. Biol. Chem., 240, 3016-3022. 7) Shrawder, EJ. and M. Martinez-Carrion (1973): J. Biol. Chem., 248, 2147-2152.
8) Champion, M.J. et al. (1975): C.L. Market ed. "Isozyme 3", 417-437, Academic Press, New York.
9) Sarkar, N.K. (1977): Int. J. Biochem., 8, 427-432.
10) HOGEBOOM, G.S. (1955): S.P. COLOWICK et al. ed. "Methods in Enzymology 1", 16-19, Academic Press, New York.
12) LOWRY, O.H. et al. (1951): J. Biol. Chem., 193, 265-270. 13) Karmen, A. (1955): J. Clin. Invest., 34, 131-133.
14) SlZER, I.W. and W.T.Jenkins (1962): S.P. COLOWICK et al. ed. "Methods in Enzymology 5", 677-684,
Academic Press, New York.
15) Prough, R.A., J.M. Culver and H.F. Fisher (1973): J. Biol. Chem., 248, 8528-8536.
16) Souda, K. and H. Misono (1976): T. Yamakawa et al. ed. "Aminosantaisha to Seitaiamin 1", 179-191, Tokyokagakudojin, Tokyo (in Japanese).
17) Bernath, P. and T.P. Singer (1962): S.P. Colowick et al. ed. "Methods in Enzymology 5", 597-609, Academic Press, New York.
18) POULIK, M.D. and O. SMITHIES (1958): Biochem. J., 68, 636-643.
19) Barrett, R.J., H. Friesen and E.B. Astwood (1962): J. Biol. Chem.,231, 432-439.
20) HASHIMOTO, K. and H. Yamanaka (1974): T Saito ed. "Suisanseikagaku Shokuhingaku Jikkensho", 133-144, Koseishakoseikaku, Tokyo (in Japanese).
21) ICHISHIMA, E. (1975): T. Yamakawa et al. ed. "Kosokenkyuho 2", 347-367, Tokyokagakudojin, Tokyo (in Japanese).