Evaluation of energy dependence of nanoDot optically
stimulated luminescence (OSL) dosimeter using
characteristic X-ray induced by medical X-ray equipment
Poster No.: C-0338Congress: ECR 2016
Type: Scientific Exhibit Authors: T. Okazaki1
, T. HASHIZUME2, H. Hayashi3, K. Takegami3, H. Okino3, N. Kimoto3, I. Maehata3, Y. Kanazawa3, I. Kobayashi1;
1
Tsukuba, Ibaraki/JP, 2Tsukuba/JP, 3Tokushima/JP Keywords: Quality assurance, Dosimetric comparison, Radiation
safety, Equipment, Dosimetry, Conventional radiography, Radioprotection / Radiation dose
DOI: 10.1594/ecr2016/C-0338
Any information contained in this pdf file is automatically generated from digital material submitted to EPOS by third parties in the form of scientific presentations. References to any names, marks, products, or services of third parties or hypertext links to third-party sites or information are provided solely as a convenience to you and do not in any way constitute or imply ECR's endorsement, sponsorship or recommendation of the third party, information, product or service. ECR is not responsible for the content of these pages and does not make any representations regarding the content or accuracy of material in this file.
As per copyright regulations, any unauthorised use of the material or parts thereof as well as commercial reproduction or multiple distribution by any traditional or electronically based reproduction/publication method ist strictly prohibited.
Aims and objectives
X-ray examinations are well known as simple fast techniques, and are performed to find causes of disease. In comparison to other techniques such as ultrasonic diagnosis, dose exposure caused by X-ray irradiation should be managed. The dose exposure has however increased [1] with demand of a high quality X-ray image for proper diagnosis. Although there are many detectors for measuring the exposure dose of X-rays [2-4], it is difficult to apply these detectors to measure exposure dose of patients because they interfere with the X-ray image. The exposure dose is generally estimated by air kerma measured with an ionization chamber and by a correction for each patient condition. The correction is known as the back-scatter factor [5-8]. The general method can be used an estimation, but the actual exposure dose of the patients can not be derived. In contrast to the general method, we want to propose a direct measurement method of the exposure dose for each patient.
Recently, a small-size optically stimulated luminescence (OSL) dosimeter, named nanoDot, was developed by Landauer Inc. [9]. The nanoDot OSL dosimeter has a low detection efficiency and does not affect the X-ray image [10,11]. Up to now, we reported on various characteristics of the nanoDot OSL dosimeter for clinical application as shown in Fig. 1. Our previous research is simply categorized as follows: dose measurements [12], basic characteristics [10,13,14] and clinical studies. For clinical studies and applications of the nanoDot OSL dosimeter, evaluation of energy dependence is needed.
Fig. 1: Our previous reports on the nanoDot OSL dosimeter in the diagnostic X-ray region. These are categorized by basic characteristics, dose measurement and clinical study. In the present study, the energy dependence was reported.
References: Technical Office, Nagase-Landauer Inc. - Tsukuba, Ibaraki/JP
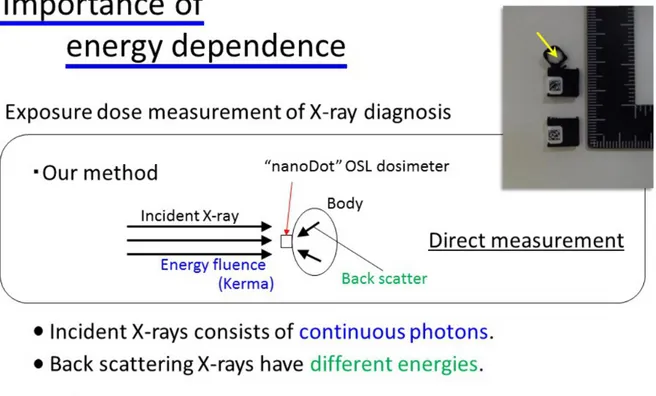
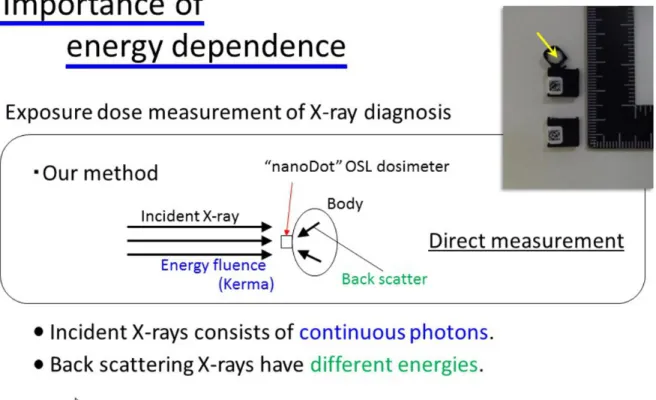
For the dose measurement by means of the nanoDot OSL dosimeter, the dosimeter is worn on the patients' body, and both the incident and back-scattered X-rays are detected. A schematic drawing of our method is presented in Fig. 2. Incident X-rays in general X-ray diagnosis consist of a photon having continuous energies. Back-scattered X-rays are also produced in the human body (patient). For clinical application, we should know the energy dependence of the dosimeter, because the incident and scattered X-rays have continuous energies as mentioned above. In the present study, we propose a novel experimental method for measuring the energy dependence in the diagnostic X-ray region. In the proposed method, characteristics X-rays (mono-energetic X-rays) were used, and this is a new idea. Unfortunately, the nanoDot OSL dosimeter has a higher detection efficiency in the low energy region, and the trend adversely affected the
Fig. 2: Importance of the energy dependence. In actual clinics, X-rays with various energies are produced by equipment, air and body. It is necessary to evaluate the measured dose with the nanoDot OSL dosimeter.
References: Technical Office, Nagase-Landauer Inc. - Tsukuba, Ibaraki/JP
Fig. 1: Our previous reports on the nanoDot OSL dosimeter in the diagnostic X-ray region. These are categorized by basic characteristics, dose measurement and clinical study. In the present study, the energy dependence was reported.
Fig. 2: Importance of the energy dependence. In actual clinics, X-rays with various energies are produced by equipment, air and body. It is necessary to evaluate the measured dose with the nanoDot OSL dosimeter.
Methods and materials
Figure 3 shows materials used in our experiment. Information corresponding to the exposure dose in the nanoDot OSL dosimeter (Landauer, Illinois, USA) was read out as "Counts" using "microStar" which is commercially available by Landauer Inc. Before irradiation of the X-rays, the nanoDot OSL dosimeter was sufficiently initialized to a minimum count of less than 80, using our annealing device [13]. We used diagnostic X-ray equipment (TOSHIBA medical systems, Tochigi, Japan). In order to check and monitor X-rays, a CdTe detector (EMF Japan, Osaka, Japan) was also used. Also, a shielding box [15] for the CdTe detector was applied. In the next paragraph, we explain the concept of our method in addition to experimental settings.
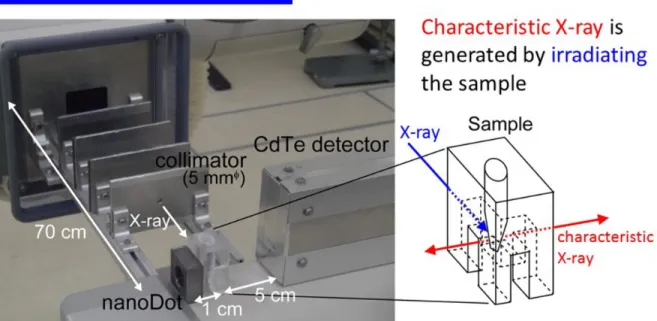
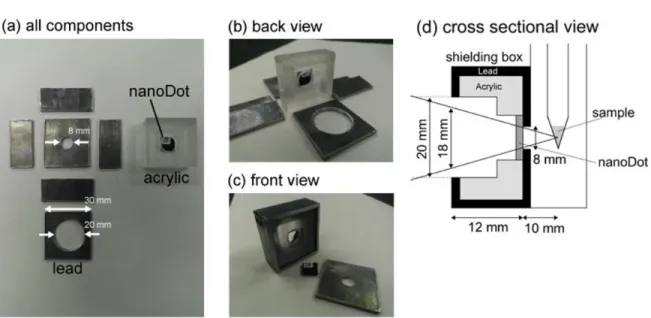
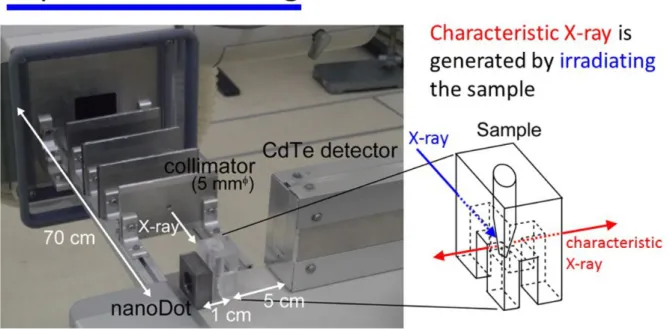
Our method to evaluate the energy dependence of the nanoDot OSL dosimeter uses characteristic rays which are produced by atoms. To produce the characteristic X-rays with energies of the diagnostic X-ray range, metallic samples were irradiated with diagnostic X-rays [15]. Figure 4 shows an experimental setting. The metallic sample, which was located at the distance of 70 cm from the X-ray equipment, was precisely irradiated using our collimation system [16]. An acrylic case holds the samples as represented by the close-up view in Fig. 4. Then, the characteristic X-rays were generated by the sample. In the experiments, we used fourteen different metallic samples as listed in Fig. 5. Because the energies of the characteristics K X-rays produced by Carbon and/or Oxygen are negligibly small, elemental substance or oxidation product was applied to the experiments. The energy ranges of the produced characteristic K X-rays were 8.1 keV to 75.5 keV. Here, the characteristic K X-X-rays were detected with the nanoDot OSL dosimeter and the CdTe detector, which are facing parallel to the sample. The nanoDot OSL dosimeter and CdTe detector were located at the distances of 1 cm and 5 cm from the sample, respectively. These conditions were determined with the following two considerations. The first is that the nanoDot OSL dosimeter has a low detection efficiency, therefore it was located at a minimum distance from the sample for the efficiency of the experiments. The second is that the CdTe detector causes a pile-up effect depending on the incident photon number, therefore the distance was determined as the photon number having the unit of CPS (count per second) which is less than 10000 cps [17-19]. In addition to the consideration of experimental settings, these detectors were covered with lead plates to prevent the detection of unnecessary scattered X-rays. Figure 6 shows a shielding case for the nanoDot OSL dosimeter. Figure 6 (a) represents all components of the case. Lead plates were used for shielding. The nanoDot OSL dosimeter can be set at in an acrylic holder. Figure 6 (b) and (c) represent the conditions before and after construction, respectively. When a researcher carries out the X-ray measurements, the nanoDot OSL dosimeter is set in the through hole of the acrylic case of Fig. 6 (c), and then the front lead plate is attached. As shown in the cross sectional view Fig. 6 (d), the shielding case was designed so as not to generate unnecessary X-rays.
Fig. 4: Experimental setting. The characteristic X-rays were produced by irradiating the metallic sample with collimated X-rays. And, the produced X-rays were detected with the two detectors. The experimental conditions were properly design using various thought processes.
Fig. 5: Metallic samples used to produce characteristic X-rays. The material types were the elemental substance or an oxidation product, and the produced energies were 8.1 to 75.5 keV.
Fig. 6: Shielding case for the nanoDot OSL dosimeter. All components were prepared before construction ((a), (b)). In the experiments, the dosimeter was placed on the acrylic case, and in the front lead was attached ((c)). The unnecessary X-rays are not detected through its proper design ((d)).
References: Technical Office, Nagase-Landauer Inc. - Tsukuba, Ibaraki/JP
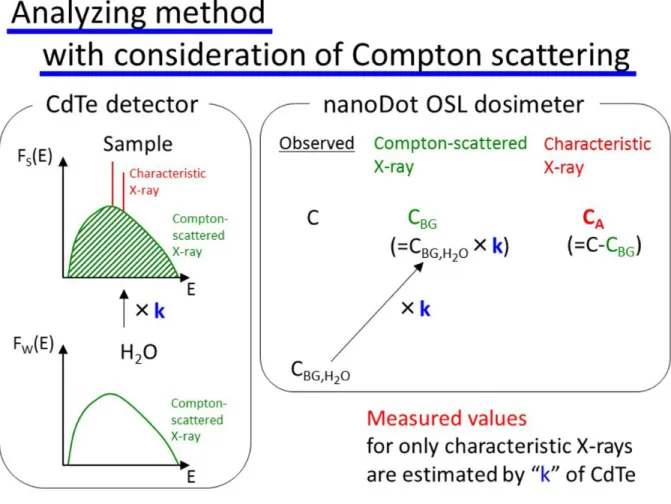
In this paragraph, we will explain the analyzing method based on the spectra measurement with the CdTe detector. Theoretically speaking, metallic samples generate both the characteristic K X-rays, which we need, and Compton-scattered X-rays, which become contamination (background: BG). Figure 7 illustrates the concept of BG subtraction, and the original idea of the subtraction was previously reported [20]. In the present study we applied this idea to BG subtraction of "Counts" measured with the nanoDot OSL dosimeter. Because a water sample generates only Compton-scattered X-rays, the component of the characteristic K X-rays can be extracted by the subtraction of Compton-scattered X-rays as shown in Fig. 7.
Fig. 7: Principle of our analysis method. Base on the measured spectra, the component of Compton scattered X-rays were estimated. Using the constant for estimation, the components of only the characteristic X-rays were determined.
References: Technical Office, Nagase-Landauer Inc. - Tsukuba, Ibaraki/JP
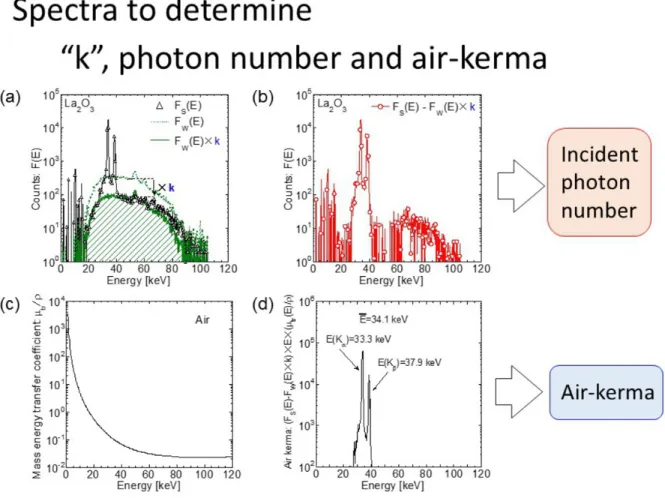
The spectra for the analyzing method are shown in Fig. 8 (a), for example, the La2O3
sample; the original measured spectrum is FS(E), and water sample is FW(E). Then, "k"
factor is determined so as to agree with the shape of the BG components between Fs(E) and Fw(E). Figure 8 (b) shows the BG subtracted spectrum. The peaks of characteristic K X-rays are clearly observed; the denominator of equation (1) of Fig. 9 was calculated from the spectrum. For calculation of the air-kerma, a mass energy transfer coefficient, µtr/#, was represented in Fig. 8 (c) [21]. Then, as shown in the denominator of equation
(2) in Fig. 9, the air-kerma Fig. 8 (d) was calculated by multiplying the spectrum of the characteristic X-ray Fig. 8 (b) with the µtr/# Fig. 8 (c).
Fig. 8: Spectrum analysis. Using the spectrum of water sample, k factor was
determined ((a)). Incident photon number was calculated by the subtracted spectrum ((b)). Air-kerma was also derived by the spectrum (d) with consideration of the mass energy transfer coefficient (c).
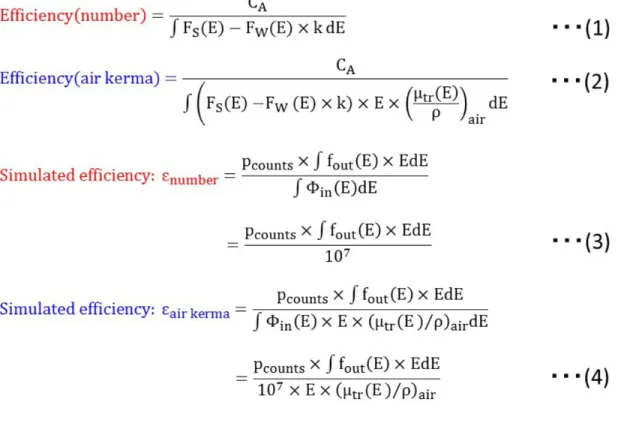
Fig. 9: Equations to calculate the energy dependence for experiments and simulations. Efficiencies based on number (1) and air-kerma (2) were derived by spectra and Counts after analyses. Simulated efficiencies ((3),(4)) were based on our previous report.
References: Technical Office, Nagase-Landauer Inc. - Tsukuba, Ibaraki/JP
Next, using the same "k" factor, the actual counts for the nanoDot OSL dosimeter were also estimated. In the experiments, the counts of metallic samples, C, and of a water sample, CBG.H2O, were measured. In the same manner to the spectrum analysis, the
counts of the characteristic K X-rays, CA, were estimated by consideration of the BG
counts, CBG, as shown in Fig. 7. The calculated counts of CA are used in equations (1)
and (2) of Fig. 9.
counts was derived from the energy spectrum in the detector region [11]. The simulated efficiencies based on the photon number and the air-kerma were calculated using equations (3) and (4) in Fig. 9, respectively. Pcounts represents efficiency which concerns
all physical processes from emission of luminescent light to detection. The fout(E)
indicates the energy spectrum in the detection area, and the #in(E) indicates the spectrum
introduced to the detection area.
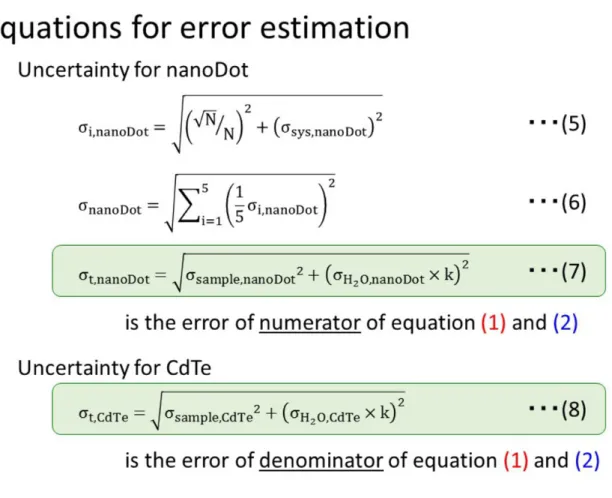
For evaluation of our method, uncertainties of the measured values for the nanoDot OSL dosimeter and CdTe detector were calculated. These uncertainty consist of statistical error and systematic error. In the counts measured with the nanoDot OSL dosimeter, the statistical error is indicated by the ratio of the square root of the observed counts to the counts. In the previous report [10], we evaluated the systematic error, #sys,nanoDot,
and found it to be 5%. The uncertainty for a measurement, #i,nanoDot, was derived by
equation (5) as shown in Fig. 10. Here, because the measurements were performed 5 times, the uncertainty, #nanoDot, was expressed by equation (6). In this study, we applied
the subtraction method. Therefore, the total uncertainty, #t,nanoDot, was derived using the
uncertainties of the metallic sample, #sample,nanoDot, water sample, #H2O,nanoDot, and k
factor as shown in equation (7). In the same manner, the total uncertainty for the CdTe detector, #t,CdTe, was derived by equation (8). Finally, the uncertainties of the energy
Fig. 10: Equations for error estimations based on our analysis method. The
uncertainties were evaluated by an error propagation formula. (7) and (8) show the total uncertainties for the nanoDot OSL dosimeter and CdTe detector, respectively.
References: Technical Office, Nagase-Landauer Inc. - Tsukuba, Ibaraki/JP
Fig. 3: Materials used in our experiments. The nanoDot OSL dosimeter was initialized by our annealing system. The measured counts of the dosimeter were derived by microStar. In addition, the incident X-rays were evaluated by a CdTe detector.
Fig. 4: Experimental setting. The characteristic X-rays were produced by irradiating the metallic sample with collimated X-rays. And, the produced X-rays were detected with the two detectors. The experimental conditions were properly design using various thought processes.
Fig. 5: Metallic samples used to produce characteristic X-rays. The material types were the elemental substance or an oxidation product, and the produced energies were 8.1 to 75.5 keV.
Fig. 6: Shielding case for the nanoDot OSL dosimeter. All components were prepared before construction ((a), (b)). In the experiments, the dosimeter was placed on the acrylic case, and in the front lead was attached ((c)). The unnecessary X-rays are not detected through its proper design ((d)).
Fig. 7: Principle of our analysis method. Base on the measured spectra, the component of Compton scattered X-rays were estimated. Using the constant for estimation, the components of only the characteristic X-rays were determined.
Fig. 8: Spectrum analysis. Using the spectrum of water sample, k factor was determined ((a)). Incident photon number was calculated by the subtracted spectrum ((b)). Air-kerma was also derived by the spectrum (d) with consideration of the mass energy transfer coefficient (c).
Fig. 9: Equations to calculate the energy dependence for experiments and simulations. Efficiencies based on number (1) and air-kerma (2) were derived by spectra and Counts after analyses. Simulated efficiencies ((3),(4)) were based on our previous report. © Technical Office, Nagase-Landauer Inc. - Tsukuba, Ibaraki/JP
Fig. 10: Equations for error estimations based on our analysis method. The uncertainties were evaluated by an error propagation formula. (7) and (8) show the total uncertainties for the nanoDot OSL dosimeter and CdTe detector, respectively.
Results
Figure 11 shows examples of spectra measured using Cu, Nb2O3, In, Cs2O3, WO3
and Au samples. In the spectra of Cu, Nb2O3 and In samples having relatively-lower
atomic numbers, characteristic K X-rays show up significantly. In contrast, the spectra of Cs2O3, WO3 and Au having relatively-higher atomic numbers show the residual counts
and characteristic L X-rays in addition to characteristic K X-rays. The effects based on these contaminations will be discussed later. Using these spectra, the incident photon number and air-kerma were calculated. Also, the analyzed counts of the nanoDot OSL dosimeter for all samples, CA, were summarized in Fig. 12.
Fig. 11: Examples of measured spectra after subtraction. Using the data, photon number and air-kerma were calculated. The residual counts are showed in the spectra
Fig. 12: Summary of calculation results. CA shows the analyzed counts of the nanoDot OSL dosimeter. Relative energy dependent efficiencies for each sample are derived based on the simulated results. Correction factors are used to correct the residual counts of subtraction method.
References: Technical Office, Nagase-Landauer Inc. - Tsukuba, Ibaraki/JP
Figure 13 shows the energy dependence of the nanoDot OSL dosimeter, (a) and (b) are the efficiency based on the photon number and air-kerma, respectively. The horizontal axis indicates the energy and the vertical axis indicates the efficiency. The open squares and closed circles indicate the experimental and simulation results, respectively. Here, the simulated values were normalized by the maximum point, and the experimental values were plotted so as to be minimize the mean square deviation from the simulation results. The plotted values were represented as the relative efficiency in Fig. 12. From the results, it is found that the maximum point is about 8 keV for "Efficiency(number)" and then the efficiency rapidly decreased as the energy increased. On the other
Fig. 13: Energy dependence based on number (a) and air-kerma (b). All data were normalized by each simulated maximum point. The experimental data with correction (see Fig.14) are in good agreement with the simulated one.
References: Technical Office, Nagase-Landauer Inc. - Tsukuba, Ibaraki/JP
Figure 14 demonstrates the correction method. For the example, the spectra for the Nb2O3 sample has a low atomic number and the Au sample has a high atomic
number. Using the simulated results represented in Fig. 13, correction factors were determined to estimate the efficiency of only the characteristic K X-ray. The correction factors, CF, for the "Efficiency(number)" and "Efficiency(air kerma)" were calculated using the equation in Fig. 14 and they were summarized in Fig. 12. The experimental values "Experiment(original)" were divided by the "CF", and the corrected values "Experiment(corrected)" are shown by open circles of Fig. 13. Here, the uncertainties of the experimental data, which are summarized in Fig. 12, were applied to the experimental
Fig. 14: Correction method of the residual counts. Based on the simulated results, only the component for the characteristic K X-rays were estimated as correction factor, CF. The correction results are represented in Fig.13.
References: Technical Office, Nagase-Landauer Inc. - Tsukuba, Ibaraki/JP
Fig. 11: Examples of measured spectra after subtraction. Using the data, photon number and air-kerma were calculated. The residual counts are showed in the spectra of high atomic number samples. The effects were discussed in Fig.14.
Fig. 12: Summary of calculation results. CA shows the analyzed counts of the nanoDot OSL dosimeter. Relative energy dependent efficiencies for each sample are derived based on the simulated results. Correction factors are used to correct the residual counts of subtraction method.
Fig. 13: Energy dependence based on number (a) and air-kerma (b). All data were normalized by each simulated maximum point. The experimental data with correction (see Fig.14) are in good agreement with the simulated one.
Fig. 14: Correction method of the residual counts. Based on the simulated results, only the component for the characteristic K X-rays were estimated as correction factor, CF. The correction results are represented in Fig.13.
Conclusion
In this paper, the energy dependence of the small-type OSL dosimeter named nanoDot was measured based on the generation of the characteristic X-rays. For the proper measurement in the diagnostic X-ray region, we newly propose experimental and analytic methods. The characteristic X-rays produced by metallic samples were detected with a nanoDot OSL dosimeter and a CdTe detector. Based on the spectrum measurements, the values of only the characteristic K X-rays for each detector were estimated. In this way, the energy dependent efficiencies were derived using each value estimated by our analysis. In addition, the Monte-Carlo simulation was carried out for evaluation of the experimental results. The disadvantage of our method is has a high sensitivity against characteristic L X-rays in addition to characteristic K X-rays when the researcher wants to know the data for the high energy region, (greater than 60 keV). In the discussion, the correction was also carried out with the help of the measured spectra and simulated calculation. As a result, all experimental data including the correction of the characteristic L X-ray were in good agreement with the simulated data. Through this study, it is further expected to measure the precise direct measurement of entrance skin dose in the diagnostic X-ray region by means of the nanoDot OSL dosimeter.
Personal information
References
[1] Uffmann M, Prokop CS. Digital radiography: The balance between image quality and required radiation dose. European Journal of Radiology. 2009;72:202-208.
[2] Komiya I, Shirasaka T, Umezu Y, Tachibana M, Izumi. Patient Dose Measurement with Fluorescent Glass Dosimeter: Characteristics Evaluation and Patient Skin Dose Measurement in Abdominal Interventional Radiology. Japanese Journal of Radiological Technology. 2003;60(2):270-277.
[3] Shortt CP, Malone L, Thornton J, Brennan P, Lee MJ. Radiation protection to the eye and thyroid suring diagnostic cerebral angiogralhy: A phantom study. Journal of Mesical
[4] Matsunaga Y, Kawaguchi A, Kobayashi K, Asada Y, Takikawa Y, Yamada M, Suzuki S. Dose Estimation for Exposure Conditions of Diagnostic Radiology Acquired by a 2011 Questionnaire in a Phantom Study. Japanese Journal of Radiological Technology. 2013;69(12):1372-1378.
[5] Grosswendt B. Backscatter factors for x-rays generated at voltages between 10 and 100 keV. Physics in Medical and Biology. 1954;29(5):579-591.
[6] Klevenhagen SC. Experimentally determined backscatter factors for x-rays generated at voltages between 16 and 140 kV. Physics in Medical and Biology. 1989;34(12):1871-1882.
[7] Grosswendt B. Dependences of the photon backscatter factor for water on source-to-phantom distance and irradiation field size. Physics in Medical and Biology. 1990;35(9):1233-1245.
[8] Kato H. Method of Calculating the Backscatter Factor for Diagnostic X-rays Using the Differential Backscatter Factor. Japanese Journal of Radiological Technology. 2001;57(12):1503-1510.
[9] Jursinic PA. Characterization of optically stimulated luminescent dosimeters, OSLDs, for clinical dosimetric measurements. Medical Physics. 2007;34(12):4594-4604.
[10] Hayashi H, Nakagawa K, Okino H, Takegami K, Okazaki T, Kobayashi I. High accuracy measurements by consecutive readings of OSL dosimeter. Medical Imaging and Information Sciences. 2014;31(2):28-34.
[11] Takegami K, Hayashi H, Nakagawa K, Okino H, Okazaki T, Kobayashi I. Measurement method of an exposed dose using the nanoDot dosimeter. European Congress of Radiology (EPOS). 2015; DOI:10.1594/ecr2015/C-0218
[12] Takegami K, Hayashi H, Okino H, Kimoto N, Maehata I, Kanazawa Y, Tohru O, Kobayashi I. Practical calibration curve of small-type optically stimulated luminescence (OSL) dosimeter for evaluation of entrance-skin dose in the diagnostic X-ray. Radiological Physics and Technology. 2015;8:286-294.
[14] Hayashi H, Takegami K, Okino H, Nakagawa K, Okazaki T, Kobayashi I. Procedure to measure angular dependences of personal dosimeters by means of diagnostic X-ray equipment. Medical Imaging and Information Sciences. 2015;32(1):8-14.
[15] Fukuda I, Hayashi H, Takegami K, Konishi Y. Development of an Experimental Apparatus for Energy Calibration of a CdTe Detector by Means of Diagnostic X-ray Equipment. Japanese Journal of Radiological Technology. 2013;69(9):952-959.
[16] Takegami K, Hayashi H, Konishi Y, Fukuda I. Development of multistage collimator for narrow beam production using filter guides of diagnostic X-ray equipment and improvement of apparatuses for practical training. Medical Imaging and Information Sciences. 2013;30(4):101-107.
[17] Debertin K, Schötzig U. Limitations of the pulser method for pile-up corrections in Ge(Li)-spectrometry. Nuclear Instruments and Methods. 1977;140(2):337-340.
[18] Then SS, Geurink FDP, Bode P, et al. A pulse generator simulating Ge-detector signals for dead-time and pile-up correction in gamma-ray spectrometry in INAA without distortion of the detector spectrum. Journal of Radioanalytical and Nuclear Chemistry. 1997;215(2):249-252.
[19] Cano-Ott D, Tain JL, Gadea A. Pulse pileup correction of large NaI(Tl) total absorption spectra using the true pulse shape. Nuclear Instruments and Methods in Physics Research A. 1999;430:488-497.
[20] Okino H, Hayashi H, Nakagawa K, et al. Measurement of Response Function of CdTe Detector Using Diagnostic X-ray Equipment and Evaluation of Monte Carlo Simulation Code. Japanese Journal of Radiological Technology. 2014;70(12):1381-1391.
[21] Hubbell JH. Photon Mass Attenuation and Energy-absorption Coefficients from 1 keV to 20 MeV. The International Journal of Applied Radiation and Isotopes. 1982;33:1269-1290.
[22] Hirayama H, Yoshihito N, Bielajew AF, Wilderman SJ, Nelson WR. The EGS5 Code System. SLAC Report number: SLAC-R-730. KEK Report number: 2005-8. 2013.
[24] Knoll GF. Radiation detection and measurement third edition. John Willey & Sons, Inc. 1992;48-64.