ORIGINAL
Usefulness of presepsin / creatinine ratio as a new index that
corrects for renal function
Masashi Miyoshi1, Yusuke Inoue1, Mai Nishioka1, Akishige Ikegame2, Takayuki Nakao1, Tetsuji Takayama3, and Kojiro Nagai4
1Department of Medical Technology, Tokushima University Hospital, Tokushima, Japan, 2Department of Medical Technology, Kagawa Pre-fectural University of Health Sciences, Kagawa, Japan, 3Department of Gastroenterology and Oncology, Tokushima University Hospital, Tokushima, Japan, 4Department of Nephrology, Tokushima University Hospital, Tokushima, Japan
Abstract : Background : Presepsin (P-SEP) is a highly specific sepsis marker, and its fluctuation with respect to advanced renal impairment or sample agitation has not been fully investigated. We evaluated several renal function-corrected P-SEP indices to establish a simple index and its reference range. Methods : Blood samples for P-SEP measurement were collected with minimal agitation. P-SEP levels were measured using the rapid auto-mated immunoanalyzer “PATHFAST.” This study included 85 chronic kidney disease (CKD) patients, 65 healthy volunteers, and 4 sepsis patients. Results : Patients stratified by estimated glomerular filtration rate (GFR) had significantly higher P-SEP levels for CKD stage G3, especially the advanced GFR stage. We evaluated prese-psin / creatinine (P-SEP / CRE) and P-SEP / eGFR ratios as possible indices for renal function. The P-SEP / CRE ratio exhibited no increase correlating with the GFR stage and was identical in the normal and CKD groups ; P-SEP / eGFR decreased if GFR stage worsened. The P-SEP / CRE ratio became significantly higher in sepsis pa-tients and was a more useful index with a reference range of 67–263. Conclusions : P-SEP levels were inversely correlated with renal function, indicating the necessity to consider the influence of renal impairment in CKD patients. The P-SEP / CRE ratio is helpful for sepsis diagnosis, even in patients with renal impairment. J. Med. Invest. 68 : 105-111, February, 2021
Keywords : presepsin, chronic kidney disease, sepsis, creatinine, glomerular filtration rate
INTRODUCTION
Sepsis is a disease that results in a systemic inflammatory response syndrome (SIRS) due to an uncontrolled host response to infection. Severe sepsis with organ failure or shock has a high mortality rate, and early diagnosis and intervention are important (1, 2). However, SIRS is not only associated with infection. Therefore, it is necessary to accurately distinguish between septic SIRS and non-infectious SIRS caused by trauma or burns ; consequently, it is essential to diagnose the underlying causative infectious disease. However, it takes several days to receive the results of bacterial culture tests, and the tests are not always positive. Therefore, biomarkers that can specifically diagnose sepsis have been investigated.
In 1993, it was reported that the level of procalcitonin (PCT), a precursor of calcitonin, was elevated in sepsis patients (3), and it has been widely used as an index for diagnosis and evaluation of therapeutic effects (4-6). However, PCT has certain drawbacks, such as high values even in non-infectious inflammation or trau-ma cases and difficulty in describing the clinical course (7, 8).
Presepsin (P-SEP) is a glycoprotein composed of approximate-ly 70 amino acids, which was discovered in 2002, and is used as a specific biomarker for sepsis (9, 10). Various clinical studies have been conducted to explore its usefulness. Unlike existing biomarkers, such as PCT, P-SEP exhibits a very weak response to inflammation due to trauma and burns. It is very specific for
bacterial infections (7, 8, 10-12) as it shows a rapid increase. Additionally, it is responsive to changes in patients’ medical con-ditions and reflects the effect of treatment.
However, P-SEP has a molecular weight of 13 kDa, which is comparable to that of cystatin C (Cys-C). As reported by Nagata
et al. (13) and verified by Miyoshi et al. (14), the kidney is the
main excretion organ of P-SEP. Therefore, P-SEP is elevated in patients with kidney disease, such as those undergoing dialysis. High P-SEP levels due to renal impairment may lead to incorrect diagnosis, and this should be considered when diagnosing sepsis in patients with chronic kidney disease (CKD). Thus, there is a need for renal function-corrected indices. Furthermore, for P-SEP measurement, the manufacturer’s protocol advises that the intensity of agitation during blood collection and transpor-tation affect the results. This influence of agitranspor-tation and trans-portation is not recognized in clinical settings. Therefore, it is possible that false high values are reported in clinical practice or research.
In this study, we analyzed the relationship between P-SEP levels and renal function by standardizing the blood collection procedures to minimize the influence of stirring. Moreover, we evaluated the usefulness of presepsin / creatinine (P-SEP / CRE) ratio as a new index that corrects for renal function.
PATIENTS AND METHODS
Selection and description of participants
Eighty-five outpatients with CKD who visited Tokushima University Hospital between May and September 2017 were enrolled in this study. None of the enrolled patients had a history of dialysis or symptoms of infection. Infection was diagnosed by physicians based on clinical manifestations or laboratory results. The Journal of Medical Investigation Vol. 68 2021
Received for publication September 29, 2020 ; accepted November 23, 2020.
Address correspondence and reprint requests to Masashi Miyoshi, Department of Medical Technology, Tokushima University Hospi-tal, 2-50-1 Kuramoto-cho, Tokushima-shi, Tokushima, Japan and Fax : +81-88-633-7241.
We confirmed that the involved patients with estimated glomer-ular filtration rate (eGFR) > 60 mL / min / 1.73 m2 had kidney abnormalities such as albuminuria, urine sediments, electrolyte, and other abnormalities due to tubular disorders, abnormalities detected by histology, or structural abnormalities detected by imaging. The abnormalities were present for more than three months.
Blood samples and data were collected from 4 patients with sepsis and 65 healthy volunteers (hereafter, normal group) consisting of doctors, clinical laboratory technicians, and med-ical students who were recruited from our institute. For the 4 patients with sepsis, the first blood sampling was performed at the time when the physician diagnosed sepsis, thereafter, blood sampling was performed daily for up to 5 days of illness to ob-tain a total of 19 samples. The non-infected group included 150 patients, including CKD patients and normal group. Data of the clinical characteristics of the participants and sepsis patients are shown in Table 1.
Informed consent was obtained from all the patients and volunteers after written information provision. Permission for this study protocol and consent procedure were approved by the Ethics Committee at Tokushima University Hospital (No. 2699), and this study was performed in compliance with the Helsinki Declaration.
Blood collection, biochemical analysis, and samples
As P-SEP levels are increased by strong agitation, blood samples after completing blood count measurements cannot be used. Thus, samples were collected separately into EDTA-2K blood collection tubes for P-SEP measurements. At the time of blood sampling, five gentle inversions were performed. The blood sample was transported in a manner that prevented agitation, and the tests were conducted within 10 mins of blood collection.
The eGFR of each participant was calculated using the equa-tion provided by the Japanese Society of Nephrology as follows :
eGFRcreat (mL / min / 1.73 m2) = 194 × creatinine (mg / dL)-1.094 × age-0.287 (if female, × 0.739) (15)
The GFR was categorized according to the Kidney Dis-ease : Improving Global Outcomes (KDIGO) 2012 guidelines (16).
Technical information
P-SEP levels were measured by a rapid automated immu-noanalyzer, “PATHFAST” (LSI Medience Corporation, Tokyo, Japan), based on a chemiluminescent enzyme immunoassay.
The reference range of the P-SEP / CRE ratio was calculated using a non-parametric method. All values were listed in order according to the Clinical and Laboratory Standards Institute guidelines. Values of 2.5–97.5% were used as the reference range. Excision of extremes was not performed (17).
Statistical analysis
All values are shown as mean ± standard deviation (SD). The results were analyzed using Student’s paired T test for compar-ison between two groups. The Kruskal–Wallis test along with the Bonferroni post hoc test was used for multiple comparisons.
Statistical analyses were performed using EZR (Saitama Med-ical Center, Jichi MedMed-ical University, Saitama, Japan) (18). A P
value < 0.05 was considered to be significant.
RESULTS
Influence of agitation on P-SEP measurements
To confirm the influence of agitation due to mixing with in-version, the number of inversions during blood collection was increased from 5 to 30 occurrences in 10 healthy volunteers. The fluctuation of P-SEP levels was confirmed. Furthermore, if strong agitation and impact were applied, samples were ana-lyzed that were sent by an air shooter used for transportation of
Table 1. Clinical characteristics of participants in the different GFR categories and sepsis patients
Normal G1 G2 G3 G4 G5 Sepsis
N 65 15 19 26 15 10 4 (19 samples)
Age 33.2 ± 11.8 36.8 ± 10.2 57.6 ± 13.9 59.7 ± 15.7 61.3 ± 13.1 66.9 ± 12.8 68.3 ± 12.0
Male, n (%) 31 (47.7) 8 (53.3) 14 (73.7) 19 (73.1) 10 (66.7) 6 (60.0) 2 (50.0)
Body surface area (m2) 1.612 ± 0.18 1.767 ± 0.22 1.677 ± 0.18 1.727 ± 0.20 1.677 ± 0.23 1.556 ± 0.15 NA
AST (U / L) 18.1 ± 5.9 24.4 ± 14.9 20.8 ± 5.9 25.1 ± 9.0 20.0 ± 6.0 20.2 ± 7.5 179.1 ± 224.9
ALT (U / L) 15.9 ± 14.9 23.8 ± 13.0 17.4 ± 7.8 23.0 ± 11.3 13.2 ± 4.6 14.5 ± 4.1 97.0 ± 94.5
Creatinine (mg / dL) 0.722 ± 0.15 0.624 ± 0.09 0.834 ± 0.13 1.307 ± 0.33 2.218 ± 0.50 4.956 ± 2.27 2.648 ± 2.05
Blood urea nitrogen (mg / dL) 13.4 ± 3.1 10.9 ± 2.5 14.8 ± 3.5 21.7 ± 7.8 33.0 ± 8.4 55.4 ± 19.0 NA
eGFRcreat (mL / min / 1.73 m2) 91.0 ± 12.5 102.9 ± 10.6 69.9 ± 6.8 43.8 ± 10.5 23.5 ± 3.5 10.4 ± 3.4 43.4 ± 43.3
White blood cells (×109 / L) 5.6 ± 1.2 6.9 ± 2.8 6.1 ± 1.2 5.9 ± 1.4 5.2 ± 1.6 6.3 ± 2.1 11.1 ± 6.4
Hemoglobin (g / dL) 13.6 ± 1.4 14.6 ± 1.3 13.5 ± 1.9 13.7 ± 1.7 12.3 ± 1.3 10.9 ± 1.3 8.7 ± 2.7
Hematocrit (%) 41.0 ± 4.1 43.2 ± 3.3 39.6 ± 4.7 40.2 ± 4.6 36.5 ± 3.7 33.3 ± 3.3 30.0 ± 4.7
Platelets (×109 / L) 248.8 ± 49.1 276.1 ± 72.5 240.1 ± 49.2 237.7 ± 49.7 312.5 ± 399.2 191.2 ± 42.1 103.7 ± 41.6
Data are presented as means ± standard deviation and as numbers (%).
Estimated glomerular filtration rate (eGFR) values were categorized by eGFRcreat according to the KDIGO 2012, as follows : G1 :
eGFRcreat ≥ 90 mL / min / 1.73 m2; G2 : eGFRcreat = 60–90 mL / min / 1.73 m2 ; G3 : eGFRcreat = 30–60 mL / min / 1.73 m2; G4 : eGFRcreat =
15–30 mL / min / 1.73 m2 ; and G5 : eGFRcreat ≤ 15 mL / min / 1.73 m2.
AST, aspartate transaminase ; ALT, alanine transaminase ; eGFRcreat, estimated glomerular filtration rate calculated using creati-nine values; NA, not available.
samples between wards.
Therefore, the average value ± SD for healthy subjects with five gentle inversions was 82 ± 13 pg / mL. The average values ± SD when the number of inversions was set at 10, 20, and 30 were 100 ± 18 pg / mL, 117 ± 21 pg / mL, and 137 ± 23 pg / mL, respec-tively. The larger number of inversions caused the higher levels of P-SEP. Samples sent using an air shooter showed a remark-able increase of 290 ± 81 pg / mL (Fig. 1).
Stratified comparison in CKD patients
In CKD patients, P-SEP levels were stratified by GFR stage classified using eGFRcreat (Fig 2). P-SEP levels in each group were as follows : normal : 96.4 ± 27.0 pg / mL, CKD stage G1 : 104.8 ± 32.0 pg / mL, CKD stage G2 : 124.7 ± 46.7 pg / mL, CKD stage G3 : 182.2 ± 92.4 pg / mL, CKD stage G4 : 265.4 ±
155.6 pg / mL, and CKD stage G5 : 660.6 ± 357.4 pg / mL. P-SEP levels were significantly higher in CKD stage G3 patients than in normal patients and became higher in patients with an ad-vanced GFR stage.
In contrast, in patients with CKD stages G1 and G2 for whom renal function was preserved, there was no significant difference in P-SEP levels between patients and the normal group. Evaluation of possible indices that correct for renal function
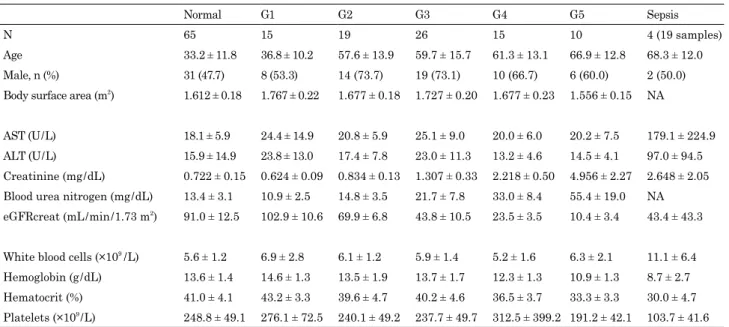
To establish a new index considering renal function, we at-tempted correction using creatinine or eGFR. The creatinine-cor-rected P-SEP / CRE ratio and eGFR-corcreatinine-cor-rected P-SEP / eGFR, which were corrected to creatinine : 1.0 mg / dL and eGFR : 100 mL / min / 1.73 m2, were calculated in the normal group to com-pare with uncorrected P-SEP levels. A P-SEP value of 96.4 ± 27.0 pg / mL corresponded to a coefficient of variation (C.V.) of 28.0%. A P-SEP / CRE ratio of 139.6 ± 49.7 had a C.V. of 35.6%. Finally, a P-SEP / eGFR value of 86.8 ± 23.4 had a C.V. of 27.0%. The P-SEP / CRE ratio was high, and the distribution width was large. In contrast, P-SEP / eGFR was almost the same as the uncorrected P-SEP levels, and the distribution width was small (Fig. 3).
Stratified comparison of P-SEP / CRE ratio
The stratified comparison of P-SEP / CRE ratio was performed for the normal group and CKD patients as classified by eGFR-creat. The following values were obtained : normal : 139.6 ± 49.7, CKD stage G1 : 172.41 ± 60.2, CKD stage G2 : 150.6 ± 55.4, CKD stage G3 : 136.9 ± 45.5, CKD stage G4 : 122.4 ± 66.6, and CKD stage G5 : 139.9 ± 63.0. On comparison of P-SEP / CRE ratio according to GFR stage, there was no increase in patients with advanced GFR stage, and no difference was observed between the normal group and CKD patients (Fig. 4).
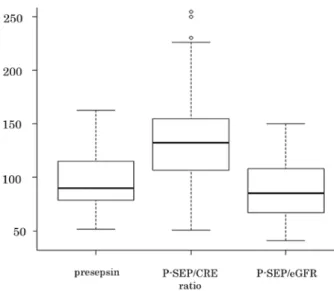
Stratified comparison of P-SEP / eGFR
The results of the stratified comparison of P-SEP / eGFR are now given. Normal was 86.8 ± 23.4, CKD stage G1 was 108.0 ± 34.8, CKD stage G2 was 87.0 ± 33.6, CKD stage G3 was 73.1 ± 22.9, CKD stage G4 was 60.9 ± 33.1, and finally CKD Fig 1. Influence of agitation on presepsin measurements. P value
calculated using the paired t test
Fig 2. Presepsin levels in the normal group and in patients with chronic kidney disease
The GFR stage is classified using eGFRcreat. P value calculated using
the Kruskal–Wallis one-way analysis of variance. P value adjustment
performed using the Bonferroni method
Fig 3. Evaluation of possible indices that correct for renal function. P-SEP / CRE ratio = presepsin / creatinine. P-SEP / eGFR = presepsin × eGFR / 100
stage G5 was 63.4 ± 32.3. There was a significant decrease in patients with an advanced GFR stage (Fig. 5).
Renal function-corrected indices in sepsis patients
P-SEP levels and two renal function-corrected indices were compared between sepsis patients and non-infected group, includ-ing normal group and the enrolled CKD patients. The followinclud-ing index values were obtained in the patients with sepsis : P-SEP, 4772.0 ± 3856.8 pg / mL ; P-SEP / CRE ratio, 1859.1 ± 655.2 ; and P-SEP / eGFR, 954.4 ± 389.4.
All indices were significantly higher in sepsis patients than
in non-infected group. Additionally, when the P-SEP / CRE ratio was used, the difference in the values between sepsis patients and non-infected group was greater (Fig. 6).
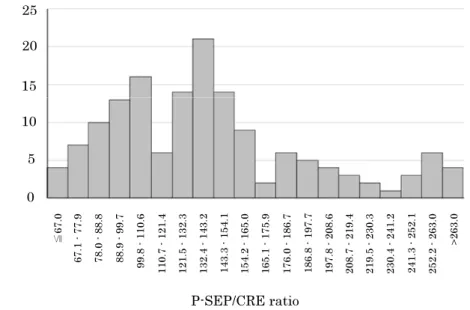
Calculation of a reference range for the P-SEP / CRE ratio
A total of 150 P-SEP / CRE ratio values derived from the non-infected group were used to determine the reference range of P-SEP / CRE ratio. The P-SEP / CRE ratio in the non-infected group ranged from 50.8 to 308.9. A value between the 2.5th per-centile and the 97.5th perper-centile was used as the reference range. The calculated reference range was 67–263 (Fig. S1).
Fig 4. Stratified comparison of P-SEP / CRE ratio. The GFR stage
is classified using eGFRcreat. P value calculated using the Kruskal–
Wallis one-way analysis of variance. P value adjustment performed
using the Bonferroni method
Fig 5. Stratified comparison of P-SEP / eGFR. The GFR stage is
classified using eGFRcreat. P value calculated using the Kruskal–
Wallis one-way analysis of variance. P value adjustment performed
using the Bonferroni method
Fig 6. The P-SEP / CRE ratio or P-SEP / eGFR in the non-infected group and sepsis patients. P value calculated using the Kruskal–Wallis
one-way analysis of variance. P value adjustment performed using the Bonferroni method
3000 2000 1000 0 Normal G1 G2 G3 G4 G5 n.s. p < 0.01 Sepsis 1500 1000 500 0 Normal G1 G2 G3 G4 G5 n.s. p < 0.01 Sepsis p < 0.01 P-SEP/CRE rati o P-SEP/ eG FR
DISCUSSION
P-SEP is useful as a rapid and specifically elevated marker of sepsis. However, it may show falsely high values because of renal function and agitation. None of the previous studies have considered the influence of sample agitation. In this study, we analyzed the effect of renal function on P-SEP measurement by minimizing the influences of agitation and transport. Moreover, the P-SEP / CRE and P-SEP / eGFR ratios were examined as possible indices that correct for renal function. Subsequently, it was found that the P-SEP / CRE ratio was more useful as a new renal function-corrected index. These ratios can facilitate the diagnoses of sepsis in patients with renal impairment.
In the stratified comparison using eGFRcreat in CKD pa-tients, P-SEP levels showed a significant increase in accordance with an increase in the GFR stage. P-SEP levels in patients with mild renal impairment up to CKD stage G2 were not signifi-cantly different from those in healthy volunteers. In contrast, in patients with CKD stage G3 or higher renal impairment, significantly higher P-SEP levels were observed. This was also true in non-infected cases. Sepsis diagnosis is not based on only one biomarker but is also a comprehensive diagnosis based on multiple markers and clinical symptoms. P-SEP levels must be carefully interpreted to diagnose sepsis in patients with renal impairment.
To correct the effect of renal function and improve the ability to diagnose sepsis in CKD patients at a high risk of infection, new indices, such as P-SEP / CRE ratio and P-SEP / eGFR, were evaluated. When the stratified comparison of P-SEP / CRE ratio was performed, high P-SEP levels due to renal impairment disappeared in all the CKD grades, and P-SEP levels showed equivalent levels. In contrast, in the stratified comparison of P-SEP / eGFR, the increasing trend of P-SEP levels due to renal impairment was absent. However, P-SEP / eGFR showed a de-creasing trend. The eGFR formula is not recommended to apply in a normal group owing to large errors (15). In patients with normal renal function, the eGFR correction can be inadequate.
The same evaluation was also performed using eGFR, consid-ering the body surface area of an individual. This resulted in a similar tendency as eGFR. Therefore, the superiority of using individual eGFR was not observed (data not shown).
Regarding P-SEP / Cys-C ratio, increasing trend was not ob-served with advanced GFR stage (Fig. S2). However, we could not find the advantage of P-SEP / Cys-C ratio over P-SEP / CRE ratio because Cys-C measurements were covered by health in-surance in Japan only for patients with renal impairment with a frequency of once every three months (19). Additionally, Cys-C is a sensitive indicator of early-stage renal failure, whereas it reaches a plateau in patients with end-stage renal failure ; there-fore, it does not accurately reflect renal function in end-stage renal disease.
Moreover, in sepsis patients, both the P-SEP / CRE ratio and P-SEP / eGFR indicated a remarkably high value in all samples, regardless of the presence or degree of renal impairment and sig-nificant differences from those in the non-infected group. There-fore, the diagnostic ability was maintained as well as it was at uncorrected P-SEP levels. The difference in P-SEP / CRE ratio between sepsis patients and the non-infected group was larger than that of P-SEP / eGFR, suggesting the P-SEP / CRE ratio is Fig S1. Distribution of P-SEP / CRE ratio. P-SEP / CRE ratio = presepsin / creatinine.
Fig S2. Stratified comparison of P-SEP / Cys-C ratio. The GFR stage
is classified using eGFRcreat. P value calculated using the Kruskal–
Wallis one-way analysis of variance. P value adjustment performed
more useful to diagnose sepsis. Nakamura et al., reported sepsis cases in CKD patients (20). They concluded that P-SEP level can be a reliable indicator of sepsis not only among non-acute kidney injury (AKI) patients but also patients with less severe forms of AKI. However, it may not be a reliable indicator of sepsis in patients with a more advanced form of AKI. We need more sepsis cases in CKD patients to validate the P-SEP / CRE ratio by han-dling the blood samples with an appropriate procedure.
Although the correction of renal function was possible using both indices, the P-SEP / CRE ratio was simpler, more applicable, and useful. Consequently, we calculated the reference standard range for the P-SEP / CRE ratio using data from non-infected groups, which was 67–263. The cutoff value for uncorrected P-SEP levels was less than 400–700 (mean : 500 pg / mL : Japan (21)), although the index was different ; the P-SEP / CRE ratio could be applied without changing the prevailing clinical criteria.
This study revealed that P-SEP levels were increased by increasing the number of inversions, even with gentle stirring. Further, it was confirmed that when an impact by an air shooter was applied, remarkably high values were observed. The cause of falsely high values is presumed to be a cross-reaction of the anti-P-SEP antibody with an unknown macromolecular complex formed by stimulation such as stirring ; however, the formation mechanism, reactivity with reagents, and other possible causes of false high values are still unknown. Since the measurement of P-SEP is directly linked to diagnosis and treatment, the fluc-tuation by blood sampling procedures or transport conditions is an issue that cannot be overlooked. Therefore, it is necessary to unify blood collection and transport procedures along with thoroughly disseminating information regarding this issue to doctors and nurses.
This study has some limitations. First, it is possible that en-rolled CKD patients had a hidden infectious disease because this diagnosis was based on physical assessment. Second, there was a difference in age between the normal group and CKD patients. Third, we performed blood tests on healthy volunteers, but we did not evaluate the other abnormalities, such as albuminuria, urine sediments, and structural abnormalities.
In conclusion, by excluding the influence of stirring during blood sampling, our study demonstrated that P-SEP levels in-crease as GFRs dein-crease. CKD for stage G1 and G2 groups can be evaluated in the same way as that for the normal group ; how-ever, in patients with CKD stage G3 or higher, even non-infected patients need to be evaluated carefully. The P-SEP / CRE ratio makes it possible to correct for renal function and is a useful and simple new index for sepsis diagnosis that could contribute to avoiding confusion and misjudgment in CKD medical care.
DECLARATION OF INTEREST
None
ACKNOWLEDGEMENTS
We would like to thank Naofumi Yoda for providing helpful insights. We would also like to thank Editage for English lan-guage editing.
FUNDING
This research did not receive any specific grant from funding agencies in the public, commercial, or not-for-profit sectors.
REFERENCES
1. Bone RC, Balk RA, Cerra FB, Dellinger RP, Fein AM, Knaus WA, Schein RM, Sibbald WJ : Definitions for sepsis and organ failure and guidelines for the use of innovative therapies in sepsis. The ACCP / SCCM Consensus Confer-ence Committee. American College of Chest Physicians / So-ciety of Critical Care Medicine. Chest 101 : 1644-1655, 1992 2. Levy MM, Fink MP, Marshall JC, Abraham E, Angus
D, Cook D, Cohen J, Opal SM, Vincent J-L, Ramsay G, International Sepsis Definitions Conference : 2001 SCCM / ESICM / ACCP / ATS / SIS International Sepsis Defi-nitions Conference. Intensive Care Med 29 : 530-538, 2003 3. Assicot M, Bohuon C, Gendrel D, Raymond J, Carsin H,
Guilbaud J : High serum procalcitonin concentrations in pa-tients with sepsis and infection. Lancet 341 : 515-518, 1993 4. Gilbert DN : Procalcitonin as a biomarker in respiratory
tract infection. Clin Infect Dis 52 : 346-350, 2011
5. Wacker C, Prkno A, Brunkhorst FM, Schlattmann P : Pro-calcitonin as a diagnostic marker for sepsis : a systematic review and meta-analysis. Lancet Infect Dis 13 : 426-435, 2013
6. Uzzan B, Cohen R, Nicolas P, Cucherat M, Perret G-Y : Procalcitonin as a diagnostic test for sepsis in critically ill adults and after surgery or trauma : a systematic review and meta-analysis. Crit Care Med 34 : 1996-2003, 2006 7. Castelli GP, Pognani C, Meisner M, Stuani A, Bellomi D,
Sgarbi L : Procalcitonin and C-reactive protein during sys-temic inflammatory response syndrome, sepsis and organ dysfunction. Crit Care 8 : R234-242, 2004
8. Dupuy AM, Philippart F, Péan Y, Lasocki S, Charles PE, Chalumeau M, Claessens Y-E, Quenot J-P, Guen CG, Ruiz S, Luyt C-E, Roche N, Stahl J-P, Bedos J-P, Pugin J, Gauzit R, Misset B, Brun-Buisson C, Maurice Rapin Institute Biomarkers Group : Role of biomarkers in the management of antibiotic therapy : an expert panel review : I- currently available biomarkers for clinical use in acute infections. Ann Intensive Care 3 : 22, 2013
9. Henriquez-Camacho C, Losa J : Biomarkers for sepsis. Biomed Res Int 2014 : 547818, 2014
10. Yaegashi Y, Shirakawa K, Sato N, Suzuki Y, Kojika M, Imai S, Takahashi G, Miyata M, Furusako S, Endo S : Eval-uation of a newly identified soluble CD14 subtype as a mark-er for sepsis. J Infect Chemothmark-er 11 : 234-238, 2005 11. Endo S, Suzuki Y, Takahashi G, Shozushima T, Ishikura
H, Murai A, Nishida T, Irie Y, Miura M, Iguchi H, Fukui Y, Tanaka K, Nojima T, Okamura Y : Presepsin as a powerful monitoring tool for the prognosis and treatment of sepsis : A multicenter prospective study. J Infect Chemother 20 : 30-34, 2014
12. Endo S, Suzuki Y, Takahashi G, Shozushima T, Ishikura H, Murai A, Nishida T, Irie Y, Miura M, Iguchi H, Fukui Y, Tanaka K, Nojima T, Okamura Y : Usefulness of presepsin in the diagnosis of septic in a multicenter prospective study. J Infect Chemother 18 : 891-897, 2012
13. Nagata T, Yasuda Y, Ando M, Abe T, Katsuno T, Kato S, Tsuboi N, Matsuo S, Maruyama S : Clinical impact of kid-ney function on presepsin levels. PLoS One 10 : e0129159, 2015
14. Miyoshi M, Inoue Y, Nishioka M, Ikegame A, Nakao T, Kishi S, Doi T, Nagai K : Clinical evaluation of presepsin considering renal function. PLoS One 14 : e0215791, 2019 15. Matsuo S, Imai E, Horio M, Yasuda Y, Tomita K, Nitta
K, Yamagata K, Tomino Y, Yokoyama H, Hishida A, Col-laborators developing the Japanese equation for estimated GFR : Revised equations for estimated GFR form serum
creatinine in Japan. Am J Kidney Dis 53 : 982-992, 2009 16. Eknoyan G, Lameire N, Eckardt K, Kasiske B, Wheeler D,
Levin A, Stevens PE, Bilous RW, Coresh J, De Francisco ALM, De Jong PE, Griffith KE, Hemmelgarn BR, Iseki K, Lamb EJ, Levey AS, Riella MC, Shlipak MG, Wang H, White CT, Winearls CG : KDIGO 2012 clinical practice guideline for the evaluation and management of chronic kidney disease. Kidney Int Supple 3 : 1-150, 2013
17. Boyd J : Defining, Establishing, and Verifying Reference Intervals in the Clinical Laboratory : Approved Guideline, Third Edition. CLSI document EP28-A3c, PA : Clinical and Laboratory Standards Institute, Wayne, 2008
18. Kanda Y : Investigation of the freely available easy-to-use software “EZR” for medical statistics. Bone Marrow Trans-plant 48 : 452-458, 2013
19. Horio M, Imai E, Yasuda Y, Watanabe T, Matsuo S : Performance of serum cystatin C versus serum creati-nine as a marker of glomerular filtration rate as measured by inulin renal clearance. Clin Exp Nephrol 15 : 868-876, 2011
20. Nakamura Y, Ishikura H, Nishida T, Kawano Y, Yuge R, Ichiki R, Murai A : Usefulness of presepsin in the diagnosis of sepsis in patients with or without acute kidney injury. BMC Anesthesiol 14 : 88, 2014
21. Wu CC, Lan HM, Han ST, Chaou CH, Yeh CF, Liu SH, Li C-H, Blaney 3rd GN, Liu Z-Y, Chen K-F : Comparison of diagnostic accuracy in sepsis between presepsin, procal-citonin, and C-reactive protein : a systematic review and meta-analysis. Ann Intensive Care 7 : 91, 2017