Geochemical Journal, Vol. 54, pp. 351 to 363, 2020 doi:10.2343/geochemj.2.0606
*Corresponding author (e-mail: [email protected]) Copyright © 2020 by The Geochemical Society of Japan.
tio of organic carbon to sulfur (Corg/S) and estimated the change in properties of surface water using diatom fossil assemblages. After these early studies, palaeoceanographic studies of the Japan Sea were per-formed using sediment fabrics (Khim et al., 2009; Watanabe et al., 2007), radiolarians in sediment (Itaki et
al., 2003, 2004), and metal concentrations (Lim et al.,
2011; Minoura et al., 2012). The concentration of mo-lybdenum (Mo) in the sediments has also been studied extensively to constrain the redox conditions in bottom water (Crusius et al., 1996, 1999; Khim et al., 2012; Xu
et al., 2014; Zou et al., 2012).
Molybdenum is a redox-sensitive element and has seven stable isotopes (92Mo, 94Mo, 95Mo, 96Mo, 97Mo, 98Mo, and 100Mo). In the modern ocean, Mo exists as an oxoacid anion of MoO42− and is distributed homogene-ously (Mo = 107 ± 7 nmol kg−1 and δ98Mo = 2.34 ± 0.10‰, ave ± sd; (Nakagawa et al., 2012) with a long residence time of 740,000 y (Firdaus et al., 2008). The primary sink of Mo in the oxic ocean is the adsorption onto Mn and Fe (oxyhydr)oxides, and lighter isotopes of Mo are prefer-entially adsorbed, thereby resulting in isotopic fractionation (Barling et al., 2001; Goldberg et al., 2009). In sulfidic seawater, Mo forms particle-reactive
Constraints on redox conditions in the Japan Sea in the last 47,000 years
based on Mo and W as palaeoceanographic proxies
MAKOTO TSUJISAKA,1* SHINSUKE NISHIDA,1 SHOTARO TAKANO,1 MASAFUMI MURAYAMA2 and YOSHIKI SOHRIN1 1Institute for Chemical Research, Kyoto University, Gokasho, Uji, Kyoto 611-0011, Japan
2Center for Advanced Marine Core Research, Kochi University, B200 Monobe, Nankoku, Kochi 783-8502, Japan
(Received November 21, 2019; Accepted June 30, 2020)
Both molybdenum (Mo) and tungsten (W) form soluble oxyanions in oxic seawater, whereas Mo forms insoluble thiomolybdate and W forms soluble thiotungstate in sulfidic seawater. Thus, concentrations and stable isotope ratios of Mo and W in sediments may fluctuate due to changes in redox conditions and can be used to estimate paleoenvironmental changes. The modern Japan Sea is oxic from the surface to the bottom, whereas deep water became anoxic several times from the late Pleistocene to the Holocene. Detailed information on redox conditions is still lacking. In this study, we analyzed a sediment core that was collected from offshore Iwanai, Hokkaido (43°22′36″ N, 140°04′10″ E, water depth 900 m). To the best of our knowledge, our study is the first to report stable isotope data of Mo and W in sediments of the Japan Sea. We observed maxima in the Mo concentration of up to 29 ppm in the sediment layers of 11–10 ka, 17–14 ka (the last glacial maximum), 31 ka, and 45 ka in accordance with the maxima of total sulfur, thereby indicating the deposi-tion of thiomolybdate MoOxS4−x2− (0 ≤ x ≤ 3). δ98Mo, however, was between –0.19 and 0.69‰ at these ages, suggesting
that the H2S concentration in bottom water never exceeded 11 µmol kg−1. The concentration and isotopic ratio of W were
relatively constant throughout the core; W = 1.2 ± 0.2 ppm and δ186W = 0.03 ± 0.03‰ (ave ± sd). The authigenic Mo and
W ratio, Moauth/Wauth (mol/mol), was 10.5 ± 7.3 except for the above four ages, supporting the control of Mn and Fe (oxyhydr)oxides on Moauth and Wauth under oxic conditions.
Keywords: molybdenum, tungsten, stable isotopes, Japan Sea, paleoceanography
INTRODUCTION
The modern Japan Sea is a semi-closed environment surrounded by shallow straits. The Japan Sea sediments are composed of alternating layers of dark and light colored clay that reflect Dansgaard-Oeschger cycles (Tada, 1995; Tada et al., 1999). The formation of the dark layers is attributed to the increase in productivity in sur-face waters and the decrease in the oxygen content in sediments, which were affected by changes in sea levels and/or the East Asian monsoon (Oba et al., 1991, 1995; Tada et al., 1999). These environmental changes have been investigated through various proxies. Oba et al. (1991) and Oba et al. (1995) estimated the paleoenvironmental history of the Japan Sea caused by sea level changes over the last 85 ka by using proxies such as isotope ratios of oxygen and carbon as well as microfossil assemblages. Tada et al. (1999) estimated the change in redox conditions of bottom water using the
ra-thiomolybdate anions of MoOxS4−x2− (0 ≤ x ≤ 3) via reac-tion with H2S (Helz et al., 1996). When the H2S concen-tration becomes higher than 11 µmol kg−1, most of Mo in seawater is transformed into thiomolybdate anions and fixed with organic matter and/or iron sulfides in sediments (Erickson and Helz, 2000). As a result, euxinic sediments and sulfide minerals have δ98Mo values of 1.5–2.3‰, which are close to those of seawater (Dahl et al., 2010; Neubert et al., 2008; Poulson-Brucker et al., 2009; Scott and Lyons, 2012). Thus, the concentrations and isotope ratios of Mo in sediments have been widely utilized as a redox proxy in paleoceanography (Calvert and Pedersen, 1993; Crusius et al., 1996, 1999; Dahl and Wirth, 2017; Kendall et al., 2011; Kurzweil et al., 2016; Ostrander et
al., 2019; Thoby et al., 2019; Wille et al., 2008).
Like Mo, tungsten (W) belongs to Group 6 in the pe-riodic table and has five stable isotopes (180W, 182W, 183W, 184W, and 186W). In the modern ocean, W exists as the oxoacid anion WO42− and is uniformly distributed with a concentration of 49 pmol kg−1 and an oceanic residence time of 14,000 y (Firdaus et al., 2008; Sohrin et al., 1987). In the East China Sea and the Yellow Sea, we found that W is released from continental shelf sediments when manganese reduction occurs, whereas Mo behaves con-servatively (Sohrin et al., 1999). Hence, we expected that the Mo/W concentration ratio in sediments would be a proxy for redox conditions due to the different behaviors of these elements. Unlike Mo, W is transformed into thiotungstate anions of WOxS4−x2− (0 ≤ x ≤ 3) only when the H2S concentration increases above 60 µmol kg−1 and the thiotungstate is not particle-reactive (Mohajerin et al., 2014, 2016). The partition coefficient of Mo between sediments and porewater increases with the H2S concen-tration, but that of W is not affected by the H2S concen-tration in a sediment core collected from the Izena Hole, where hydrothermal activities were observed (Watanabe
et al., 2017). Dissimilar behaviors of W and Mo have also
observed in the Bothnian Bay during freshwater trans-port and estuarine mixing (Bauer et al., 2018) and in hy-poxic-euxinic marine basins in the Black Sea and the Baltic Sea (Dellwig et al., 2019). Moreover, we have found that the concentration of W becomes extremely high (0.12–127 nmol kg−1) in submarine hydrothermal fluids (Kishida et al., 2004) and in the coastal seawater off large cites (Sohrin et al., 1999). Recent studies revealed that δ186W varies in geological materials: e.g., 0–0.08‰ for igneous rocks, 0–0.15‰ for manganese nodules, and 0– 0.25‰ for marine sediments (Irisawa and Hirata, 2006; Krabbe et al., 2017; Kurzweil et al., 2018, 2019; Tsujisaka
et al., 2019). Hence, we expect that the concentration and
isotopic composition of W would be a new proxy for as-sessing the contributions from lithogenic, hydrothermal, and anthropogenic sources.
For these reasons, the concentrations and isotope
ra-tios of Mo and W in sediment cores will enable us to con-strain the paleoceanographic conditions more precisely. However, there have been no reports of paleoceanographic study using all the concentrations and isotope ratios of Mo and W. Furthermore, there have been no reports of Mo isotope ratios, W concentrations, and W isotope ra-tios in the Japan Sea sediment core so far. In this study, we analyzed the sediment core IWANAI No. 3 collected from an intermediate depth of the northern Japan Sea off Iwanai, Hokkaido (43°22′36″ N, 140°04′10″ E, water depth 900 m). We report the concentration and isotopic composition of Mo and W along with the concentrations of major elements, including Al, Fe, Ca, C, S, Ti, and N, and trace elements such as Mn, P, Cr, Co, Ni, Cu, Zn, Cd, Sb, Ba, Tl, Bi, and U. We estimate environmental changes in the Japan Sea in the last 47,000 years and evaluate the possibility of Mo and W as new proxies for paleoceanography.
MATERIALSAND METHODS
Site description
The modern Japan Sea is a semi-closed marginal sea with an area of approximately 1,000,000 km2 and an av-erage water depth of approximately 1,650 m (Menard and Smith, 1966), and it is surrounded by four shallow straits (Tsushima Strait, sill depth 130 m; Tsugaru Strait, 130 m; Soya Strait, 55 m; and Mamiya Strait, 18 m). Seawater from the open ocean flows into the Japan Sea mainly via the warm and high-salinity Tsushima Warm Current (TWC), which is a branch of the Kuroshio Current. Most of the TWC water flows out from the Tsugaru Strait to the Pacific Ocean as the Tsugaru Warm Current. The re-maining water flows out from the Soya Strait to the Sea of Okhotsk as the Soya Warm Current (Toba, 1982). The Liman Current (LC), which originates from cold surface water in the Sea of Okhotsk and flows through the Mamiya Strait into the northern part of the Japan Sea. The Japan Sea Proper Water (JSPW) occurs below a water depth of 300–500 m and has an almost uniform temperature and salinity (Sudo, 1986). The JSPW is formed in the north-western part of the Japan Sea by the subduction of high-density seawater due to strong cooling of the LC water in winter (Senjyu and Sudo, 1994; Sudo, 1986). Because the subduction supplies oxygen to the deeper layers of JSPW, the modern Japan Sea is oxic down to its bottom (Gamo
et al., 1986). Sediment core
The sediment core IWANAI No. 3 was collected off-shore of Iwanai, Hokkaido (43°22′36″ N, 140°04′10″ E, water depth 900 m) in November 1998 during a cruise of the Koyo-Maru that was operated by the Nippon Salvage Co. Ltd. The sampling point and the lithology of the
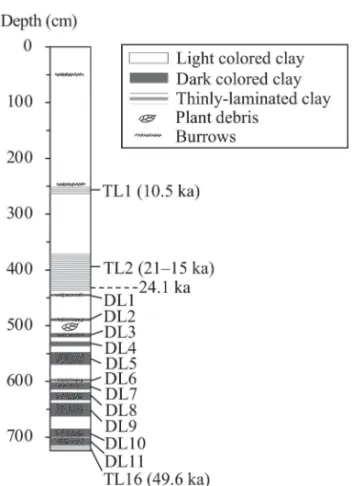
IWANAI No. 3 core are shown in Figs. 1 and 2, respec-tively. The IWANAI No. 3 core consists of light colored clay, dark colored clay, and thinly-laminated clay as pre-viously observed for cores in the literature (Ikehara and Itaki, 2007; Nakajima et al., 1996; Oba et al., 1991). Dark colored clay layers (DL) are numbered sequentially from the top of the core. The upper two and bottom thinly-laminated clay layers (TL) correspond to TL1, TL2, and TL16 in the literature (Oba et al., 1991; Tada et al., 1999). Burrows of slight bioturbation are observed in a layer at a 50 cm depth from the top, and burrows of moderate bioturbation are observed in layers at 242 cm and 370 cm depths and in all DLs. In addition, all DLs are rich in foraminifera. TL1 is rich in foraminifera but bioturbation is absent. Radiocarbon dating indicates that the bottom of TL2 (428 cm) and the bottom of TL16 (725 cm) were deposited at 20.53 ± 0.12 ka [24,266 to 23,930 cal BP (1σ)] and 46.5 ± 0.4 ka [(49,970 to 49,157 cal BP (1σ)] as 14C ages, respectively. Monospecies planktonic foraminifera (Globigerina bulloides) were handpicked, and dated by accelerator mass spectrometry at the Chris-tian-Albrechts University, Kiel, Germany. The 14C ages were calibrated to calendar ages using OxCal (Bronk Ramsey, 2009). The local effect of the marine reservoir (∆R) was set at +95 ± 60 yr, in the northern Japan Sea (Kuzmin et al., 2007).
Based on a stratigraphic comparison with other sedi-ment cores from the Japan Sea, we estimated that TL1 (254–257 cm) was deposited at 10.5 ka and TL2 (373– 428 cm) was deposited during the Last Glacial Maximum (LGM) (15–21 ka) (Ikehara, 2003; Oba et al., 1995). The deposition ages of the other layers were estimated by
in-terpolation.
Ninety-nine subsamples were collected from differ-ent layers of the IWANAI No. 3 core using a Neoflon spoon. The subsamples were stored in polyethylene bags (Unipack E-4, Seisannipponsha, Japan), dried at 80°C for 24 h, crushed using a mallet, and kept in a desiccator.
Measurement of C, N, and S
Concentrations of total carbon (Ctot), organic carbon (Corg), total nitrogen (Ntot), and total sulfur (Stot) in bulk sediment samples were determined using a FlashEA 1112 Analyzer (Thermo Fisher Scientific, USA) at the Center for Advanced Marine Core Research, Kochi University. For the measurement of Ctot, Ntot, and Stot, a dried sedi-ment sample (~5 mg) was directly introduced to the in-strument and analyzed. For the measurement of Corg, a dried sediment sample (~0.5 g) was added with 50 mL of 1.3 mol kg−1 HCl and heated at 80°C for 12 h to remove carbonates. Then, the acid-treated residues were rinsed with distilled water and dried. A portion of this sample (~0.5 mg) was used to determine Corg. The concentration of inorganic carbon (Cinorg) was obtained by subtracting Corg from Ctot. In measurements of C, N, and S, the error of analyses was less than 2% as the relative standard de-viation (RSD) for a standard material (C: 42%, N: 16%, and S: 19%). The Corg values were significantly higher Fig. 1. Location of the sampling point of the IWANAI No. 3
core.
Fig. 2. Lithology of the IWANAI No. 3 core. The dark layers are numbered sequentially from the top of the core. The upper two and bottom laminated clay layers correspond to TL1, TL2, and TL16 in the literature.
than Ctot in several samples. The abnormal Corg values were removed from discussion because the contamina-tion of C was suspected during the acid treatment.
Measurement of metal concentrations
We used a microwave decomposition system (Speed Wave MWS-3+, Analytik Jena) for digestion of sediments. A dried sediment sample (~100 mg) was weighed and placed in a digestion vessel named DAP 100. Two mL of H2O2 (30 wt%), 4 mL HNO3 (60 wt%), 6 mL HCl (36 wt%), and 1 mL HF (46 wt%) were added to the diges-tion vessel, and the mixture was heated stepwise to 180°C for 1 h. The solution was evaporated to dryness and the solid residues were re-dissolved with 40 mL of 1 mol kg−1 HNO
3. Concentrations of major elements (Al, P, Ca, Ti, Mn, Fe, and Ba) were determined using an ICP-AES Optima 2000DV (Perkin Elmer, USA) after diluting the sample solution 25 times with 1 mol kg−1 HNO
3. Trace elements (V, Cr, Ni, Co, Cu, and Zn) in the undiluted sam-ple solution were determined by ICP-AES. Other trace metals (Mo, Cd, Sb, W, and U) were determined using a Q-ICP-MS ELAN DRC II (Perkin Elmer) after diluting the sample solution 10 times. The Optima 2000DV and ELAN DRC II were equipment at the Institute for Chemi-cal Research, Kyoto University. RSD for analysis of the standard material of sediments (NSC DC 74301) was be-low 1% for major elements and bebe-low 3% for trace ele-ments, respectively.
Measurement of the isotope ratios of Mo and W
The analytical method reported in Tsujisaka et al. (2019) was used for the measurement of the isotope ra-tios of Mo and W. An aliquot of a sample (~100 mg) was decomposed using a microwave decomposition system (Speed Wave MWS-3+). Then, we used two types of col-umns loaded with NOBIAS Chelate PA-1 resin (Hitachi High-Technologies, Japan) or AG1-X8 anion exchange resin (Bio Rad, USA) to separate Mo and W from each other and from matrix elements in the marine sediments. The resulting solutions were 0.15 mol kg−1 HNO
3 for Mo and 5.5 mmol kg−1 tetramethylammonium hydroxide (TMAH) for W. The isotopic composition and concentra-tion of Mo or W in each soluconcentra-tion were measured using a Neptune Plus MC-ICP-MS (Thermo Fisher Scientific, USA) at the Research Institute for Human and Nature (RIHN). The instrumental mass bias was corrected by standard-sample bracketing, combined with external cor-rection using Ru for Mo and Re for W. The isotope ratios of Mo and W are presented as the delta value of δ98Mo relative to the NIST SRM 3134 standard (Goldberg et al., 2013; Greber et al., 2012; Nägler et al., 2014) and δ186W (‰) relative to the NIST SRM 3163 standard (Irisawa and Hirata, 2006), respectively:
δ98 98 95 98 95 1 1000 0 25 1 Mo Mo Mo Mo Mo sample NIST SRM 3134 =
(
)
(
)
− × + .( )
δ186 186 184 186 184 1 1000 2 W W W W W sample NIST SRM 3163 =(
)
(
)
− × .( )
δ98Mo of the NIST SRM 3134 standard is defined as +0.25‰, in accordance with Nägler et al. (2014), for a convenient comparison with the literature. The external reproducibility in the 95% confidence interval was 0.02– 0.08‰ for δ98Mo and 0.02–0.09‰ for δ186W for stand-ard materials of sediments (NSC DC 74301, 1, JMS-2, CRM 7302-a, and HISS-1) (Tsujisaka et al., 2019).
RESULTSAND DISCUSSION Depth profiles of elements
The Ctot concentration varied from 0.64% to 3.82%, the Corg concentration varied from 0.17% to 2.74%, and the Cinorg concentration varied from 0% to 2.40% (Sup-plementary Fig. S1). Ctot showed peaks at TL1, just above and top of TL2, and at DLs below 530 cm. The depth profile of Corg was mostly similar to that of Ctot but showed no peak at the top of TL2. Corg was strongly correlated with Ntot (r = 0.91) (Supplementary Table S2). These re-sults can be ascribed to enhanced primary productivity in surface waters when these layers were formed. In con-trast, substantial peaks of Cinorg and Ca occurred only at TL1, just above TL2, at the top of TL2, and at DL11. These peaks imply an enhanced deposition of carbonates in the period when these layers were formed.
The concentration of Al varied from 5.32% to 8.60% (Fig. S1). A significant decrease in Al appeared at TL1, just above TL2, and at TL16, implying the dilution of aluminosilicate minerals with carbonates. Aluminum showed strong correlations with Ti (r = 0.95), Co (r = 0.83), and W (r = 0.87) (Table S2).
The concentration of Stot varied from 0.21% to 2.45% and showed sharp peaks at TL1, just above TL2, at the top of TL2, at DL5, and at DL11 (Fig. S1). Stot shows the highest correlation with Ca (r = 0.50) and Mo (r = 0.50) (Table S2). The concentration of Mo varied from 1.0 ppm to 29.4 ppm, and peaks at TL1, TL2, DL5, and DL11 oc-curred concurrently with Stot. These results suggested the formation of thiomolybdate caused by the occurrence of H2S in bottom water and/or in pore water of the sediments (Helz et al., 1996, 2004). The duration time of the sulfidic conditions was less than 500 y at DL5 and DL11, whereas it lasted 1100 y at TL1 and 3100 y at TL2. The Fe/Al (g/ g) ratio also peaked together with Stot and Mo
(Supple-mentary Fig. S3), thereby suggesting the deposition of iron sulfide. The peaks of the Mn/Al ratio occurred just above TL2, at the top of TL2, and at DL11 concurrently with those of Cinorg and Ca (Fig. S3), suggesting the depo-sition of manganese carbonate. The concentration of V varied from 57 ppm to 163 ppm and peaked at TL1 and several DLs (Supplementary Fig. S2). The concentration of U varied from 2.0 ppm to 14.7 ppm and peaked at TL1 and TL16 (Fig. S2). Previous studies have reported that V and U are redox-sensitive and removed from anoxic seawater in the absence of H2S (Klinkhammer and Palmer, 1991; Morford and Emerson, 1999; Tribovillard et al., 2006; Wanty and Goldhaber, 1992). The correlation be-tween V and U was high (r = 0.61), although the correla-tions between V and Mo (r = 0.19) and between U and Mo (r = 0.35) were low (Table S2).
The depth profile of W was fairly uniform and in a range of 0.71–1.75 ppm. The baseline value of the W/Al profile was ~1.7 × 10⁻⁵ between 10 ka and the present
(Fig. S3), which was significantly higher than the W/Al ratio of 1.2 × 10⁻⁵ in the crust (Rudnick and Gao, 2003); this suggested the authigenic removal of W from seawater by adsorption on Mn and Fe (oxyhydr)oxides. The W/Al ratio decreased at a 2.30 m depth, at the top of TL2, and in DL11 (Fig. S3). The decreases at TL2 and at DL11 were likely caused by the disappearance of Mn and Fe (oxyhydr)oxides in the euxinic sediments. An increase in W concentration in sulfidic waters has been observed in estuarine environments (Mohajerin et al., 2016).
Quantitative analysis of variations in Mo and W concen-trations
In this study, we assume that the concentration of an element in sediments (Msed, ppm) is the sum of its contri-bution from lithogenic origin (Mlith) and authigenic ori-gin (Mauth) sources (Siebert et al., 2006):
Msed = Mlith + Mauth. (3) Fig. 3. Depth profiles of Mo, W, Moauth, and Wauth concentrations, the Moauth/Wauth (mol/mol) ratio, and isotopic compositions of Mo and W in the IWANAI No. 3 core. For δ98Mo and δ186W, the error bars show twice the internal standard error (±2SE) during each measurement. The light gray stripes and the dark gray bars indicate TLs and DLs, respectively. The black, gray, and white circles are data of Mo, Moauth, and δ98Mo, respectively. The black, gray, and white triangles are data of W, W
auth, and δ186W,
Mlith and Mauth can be estimated by the following equa-tions:
Mlith = Alsed × (M/Al)crust (4) Mauth = Msed – Alsed × (M/Al)crust (5) where Alsed (ppm) is the measured concentration of Al in the sediments and (M/Al)crust (g/g) is the ratio of the el-emental M and Al in the crust. The ratio is 9.5 × 10⁻⁶ for Mo/Al and 1.2 × 10⁻⁵ for W/Al (Rudnick and Gao, 2003). The vertical profiles of Moauth and Wauth are presented in Fig. 3. The Moauth, Wauth, and M/Al ratios are listed in Supplementary Table S3. A previous study reported that the deep water of the Japan Sea became oxic by the for-mation of JSPW since 10 ka (Oba et al., 1991). The re-sults in the previous section also support the notion that the sediments of the IWANAI No. 3 core were deposited under oxic conditions since 10 ka. Moauth and Wauth showed a constant baseline value during this period; Moauth was 1.47 ± 0.92 ppm and Wauth was 0.27 ± 0.07 ppm. Although the baseline value of Moauth is almost con-stant throughout the core, Moauth increases up to 28.6 ppm at TL1, TL2, DL5, and DL11 (Fig. 3). In contrast, Wauth varied in a small range (0–0.64 ppm). Positive peaks of Wauth occurred just above TL1 and at DL2. Negative peaks of Wauth occurred at a 230 cm depth, at the top of TL2, and in DL11. In addition, the average values for Wauth shifted from 0.38 ± 0.09 ppm to the contemporary value of 0.24 ± 0.08 ppm after the LGM just above TL2 (Fig. 3).
Under oxic conditions, a major sink of Mo and W is the adsorption on Mn and Fe (oxyhydr)oxides (Barling et
al., 2001; Goldberg et al., 2009; Kashiwabara et al., 2013;
Shimmield and Price, 1986). Assuming the system is at equilibrium, the adsorption of a metal on Mn and Fe (oxyhydr)oxides from seawater can be evaluated by the distribution coefficient (D):
D(M) = [M]ox/[M]sw, (6)
where [M]ox (mol kg−1) is the concentration of a metal adsorbed on Mn and Fe (oxyhydr)oxides and [M]sw (mol kg−1) is the concentration of the metal in seawater; [Mo]
sw = 107 nmol kg−1 and [W]
sw = 49 pmol kg−1 (Firdaus et
al., 2008; Nakagawa et al., 2012; Sohrin et al., 1987).
The literature indicates that D(W) is substantially higher than D(Mo). D(Mo) is 5.0 × 10⁴ and D(W) is 3.5 × 10⁶ for δ-MnO2 in laboratory experiments (Sohrin et al., 1999), D(Mo) is 2.8 × 10³ and D(W) is 1.8 × 10⁵ for Fe(OH)3 in laboratory experiments (Ishibashi et al., 1960; Sohrin et al., 1987), and D(Mo) is 5.0 × 10⁴ and D(W) is 1.1 × 10⁷ for ferromanganese crusts on seamounts (Takematsu et al., 1990). Using Eq. (6), the [Mo]ox/[W]ox
(mol/mol) ratio was calculated as 31 for δ-MnO2, 34 for Fe(OH)3, and 10 for ferromanganese crusts. The depth profile of Moauth/Wauth (mol/mol) is shown in Fig. 3 and Table S3. The baseline of Moauth/Wauth was 10.5 ± 7.3, which is in the range of the [Mo]ox/[W]ox ratios calcu-lated above, thereby supporting the control of Mn and Fe (oxyhydr)oxides on Moauth and Wauth under oxic condi-tions.
At TL1, TL2, and DL5, the Moauth/Wauth ratio greatly exceeded [Mo]ox/[W]ox. Stot showed a similar vertical pro-file as compared to the Moauth/Wauth ratio (Fig. 3); the background value of Stot was 0.46 ± 0.16% and its peak values reached 2.5%. We define excess-Stot as Stot minus the baseline Stot. At TL1, TL2, DL5, and DL11, the Moauth/ excess-Stot (mol/mol) ratio ranged from 5.5 × 10⁻³ to 3.0 × 10⁻² (Table S3). In a euxinic solution, Mo reacts with H2S to form a reactive thiomolybdate anion, which is ef-fectively removed from the solution (Emerson and Huested, 1991; Helz et al., 1996, 2004). According to a study in the Black Sea water column (Erickson and Helz, 2000), the action point of switch (APS) occurred at a H2S concentration of ~11 µmol kg−1. In a study of pore water in the Santa Barbara Basin sediments, the first critical concentration of H2S was ~0.1 µmol kg−1, at which authigenic Mo formation likely occurred because of co-precipitation as a Mo-S-Fe phase (Zheng et al., 2000). In contrast, W requires a much higher H2S concentration (~60 µmol kg−1) for the formation of thiotungstate, which is highly soluble in a sulfidic solution (Mohajerin et al., 2016). Thus, Mo is preferentially removed from a weakly euxinic solution, resulting in the high Moauth/Wauth ratio observed in the current study. In previous studies, only the Mo concentration was investigated. In this study, by using the Mo/W ratio, we quantitatively detected the suc-cession of hosts of Mo and W from Mn and Fe (oxyhydr)oxides to sulfides.
Behavior of δ98Mo and δ186W
The vertical profile of δ98Mo in the sediment core (δ98Mo
sed) is shown in Fig. 3. δ98Mosed varied from –0.19‰ to 0.75‰ and did not correlate with the concen-tration of Mosed (r = 0.21, Table S2). We argue that there are two important findings from these patterns. First, the peaks of δ98Mo
sed did not correspond to those of Moauth (at TL1, TL2, DL5, and DL11, Fig. 3). In addition, δ98Mo
sed did not show strong correlations with any pa-rameters (Table S2). When the H2S concentration in the bottom water exceeds 11 µmol kg−1, Mo is completely removed from seawater and accumulates in sediments, and δ98Mo
sed approaches the isotopic value of seawater δ98Mo
sw = 2.34‰ (Nägler et al., 2014). It is thus unlikely that the bottom water at this site experienced such a high H2S concentration since 47 ka. Second, although δ98Mo
sed was at an almost constant value of 0.09 ± 0.06‰ since 10
ka, δ98Mosed varied from –0.19‰ to 0.75‰ during 47–10 ka.
Molybdenum deposited in sediments under oxic con-ditions is a mixture of Mo in lithogenic debris and Mo from seawater adsorbed on Mn and Fe (oxyhydr)oxides. δ98Mo in crustal rocks ranges from –0.3‰ to 1.0‰ (Burkhardt et al., 2014; Hin et al., 2013; Li et al., 2014; Tsujisaka et al., 2019; Willbold et al., 2016; Zhao et al., 2016). Based on laboratory experiments, the adsorption of Mo from seawater onto Mn and Fe (oxyhydr)oxides under oxic conditions causes isotopic fractionation, re-sulting in a positive ∆98Mosw-ox = δ98Mosw – δ98Moox; in previous studies, this value was 2.4–2.9‰ for the tion on manganese oxide and 1.0–1.3‰ for the adsorp-tion on ferrihydrite (Barling and Anbar, 2004; Goldberg
et al., 2009; Kashiwabara et al., 2011, 2017; Wasylenki et al., 2011). The observed δ98Mo in ferromanganese ox-ides ranges from –1.0‰ to –0.3‰ (Barling et al., 2001; Goto et al., 2015; Siebert et al., 2003; Tsujisaka et al., 2019; Zhao et al., 2016), and δ98Mo in oxic marine sediments ranges from –0.5‰ to 0.9‰ (Li et al., 2014; Tsujisaka et al., 2019; Zhao et al., 2016). δ98Mosed in the IWANAI No. 3 core since 10 ka is consistent with these data, further supporting the presence of oxic conditions
during this period.
An isotopic offset between δ98Mosw and δ98Mosed has been reported in sediments of weakly restricted or inter-mittently euxinic basins. For example, δ98Mosed was 0.4– 0.6‰ in the Gotland Deep in the Baltic Sea (Nägler et
al., 2011). A similar δ98Mosed was observed in sediments above a bottom depth of 500 m in the Black Sea (Nägler
et al., 2011). Two likely mechanisms for this offset have
been reported in the literature (Scholz et al., 2013). One mechanism refers to the incomplete scavenging of inter-mediate thiomolybdate species (i.e., MoO3S2–, MoO2S22–, and MoOS32–) when the concentration of H2S is less than 11 µmol kg−1 (Neubert et al., 2008). These intermediate thiomolybdate species deflect δ98Mosed to-wards a lighter isotopic value from δ98Mosw (Kerl et al., 2017). In addition, short seawater residence times limit the reaction between Mo and H2S, resulting in the forma-tion of intermediate thiomolybdate species and an increase in the isotopic offset between δ98Mosw and δ98Mosed (Dahl
et al., 2010). Another mechanism is based on a Mn and
Fe “shuttle” for Mo (Scholz et al., 2013). At the interface between anoxic and oxic waters in the water column, Mn and Fe (oxyhydr)oxides are actively formed and scavenge lighter Mo isotopes preferentially from seawater, which Fig. 4. A) Plots of δ98Mo against the reciprocal of Mo concentration. The blue circles indicate the data of the IWANAI No. 3 core
since 10 ka, the orange circles indicate the data during the period between 47 and 10 ka, and the red circles indicate the data at TL1, TL2, DL5, and DL11. The red and orange triangles are data of the Black Sea sediments with H2S > 11 µmol kg−1 and H
2S <
11 µmol kg−1, respectively. The gray diamonds are data of suboxic-anoxic sediments with O
2 < 10 µmol kg−1 and without H2S.
Blue crosses, green squares, and purple circles are data of oxic sediments, igneous rocks, and manganese nodules and manganese crusts, respectively. B) The plots of δ186W against the reciprocal of W concentration. Blue circles indicate the data in the IWANAI
No. 3 core. Blue crosses, green squares, and purple circles indicate data of oxic sediments, igneous rocks, and manganese nod-ules and manganese crusts, respectively.
are then carried to the sediments. During early diageneses, Mn and Fe (oxyhydr)oxides are reduced and re-dissolved, but a portion of Mo is transformed into thiomolybdates and eventually buried in association with metal sulfides and/or organic matter. We could not determine the most probable offset mechanism based on this study’s data. We also could not explain the detailed mechanism of the vari-ations in δ98Mo
sed between 47 and 10 ka, although they may suggest that the redox conditions substantially changed in the bottom water and/or in pore water.
Figure 4A shows the isotope ratio of Mo plotted against the reciprocal of the Mo concentration in the IWANAI No. 3 core in comparison with values from a wide variety of geological samples in the literature (Nägler et al., 2005; Neubert et al., 2008; Poulson-Brucker et al., 2009; Scholz et al., 2017; Siebert et al., 2003, 2006; Tsujisaka et al., 2019; Zhao et al., 2016). The values in the last 10 ka in the IWANAI No. 3 core were in the range of the values for igneous rocks and oxic sediments. The values during the period between 47 and 10 ka in the IWANAI No. 3 core plotted within the inter-mediate area between igneous rocks and suboxic-anoxic sediments. The values of TL1, TL2, DL5, and DL11 shifted to the area of euxinic sediments under the bottom water, with H2S < 11 µmol kg−1. These results support the validity of our data.
The vertical profile of δ186W
sed is shown in Fig. 3. δ186W
sed was almost constant throughout the IWANAI No. 3 core (–0.03~0.12‰), suggesting that there was no sub-stantial change in the nature of source and sink of W. δ186W
sed in the IWANAI No. 3 core is in a range of δ186W reported for geological materials (–0.05~0.25‰) (Irisawa and Hirata, 2006; Krabbe et al., 2017; Kurzweil et al.,
2018, 2019; Tsujisaka et al., 2019). Takahashi et al. (2007) and Bodeï et al. (2007) suggested that the Mn/Fe ratio in marine sediments can be a proxy to distinguish hydrogenetic, diagenetic, and hydrothermal origins. The Mn/Fe ratio in the IWANAI No. 3 core was fairly con-stant, ranging from 0.73 × 10⁻² – 1.97 × 10⁻² (Table S3); this was consistent with the results of W. Previous stud-ies have reported that strong anoxic conditions developed during the period between 27 and 20 ka (Oba et al., 1991, 1995). Although fractionation in δ186W during the adsorp-tion of tungstate on Mn and Fe (oxyhydr)oxides has been reported (Mohajerin et al., 2016), a similar fractionation of thiotungstate has not been reported yet. Fractionation in δ186W will likely change depending on the speciation of W. Our δ186W
sed data do not suggest that a formation of thiotungstate occurred and that the H2S concentration rose above 60 µmol kg−1.
Although δ186W
sed is constant, a significant negative shift in W concentration occurred at 14.5 ka. Similar shifts are also observed in metals with high crustal abundances, such as Al, Ti, and Fe (Rudnick and Gao, 2003). Further-more, the W concentrations show high correlations with those of Al (r = 0.87), Ti (r = 0.85), Fe (r = 0.71), Co (r = 0.71), Ni (r = 0.78), Cu (r = 0.77), and Zn (r = 0.87) (Table S2). The concentration shifts without a change in δ186W
sed may imply a change in supply from the lithogenic sources. Previous studies have reported that the Japan Sea received inflow of surface water from the Yellow Sea and the East China Sea as well as an inflow of fresh water from rivers around the Japan Sea until 15 ka (Oba et al., 1991, 1995). TWC became a major inflow after 10 ka. We observed an increase in Wsw and a concurrent decrease in salinity in the Yellow Sea and the East China Sea Table 1. Ages and Mo concentration when Mo peaks are present in this study and literatures
Sediment core KCEs-1 ROV07-2 PC9 IWANAI No. 3 1246 1239
Literature Zou et al. (2012) Xu et al. (2014) Crusius et al. (1999) This study Khim et al. (2012) Khim et al. (2012)
Latitude 35°56′09 ″ N 36°05′51 ″ N 39°34′19″ N 43°22′36″ N 43°46′00″ N 44°48′00 ″ N Longitude 130°41 ′55 ″ E 130°06′19 ″ E 139°24′30″ E 140°04′10″ E 138°50′00 ″ E 139°42′00″ E Depth 1464 m 1500 m 807 m 900 m 3435 m 840 m Age (ka) 260 5 9 28 32 7 10 27 24 9 10 11 35 28 8 26 14 13 17 16 15 11 11 27 24 16 25 55 29 8 17 8 80 21 60 40 18 40 17 45 9 80 22 19 8 55 70 35 20 29 12 20 7 80 20 21 30 27 5 80 14 30 47 11 9 45 55 10
(Sohrin et al., 1999). Thus, it is possible that the supply of W to the Japan Sea was substantial higher before 15 ka compared to the present. In addition, strong anoxic con-ditions were developed in the deep-water layers of the Japan Sea during the period between 30 and 15 ka (Oba
et al., 1991, 1995). Because W is removed only in oxic
sediments, the sink function of the sediment for W may have been reduced in the Japan Sea during this period. These conditions may have caused a higher steady con-centration of Wsw in the Japan Sea.
Figure 4B shows the isotope ratio of W plotted against the reciprocal of the W concentration in the IWANAI No. 3 core in comparison with literature values of a variety of geological samples (Krabbe et al., 2017; Kurzweil et
al., 2018, 2019; Tsujisaka et al., 2019). The observed
range of natural δ186W is minor compared to that of δ98Mo. The values of δ186W for the IWANAI No. 3 core occurred completely within an area of igneous rocks and oxic sediments. Therefore, this result indicate that the concen-tration and isotope ratio of W are not sensitive to redox change from oxic to weakly euxinic (11 µmol kg−1) con-dition.
Synthesis of Mo concentration data in Japan Sea sediments
There are several reports measuring the concentration of Mosed in sediment cores collected from the Japan Sea (Table 1). Crusius et al. (1999) investigated a sediment core at an intermediate depth of the eastern Japan Sea (KT-94 PC9; 807 m depth) and Khim et al. (2012) inves-tigated a sediment core at an intermediate depth of the northern Japan Sea (GH-99 1239; water depth 840 m). Both authors reported Mosed peaks at TL1 (10.5 ka) and TL2 (LGM). Moreover, the GH-99 1239 core also had a Mosed peak at 30 ka. Khim et al. (2012) also investigated a sediment core in the deepest area of the northern Japan Sea (GH-99 1246; 3435 m). Although the GH-9 1246 core had Mosed peaks at 5 ka and LGM, there was no peak at TL1. The sediment cores in the Tsushima Basin were in-vestigated by Xu et al. (2014) and Zou et al. (2012). Both cores of KCEs-1 (1464 m) and ROV07-2 (1500 m) showed concurrent peaks of Mosed since 11 ka. In contrast, Mosed showed larger variations before 11 ka, and the variations of Mosed were not concurrent between the two cores. The authors inferred that the bottom water became euxinic when Mosed was high. The Mosed concentration was less than 80 ppm, except for 260 ppm at 5 ka of GH-99 1246. The Mosed peaks since 11 ka were concurrent among sediment cores collected at intermediate depths in the Japan Sea, whereas the peak concentrations differed de-pending on the sites (Table 1). This suggests that a con-current variation in the redox condition occurred in the entire Japan Sea. Our hypothesis based on δ98Mo
sed may therefore apply to the entire Japan Sea. The accumula-tion of Mosed may have occurred in euxinic bottom water
with less than 11 µmol kg−1 H
2S or in pore water in sediments below the oxic-anoxic interface in the water column where simultaneously perform the Mn and Fe shuttle work. Therefore, we insist that measurements of Mo isotope compositions along with Mo concentrations are important for accurately estimating the redox condi-tions of the bottom environment. The literature suggests that the depth of the Japan Sea experienced alteration between anoxic and oxic conditions before 15 ka (Itaki et
al., 2004; Oba et al., 1991, 1995; Tada et al., 1999).
Ta-ble 1 shows that the timing and magnitude of Mo peaks in the Japan Sea sediments deposited before 15 ka varied substantially depending on the site and water depth. Thus, it is likely that the redox conditions were highly hetero-geneous in the deep-water layers of the Japan Sea during the last glacial age.
CONCLUSIONS
In this study, we report the concentrations and iso-topic compositions of Mo and W in the IWANAI No. 3 core in the northern Japan Sea along with other elements, such as C, N, S, Al, Ca, V, Mn, Fe, and U. Based on an analysis of the Mo/W ratio, we estimate that H2S appeared in the bottom and/or pore water at TLs and DLs of 11–10 ka, 17–14 ka (LGM), 31 ka, and 45 ka. The Mo/W ratio suggests that bottom water at the other TLs and DLs was oxic as well as when light colored clay was deposited. Because δ98Mo
sed in the IWANAI No. 3 core was signifi-cantly lower than δ98Mo
sw, the H2S concentration in seawater was estimated to be less than 11 µmol kg−1. These results provide additional and semi-quantitative constraints on the redox conditions discussed in previous studies. A negative shift of the Wauth depth profile occur-ring at 15 ka suggested a regime shift in the Japan Sea, which is consistent with the literature. In contrast, δ186W
sed was almost constant throughout the IWANAI No. 3 core, indicating an absence of a substantial change in the source (contributions of lithogenic and hydrothermal sources) and sink (contributions of oxic and euxinic sinks) for W. The data of Mo and W consistently suggest suboxic or weakly reducing conditions with H2S concentration less than 11 µmol kg−1 in the bottom water. We can say that the synthetic analysis of Mo and W more strictly con-strain the paleoceanographic conditions. Moderate off-sets between δ98Mo
sw and δ98Mosed were observed in lay-ers of 47–10 ka; these have not been fully explained yet and must be detailed in a future investigation.
Acknowledgments—We would like to thank Ki-Cheol Shin
(RIHN) for technical advice regarding MC-ICP-MS measure-ments. We would like to extend our appreciation to graduate students Daisuke Terui, Yui Morishima, and Shouhei Ichiwaki, who carried out the preliminary experiments of this study. This study was supported by KAKENHI grants (20654049,
21350042, 26610182, and 15H01727) from the Japan Society for the Promotion of Science (JSPS), Research Grants for En-vironmental Isotope Study from the Research Institute for Hu-manity and Nature (grant numbers 2016-7, 2017-8, 2018-15, and 2019-4), and Mitsumasa Ito Memorial Research Grants (grant number H30-R7 and H31-R2) from the Research Insti-tute for Oceanochemistry Foundation. We also thank Editage (www.editage.jp) for English language editing.
REFERENCES
Barling, J. and Anbar, A. D. (2004) Molybdenum isotope fractionation during adsorption by manganese oxides. Earth. Planet. Sci. Lett. 217, 315−329.
Barling, J., Arnold, G. L. and Anbar, A. D. (2001) Natural mass-dependent variations in the isotopic composition of molyb-denum. Earth. Planet. Sci. Lett. 193, 447−457.
Bauer, S., Conrad, S. and Ingri, J. (2018) Geochemistry of tung-sten and molybdenum during freshwater transport and es-tuarine mixing. J. Appl. Geochem. 93, 36−48.
Bodeï, S., Manceau, A., Geoffroy, N., Baronnet, A. and Buatier, M. (2007) Formation of todorokite from vernadite in Ni-rich hemipelagic sediments. Geochim. Cosmochim. Acta 71, 5698−5716.
Bronk Ramsey, C. B. (2009) Bayesian analysis of radiocarbon dates. Radiocarbon 51, 337−360.
Burkhardt, C., Hin, R. C., Kleine, T. and Bourdon, B. (2014) Evidence for Mo isotope fractionation in the solar nebula and during planetary differentiation. Earth. Planet. Sci. Lett.
391, 201−211.
Calvert, S. and Pedersen, T. (1993) Geochemistry of recent oxic and anoxic marine sediments: Implications for the geologi-cal record. Mar. Geol. 113, 67−88.
Crusius, J., Calvert, S., Pedersen, T. and Sage, D. (1996) Rhe-nium and molybdenum enrichments in sediments as indica-tors of oxic, suboxic and sulfidic conditions of deposition. Earth. Planet. Sci. Lett. 145, 65−78.
Crusius, J., Pedersen, T. F., Calvert, S. E., Cowie, G. L. and Oba, T. (1999) A 36 kyr geochemical record from the Sea of Japan of organic matter flux variations and changes in intermediate water oxygen concentrations. Paleoceanography 14, 248−259.
Dahl, T. W. and Wirth, S. B. (2017) Molybdenum isotope fractionation and speciation in a euxinic lake—Testing ways to discern isotope fractionation processes in a sulfidic set-ting. Chem. Geol. 460, 84−92.
Dahl, T. W., Anbar, A. D., Gordon, G. W., Rosing, M. T., Frei, R. and Canfield, D. E. (2010) The behavior of molybde-num and its isotopes across the chemocline and in the sediments of sulfidic Lake Cadagno, Switzerland. Geochim. Cosmochim. Acta 74, 144−163.
Dellwig, O., Wegwerth, A., Schnetger, B., Schulz, H. and Arz, H. W. (2019) Dissimilar behaviors of the geochemical twins W and Mo in hypoxic-euxinic marine basins. Earth-Sci. Rev.
193, 1−23.
Emerson, S. R. and Huested, S. S. (1991) Ocean anoxia and the concentrations of molybdenum and vanadium in seawater. Mar. Chem. 34, 177−196.
Erickson, B. E. and Helz, G. R. (2000) Molybdenum(VI)
speciation in sulfidic waters: Stability and lability of thiomolybdates. Geochim. Cosmochim. Acta 64, 1149−1158. Firdaus, M. L., Norisuye, K., Nakagawa, Y., Nakatsuka, S. and Sohrin, Y. (2008) Dissolved and labile particulate Zr, Hf, Nb, Ta, Mo and W in the Western North Pacific Ocean. J. Oceanogr. 64, 247−257.
Gamo, T., Nozaki, Y., Sakai, H., Nakai, T. and Tsubota, H. (1986) Spacial and temporal variations of water character-istics in the Japan Sea bottom layer. J. Mar. Res. 44, 781− 793.
Goldberg, T., Archer, C., Vance, D. and Poulton, S. W. (2009) Mo isotope fractionation during adsorption to Fe (oxyhydr)oxides. Geochim. Cosmochim. Acta 73, 6502− 6516.
Goldberg, T., Gordon, G., Izon, G., Archer, C., Pearce, C. R., McManus, J., Anbar, A. D. and Rehkämper, M. (2013) Reso-lution of inter-laboratory discrepancies in Mo isotope data: an intercalibration. J. Anal. At. Spectrom. 28, 724−735. Goto, K. T., Shimoda, G., Anbar, A. D., Gordon, G. W.,
Harigane, Y., Senda, R. and Suzuki, K. (2015) Molybde-num isotopes in hydrothermal manganese crust from the Ryukyu arc system: Implications for the source of molyb-denum. Mar. Geol. 369, 91−99.
Greber, N. D., Siebert, C., Nägler, T. F. and Pettke, T. (2012) δ98/95Mo values and molybdenum concentration data for
NIST SRM 610, 612 and 3134: Towards a common proto-col for reporting Mo data. Geostand. Geoanal. Res. 36, 291− 300.
Helz, G. R., Miller, C., Charnock, J., Mosselmans, J., Pattrick, R., Garner, C. and Vaughan, D. (1996) Mechanism of mo-lybdenum removal from the sea and its concentration in black shales: EXAFS evidence. Geochim. Cosmochim. Acta
60, 3631−3642.
Helz, G. R., Vorlicek, T. P. and Kahn, M. D. (2004) Molybde-num scavenging by iron monosulfide. Environ. Sci. Technol.
38, 4263−4268.
Hin, R. C., Burkhardt, C., Schmidt, M. W., Bourdon, B. and Kleine, T. (2013) Experimental evidence for Mo isotope fractionation between metal and silicate liquids. Earth. Planet. Sci. Lett. 379, 38−48.
Ikehara, K. (2003) Late Quaternary seasonal sea-ice history of the northeastern Japan Sea. J. Oceanogr. 59, 585−593. Ikehara, K. and Itaki, T. (2007) Millennial-scale fluctuations
in seasonal sea-ice and deep-water formation in the Japan Sea during the late Quaternary. Palaeogeogr. Palaeoclimatol. Palaeoecol. 247, 131−143.
Irisawa, K. and Hirata, T. (2006) Tungsten isotopic analysis on six geochemical reference materials using multiple collec-tor-ICP-mass spectrometry coupled with a rhenium-exter-nal correction technique. J. Arhenium-exter-nal. At. Spectrom. 21, 1387− 1395.
Ishibashi, M., Fujinaga, T., Kuwamoto, T., Koyama, M. and Sugibayashi, S. (1960) Chemical studies of the ocean. XXCIX: Coprecipitation of tungsten with ferric hydroxide. J. Chem. Soc. Jpn. 81, 392−395.
Itaki, T., Ito, M., Narita, H., Ahagon, N. and Sakai, H. (2003) Depth distribution of radiolarians from the Chukchi and Beaufort Seas, western Arctic. Deep-Sea Res. Part I Oceanogr. Res. Pap. 50, 1507−1522.
Itaki, T., Ikehara, K., Motoyama, I. and Hasegawa, S. (2004) Abrupt ventilation changes in the Japan Sea over the last 30 ky: evidence from deep-dwelling radiolarians. Palaeogeogr. Palaeoclimatol. Palaeoecol. 208, 263−278. Kashiwabara, T., Takahashi, Y., Tanimizu, M. and Usui, A.
(2011) Molecular-scale mechanisms of distribution and iso-topic fractionation of molybdenum between seawater and ferromanganese oxides. Geochim. Cosmochim. Acta 75, 5762−5784.
Kashiwabara, T., Takahashi, Y., Marcus, M. A., Uruga, T., Tanida, H., Terada, Y. and Usui, A. (2013) Tungsten spe-cies in natural ferromanganese oxides related to its differ-ent behavior from molybdenum in oxic ocean. Geochim. Cosmochim. Acta 106, 364−378.
Kashiwabara, T., Kubo, S., Tanaka, M., Senda, R., Iizuka, T., Tanimizu, M. and Takahashi, Y. (2017) Stable isotope fractionation of tungsten during adsorption on Fe and Mn (oxyhydr)oxides. Geochim. Cosmochim. Acta 204, 52−67. Kendall, B., Gordon, G. W., Poulton, S. W. and Anbar, A. D. (2011) Molybdenum isotope constraints on the extent of late Paleoproterozoic ocean euxinia. Earth. Planet. Sci. Lett.
307, 450−460.
Kerl, C. F., Lohmayer, R., Bura-Nakic, E., Vance, D. and Planer-Friedrich, B. (2017) Experimental confirmation of isotope fractionation in thiomolybdates using ion chromatographic separation and detection by multicollector ICPMS. Anal Chem. 89, 3123−3129.
Khim, B.-K., Tada, R., Park, Y. H., Bahk, J. J., Kido, Y., Itaki, T. and Ikehara, K. (2009) Correlation of TL layers for the synchronous paleoceanographic events in the East Sea (Sea of Japan) during the Late Quaternary. Geosci. J. 13, 113− 120.
Khim, B.-K., Ikehara, K. and Irino, T. (2012) Orbital- and millennial-scale paleoceanographic changes in the north-eastern Japan Basin, East Sea/Japan Sea during the late Quaternary. J. Quat. Sci. 27, 328−335.
Kishida, K., Sohrin, Y., Okamura, K. and Ishibashi, J. (2004) Tungsten enriched in submarine hydrothermal fluids. Earth. Planet. Sci. Lett. 222, 819−827.
Klinkhammer, G. P. and Palmer, M. R. (1991) Uranium in the oceans: Where it goes and why. Geochim. Cosmochim. Acta
55, 1799−1806.
Krabbe, N., Kruijer, T. S. and Kleine, T. (2017) Tungsten sta-ble isotope compositions of terrestrial samples and meteor-ites determined by double spike MC-ICPMS. Chem. Geol.
450, 135−144.
Kurzweil, F., Wille, M., Gantert, N., Beukes, N. J. and Schoenberg, R. (2016) Manganese oxide shuttling in pre-GOE oceans—evidence from molybdenum and iron iso-topes. Earth. Planet. Sci. Lett. 452, 69−78.
Kurzweil, F., Münker, C., Tusch, J. and Schoenberg, R. (2018) Accurate stable tungsten isotope measurements of natural samples using a 180W-183W double-spike. Chem. Geol. 476,
407−417.
Kurzweil, F., Münker, C., Grupp, M., Braukmüller, N., Fechtner, L., Christian, M., Hohl, S. V. and Schoenberg, R. (2019) The stable tungsten isotope composition of modern igne-ous reservoirs. Geochim. Cosmochim. Acta 251, 176−191. Kuzmin, Y., Burr, G., Gorbunov, S., Rakov, V. and Razjigaeva,
N. (2007) A tale of two seas: reservoir age correction val-ues (R, ∆R) for the Sakhalin Island (Sea of Japan and Okhotsk Sea). Nucl. Instrum. Meth. B 259, 460−462. Li, J., Liang, X.-R., Zhong, L.-F., Wang, X.-C., Ren, Z.-Y., Sun,
S.-L., Zhang, Z.-F. and Xu, J.-F. (2014) Measurement of the isotopic composition of molybdenum in geological sam-ples by MC-ICP-MS using a novel chromatographic extrac-tion technique. Geostand. Geoanal. Res. 38, 345−354. Lim, D., Xu, Z., Choi, J., Kim, S., Kim, E., Kang, S. and Jung,
H. (2011) Paleoceanographic changes in the Ulleung Ba-sin, East (Japan) Sea, during the last 20,000 years: Evidence from variations in element composition of core sediments. Prog. Oceanogr. 88, 101−115.
Menard, H. and Smith, S. M. (1966) Hypsometry of ocean ba-sin provinces. J. Geophys. Res. 71, 4305−4325.
Minoura, K., Akaki, K., Nemoto, N., Tsukawaki, S. and Nakamura, T. (2012) Origin of deep water in the Japan Sea over the last 145kyr. Palaeogeogr. Palaeoclimatol. Palaeoecol. 339−−−−−341, 25−38.
Mohajerin, T. J., Helz, G. R., White, C. D. and Johannesson, K. H. (2014) Tungsten speciation in sulfidic waters: Determi-nation of thiotungstate formation constants and modeling their distribution in natural waters. Geochim. Cosmochim. Acta 144, 157−172.
Mohajerin, T. J., Helz, G. R. and Johannesson, K. H. (2016) Tungsten-molybdenum fractionation in estuarine environ-ments. Geochim. Cosmochim. Acta 177, 105−119. Morford, J. L. and Emerson, S. (1999) The geochemistry of
redox sensitive trace metals in sediments. Geochim. Cosmochim. Acta 63, 1735−1750.
Nägler, T. F., Siebert, C., Lüschen, H. and Böttcher, M. E. (2005) Sedimentary Mo isotope record across the Holocene fresh-brackish water transition of the Black Sea. Chem. Geol. 219, 283−295.
Nägler, T. F., Neubert, N., Böttcher, M. E., Dellwig, O. and Schnetger, B. (2011) Molybdenum isotope fractionation in pelagic euxinia: Evidence from the modern Black and Bal-tic Seas. Chem. Geol. 289, 1−11.
Nägler, T. F., Anbar, A. D., Archer, C., Goldberg, T., Gordon, G. W., Greber, N. D., Siebert, C., Sohrin, Y. and Vance, D. (2014) Proposal for an international molybdenum isotope measurement standard and data representation. Geostand. Geoanal. Res. 38, 149−151.
Nakagawa, Y., Takano, S., Firdaus, M. L., Norisuye, K., Hirata, T., Vance, D. and Sohrin, Y. (2012) The molybdenum iso-topic composition of the modern ocean. Geochem. J. 46, 131−141.
Nakajima, T., Yoshikawa, K., Ikehara, K., Katayama, H., Kikawa, E., Joshima, M. and Seto, K. (1996) Marine sediments and late Quaternary stratigraphy in the South-eastern part of the Japan Sea—Concerning the timing of dark layer deposition—. J. Geol. Soc. Japan 102, 125−138. Neubert, N., Nägler, T. F. and Böttcher, M. E. (2008) Sulfidity controls molybdenum isotope fractionation into euxinic sediments: Evidence from the modern Black Sea. Geology
36, 775−778.
Oba, T., Kato, M., Kitazato, H., Koizumi, I., Omura, A., Sakai, T. and Takayama, T. (1991) Paleoenvironmental changes in the Japan Sea during the last 85,000 years.
Paleoceanography 6, 499−518.
Oba, T., Murayama, M., Matsumoto, E. and Nakamura, T. (1995) AMS-14C ages of Japan Sea cores from the Oki Ridge. Quat. Res. (Daiyonki-kenkyu) 34, 289−296.
Ostrander, C. M., Sahoo, S. K., Kendall, B., Jiang, G., Planavsky, N. J., Lyons, T. W., Nielsen, S. G., Owens, J. D., Gordon, G. W., Romaniello, S. J. and Anbar, A. D. (2019) Multiple negative molybdenum isotope excursions in the Doushantuo Formation (South China) fingerprint complex redox-related processes in the Ediacaran Nanhua Basin. Geochim. Cosmochim. Acta 261, 191−209.
Poulson-Brucker, R. L., McManus, J., Severmann, S. and Berelson, W. M. (2009) Molybdenum behavior during early diagenesis: Insights from Mo isotopes. Geochem., Geophys., Geosyst. 10.
Rudnick, R. L. and Gao, S. (2003) Composition of the conti-nental crust. Treatise Geochem. 3, 659.
Scholz, F., McManus, J. and Sommer, S. (2013) The manga-nese and iron shuttle in a modern euxinic basin and impli-cations for molybdenum cycling at euxinic ocean margins. Chem. Geol. 355, 56−68.
Scholz, F., Siebert, C., Dale, A. W. and Frank, M. (2017) In-tense molybdenum accumulation in sediments underneath a nitrogenous water column and implications for the recon-struction of paleo-redox conditions based on molybdenum isotopes. Geochim. Cosmochim. Acta 213, 400−417. Scott, C. and Lyons, T. W. (2012) Contrasting molybdenum
cycling and isotopic properties in euxinic versus non-euxinic sediments and sedimentary rocks: Refining the paleoproxies. Chem. Geol. 324−−−−325, 19−27.−
Senjyu, T. and Sudo, H. (1994) The upper portion of the Japan Sea Proper Water; its source and circulation as deduced from isopycnal analysis. J. Oceanogr. 50, 663−690.
Shimmield, G. and Price, N. (1986) The behaviour of molyb-denum and manganese during early sediment diagenesis-offshore Baja California, Mexico. Mar. Chem. 19, 261−280. Siebert, C., Nägler, T. F., von Blanckenburg, F. and Kramers, J. D. (2003) Molybdenum isotope records as a potential new proxy for paleoceanography. Earth. Planet. Sci. Lett. 211, 159−171.
Siebert, C., McManus, J., Bice, A., Poulson, R. and Berelson, W. M. (2006) Molybdenum isotope signatures in continen-tal margin marine sediments. Earth. Planet. Sci. Lett. 241, 723−733.
Sohrin, Y., Isshiki, K., Kuwamoto, T. and Nakayama, E. (1987) Tungsten in North Pacific waters. Mar. Chem. 22, 95−103. Sohrin, Y., Matsui, M. and Nakayama, E. (1999) Contrasting behavior of tungsten and molybdenum in the Okinawa Trough, the East China Sea and the Yellow Sea. Geochim. Cosmochim. Acta 63, 3457−3466.
Sudo, H. (1986) A note on the Japan Sea proper water. Prog. Oceanogr. 17, 313−336.
Tada, R. (1995) Possible Dansgaard-Oeschger oscillation sig-nal recorded in the Japan Sea sediments. Proc. of 1994 IGBP Symposium: Global Flux of Carbon and Its Related Sub-stances in the Coastal Sea-Ocean-Atmosphere System. Tada, R., Irino, T. and Koizumi, I. (1999) Land-ocean linkages
over orbital and millennial timescales recorded in late Qua-ternary sediments of the Japan Sea. Paleoceanography 14,
236−247.
Takahashi, Y., Manceau, A., Geoffroy, N., Marcus, M. A. and Usui, A. (2007) Chemical and structural control of the par-titioning of Co, Ce, and Pb in marine ferromanganese ox-ides. Geochim. Cosmochim. Acta 71, 984−1008.
Takematsu, N., Sato, Y., Okabe, S. and Usui, A. (1990) Uptake of selenium and other oxyanionic elements in marine ferromanganese concretions of different origins. Mar. Chem.
31, 271−283.
Thoby, M., Konhauser, K. O., Fralick, P. W., Altermann, W., Visscher, P. T. and Lalonde, S. V. (2019) Global importance of oxic molybdenum sinks prior to 2.6 Ga revealed by the Mo isotope composition of Precambrian carbonates. Geol-ogy 47, 559−562.
Toba, Y. (1982) Seasonal and year-to-year variability of the Tsushima-Tsugaru Warm Current System with its possible cause. La mer 20, 41−51.
Tribovillard, N., Algeo, T. J., Lyons, T. and Riboulleau, A. (2006) Trace metals as paleoredox and paleoproductivity proxies: An update. Chem. Geol. 232, 12−32.
Tsujisaka, M., Takano, S., Murayama, M. and Sohrin, Y. (2019) Precise analysis of the concentrations and isotopic compo-sitions of molybdenum and tungsten in geochemical refer-ence materials. Anal. Chim. Acta 1091, 146−159.
Wanty, R. B. and Goldhaber, M. B. (1992) Thermodynamics and kinetics of reactions involving vanadium in natural sys-tems: Accumulation of vanadium in sedimentary rocks. Geochim. Cosmochim. Acta 56, 1471−1483.
Wasylenki, L. E., Weeks, C. L., Bargar, J. R., Spiro, T. G., Hein, J. R. and Anbar, A. D. (2011) The molecular mechanism of Mo isotope fractionation during adsorption to birnessite. Geochim. Cosmochim. Acta 75, 5019−5031.
Watanabe, S., Tada, R., Ikehara, K., Fujine, K. and Kido, Y. (2007) Sediment fabrics, oxygenation history, and circula-tion modes of Japan Sea during the Late Quaternary. Palaeogeogr. Palaeoclimatol. Palaeoecol. 247, 50−64. Watanabe, Y., Kashiwabara, T., Ishibashi, J., Sekizawa, O.,
Nitta, K., Uruga, T. and Takahashi, Y. (2017) Different par-titioning behaviors of molybdenum and tungsten in a sedi-ment-water system under various redox conditions. Chem. Geol. 471, 38−51.
Willbold, M., Hibbert, K., Lai, Y. J., Freymuth, H., Hin, R. C., Coath, C., Vils, F. and Elliott, T. (2016) High-precision mass-dependent molybdenum isotope variations in mag-matic rocks determined by double-spike MC-ICP-MS. Geostand. Geoanal. Res. 40, 389−403.
Wille, M., Nagler, T. F., Lehmann, B., Schroder, S. and Kramers, J. D. (2008) Hydrogen sulphide release to surface waters at the Precambrian/Cambrian boundary. Nature 453, 767−769. Xu, Z., Lim, D., Choi, J., Li, T., Wan, S. and Rho, K. (2014) Sediment provenance and paleoenvironmental change in the Ulleung Basin of the East (Japan) Sea during the last 21 kyr. J. Asian Earth. Sci. 93, 146−157.
Zhao, P. P., Li, J., Zhang, L., Wang, Z. B., Kong, D. X., Ma, J. L., Wei, G. J. and Xu, J. F. (2016) Molybdenum mass frac-tions and isotopic composifrac-tions of international geological reference materials. Geostand. Geoanal. Res. 40, 217−226. Zheng, Y., Anderson, R. F., Van Geen, A. and Kuwabara, J. (2000) Authigenic molybdenum formation in marine
sediments: a link to pore water sulfide in the Santa Barbara Basin. Geochim. Cosmochim. Acta 64, 4165−4178. Zou, J., Shi, X., Liu, Y., Liu, J., Selvaraj, K. and Kao, S.-J.
(2012) Reconstruction of environmental changes using a multi-proxy approach in the Ulleung Basin (Sea of Japan) over the last 48 ka. J. Quat. Sci. 27, 891−900.
SUPPLEMENTARY MATERIALS
URL (http://www.terrapub.co.jp/journals/GJ/archives/ data/54/MS606.zip)
Figures S1 to S3 Tables S1 to S3