トップページ - 横浜国立大学学術情報リポジトリ
26
0
0
全文
(2) 98. (380). Yokohama Journal of Social Sciences, Vol. 23, No. 3. 2.Literature Review on Impact of Public Debt on Economic Growth 2. 1 Theoretical Explanations on Impact of Public Debt on Economic Growth What do we know from the theoretical literature about the link between public debt and economic growth? The issue has not been well-explored. However, we can formulate some theories on this issue. This study first discusses the explanation by which low levels of government debt have a positive effect on growth, and then examines the theory whereby a high debt-to-GDP (gross domestic product) ratio is likely to be correlated with lower growth. Then, the study examines several explanations that combine both effects and argue that debt may have a nonlinear impact on economic growth. 2. 1. 1 Positive Impact on Economic Growth This study starts with a short survey of what the theoretical explanations tell us about the positive impact of public debt on economic growth. In traditional neoclassical explanations, average public debt should create a favorable environment for government borrowing intended for public spending and should also increase transitional growth because of the low-risk default level. Moreover, if the marginal product of capital is higher than the interest rate, the borrowing country would benefit from debt (Eaton, 1993). The debtors need to maintain their reputation in order to continue borrowing to finance their public spending and investments (Bulow and Rogoff, 1989). Under the assumption that governments create fiscal deficits by decreasing tax revenue and maintaining constant public spending levels, Elmendorf and Mankiw (1999) argue that the economy is demand-determined in the short run. Therefore, if a government decides to reduce tax and maintain spending levels, which means an increase in the fiscal deficit and public debt, the aggregate demand will increase and economic output will grow. This mechanism happens because, in the short run, wages and prices are sticky, and a shift in aggregate demand will increase the utilization of factors of production in the economy. In principle, government borrowing helps finance the public goods that will create more welfare and promote economic growth in the short run. There are three methods of financing government spending: taxation, debt, and printing money (Gill and Pinto, 2005). According to Gill and Pinto (2005), government debt may be the best choice for facilitating growth, by investing in the vital mass of infrastructure projects when tax revenue is limited or when other alternatives, such as printing money, would lead to inflation. Gill and Pinto (2005) also argue that the positive effect of public debt on growth occurs only when governments perform their role well, and when the returns from public projects exceed the cost of borrowing. So far, the literature review suggests that the positive impact of public debt on economic growth is driven mainly by an expansionary fiscal policy in the short run. On the other hand, the long-run effect on growth is entirely different when the level of public debt continues to increase over time. The level of public debt thus plays an important role in driving the impact of public debt on economic growth. However, the theoretical literature has not yet indicated the threshold (turning point) after which public debtʼs impact changes the sign of economic growth from positive to negative. Under the assumption that the marginal product of capital or returns from public projects exceed interest rates or the cost of borrowing, the theoretical literature argues that sovereign debt will promote economic growth. 2. 1. 2 Negative Impact of Public Debt on GDP Growth This section discusses the various theoretical explanations of how public debt affects economic growth negatively..
(3) The Impact of Public Debt on Economic Growth(Tran Thi Phuong). (381). 99. First, to discuss the theorized linkage between public debt and economic growth in the long run, this study starts with a model built by Elmendorf and Mankiw (1999). According to Elmendorf and Mankiw (1999), in the long run, prices and wages are flexible. They define a mechanism for reducing investment through which a fiscal deficit will have a negative effect on the long-run output.1) Several researchers have developed theories about the negative link between public debt and growth using other approaches. Many important factors need to be considered, such as political economy considerations, uncertainty, and debt overhang. For example, Barro (1979) suggests that governments should raise taxes to achieve debt sustainability because a high level of public debt can lead to higher costs of servicing the debt and higher taxes to finance it. Corden (1989) argues that any activity related to costs that would require a portion of output to service them will be discouraged because the money required for investment will be taxed away by lenders. Moreover, investors are always afraid of the risk of default when the government lacks appropriate policies for controlling the level of high public debt. Another implication is that it will be difficult for the government to implement macroeconomic policies or economic reforms due to high public debt, as it would have to focus on lowering debt levels or debt repudiation. Poor macroeconomic policy environments influence the efficiency of investments via a negative effect on economic growth. Another explanation for adverse effects of debt on the economy is that high debt levels cause instability. The amount of investment in a country depends on the investment environment and on whether investors see the potential risks and returns clearly. Investors who detect uncertainties will decide not to invest (Serveng, 1997). In an environment with high uncertainty, investors prefer to invest in areas that offer quick returns, via trading activities, rather than in high-risk areas or areas requiring long-term or irreversible investments. Uncertainty leads to a misallocation of investments, lowering the overall efficiency of capital accumulation. This suggests that high public debt levels are linked to low growth through inefficient investment and capital accumulation. Alesina and Tabellini (1989) argue that over-borrowing can accompany low economic growth due to capital flight when the cost of high debt services cannot be internalized. A high accumulated external debt may lead to government instability in developing countries. Capital flight is considered a form of . 1)Output equations:. Y=C+S+T Y=C+I+G+NX where Y denotes national income, C private consumption, S private savings, T taxes less government transfer payments, I domestic investment, G government expenditure, and NX the net export of goods and service. Combining both equations produces S+(T-G)=I+NX. The equation posits that the sum of private savings and public savings equals the sum of investment and net exports. In principle, national current account balance has to equal the negative of the capital account balance. The national current account balance is the sum of net exports and the net investment income of domestic investors and net transfers. However, the authors ignore the two last elements, since they are small. Then, net exports are approximately equal to net foreign investment (NFI), which is calculated as the investments by domestic citizens in foreign countries minus the domestic investments of international citizens (NX=NFI). Substituting NX=NFI into the third equation above produces S+(T-G)=I+NFI. The left side of this equation represents national savings computed as total private savings and public savings, and the right side represents the sum of investments at home and abroad. This equation can be considered as a representation of a market for loanable funds: one is the supply side; the other is the demand side. If the government increases public debt by creating a fiscal deficit and faces decreasing public savings, the above equation may be satisfied by a decrease in domestic investment or net foreign investment. Decreases in both domestic investment and NFI will lower national output and income..
(4) 100 (382). Yokohama Journal of Social Sciences, Vol. 23, No. 3. insurance when capital faces politico-economic uncertainties. Debt overhang theory is an important explanation for the adverse effect of a high level of public debt on economic growth. The theory focuses on two main aspects: investment and fiscal policies. Investment is the primary channel for the debt overhang theories based on Krugman (1988). This explanation argues that debt will likely become greater than countriesʼ repayment ability. Debt servicing will then become an increasingly large part of its output level. A portion of investment returns will be taken away by an increasing marginal tax imposed by external creditors. Therefore, domestic and international investments will be discouraged (Krugman, 1988; Sachs, 1989). Debt overhang theory also focuses on the fiscal aspects of the fundamental problem of debt. Given the heavy accumulated debt stocks, it is expected that the government will have to spend more on debt servicing. Therefore, the share of productive public investment will be reduced (Agénor and Montiel, 1996). In general, public debt may influence economic growth through investment volume or the effectiveness of investments, including government investments and private investments by both domestic and foreign investors. In general, public debt affects long-run economic growth negatively through channels such as investment, uncertainty, and political considerations. Many researchers have pointed out the logic of this problem, but none has yet identified a public debt threshold. If public debt continues to rise to the point where the government is unable to service it, the government will face a debt overhang problem. In this case, the high probability of default will be clearly seen as a risk factor in the economy, and capital flight may become a problem. 2. 1. 3 Non-linear Impact of Public Debt on Growth A small part of the theoretical literature has argued that public debt has non-linear effects on the economy when the positive and negative impacts are considered jointly. According to these explanations, the main channel through which debt has a nonlinear relationship with growth is investment. Productivity may adjust these nonlinear effects. Cohen (Cohen and Sachs, 1986; Cohen, 1991; Cohen, 1992) suggests an endogenous growth model in which capital accumulation plays a vital role in driving economic growth. According to Cohen, nations with low public debt levels have more opportunities to access capital flows from domestic investors and international financial markets due to its reputatioin of low risk debt. These factors enhance growth because the country has capital sources (from borrowing) with which to invest. After a period of favorable borrowing, the countryʼs economic growth will slow because the cost of debt servicing will increase significantly. However, the country can still control the reduction in growth or even arrest it by refraining from borrowing on the international market. If the country cannot achieve an optimal rescheduling policy, debt overhang effects will influence growth negatively. Moreover, high levels of public debt are related to the problem of capital flight (Calvo, 1998). High debt creates a tax burden. If the economy cannot grow fast enough to generate the resources needed to repay a certain amount of its debt, the government will need to increase the debt. Due to these negative effects, returns on investment will be lower, and investors will thus become hesitant to invest in the heavily indebted country. Finally, the nonlinear impact of public debt levels on economic growth can be explained by models based on the debt Laffer curve. The debt Laffer curve (with an inverted U-shape) can explain the causal relationship between public debt and economic growth (Pattillo, Poirson, and Ricci, 2002). The debt Laffer curve argues that, on the left (or “good”) side of the curve, along with an increase in the face value of debt servicing, there is also an increase in debt repayment. On the other hand, on the right (or “wrong”) side of the curve, with the.
(5) The Impact of Public Debt on Economic Growth(Tran Thi Phuong). (383) 101. higher face value, debt will lead to a reduction in expected repayments. The peak of the curve is the critical point where the debt stock can have a negative effect on investment and productivity, which will require a greater cost to trade off with future benefits. This theory may be appropriate when combining the positive and adverse effects of public debt on economic growth, but it does not provide a method for identifying the threshold at which debtʼs impacts would change direction from positive to negative. Overall, we can conclude that the issue of public debt levels is central when considering the impact of debt on economic growth. A low and reasonable level of public debt can create a good environment for further borrowing, and the government can conduct an expansionary fiscal policy, increase public investment, and boost economic growth. However, the positive effect happens only when public spending based on borrowing is invested in productive activities and when its return is higher than the borrowing cost. On the other hand, public debt may rise to a level that needs to be addressed due to its negative effect on growth. When public debt reaches a level that may lead to instability and a risk of default, investment into the country will decline, which will in turn reduce economic growth. The higher debt will force the government to pay higher costs, and taxes will likely increase, making investors hesitant to invest in the high-debt country. A country with a high level of debt may have a weak macroeconomic policy due to the uncertainties explained by the debt overhang and capital flight theories. Combining two elements of debtʼs effects on growth, the debt Laffer curve is critical for explaining the nonlinear effect of debt on growth. Crucially, however, the theoretical literature has not yet identified a mechanism by which to identify the debt level threshold. According to Elmendorf and Mankiw (1999), the long- and short-run economic factors of price and wage flexibility drive the effects of public debt on growth. However, some neoclassical economists consider public debt levels to have the main effects on investment and to thus drive economic growth. 2. 2 Empirical Literature on the Impact of Public Debt on Growth Many researchers have studied the impact of public debt empirically. They use a variety of samples from developed, developing, and low-income countries over different time periods. For example, Dreger and Reimers (2013), Checherita-Westphal and Rother (2012), and Mencinger, Aristovnik, and Verbic (2014) use data from European countries but consider different periods. They all find that public debt has a nonlinear effect on economic growth. Dreger and Reimers (2013) collect data from 12 EU members along with Denmark, Sweden, the United Kingdom, Turkey, the United States, and Japan. They use panel regression and a fixed effects model. Checherita-Westphal and Rother (2012) use a cross-sectional sample of 12 EU countries and cover nearly 40 years (1970 to 2008) to test the relationship between government debt and growth using a quadratic equation based on debt. The critical estimation technique used in all these studies is a fixed effects model and generalized method of moments, instrumental variables, and two-stage least squares systems as estimators in order to reach unbiased results from the linear and nonlinear models. The results show that the channels through which the effects of public debt on growth are nonlinear are total factor productivity, private savings, and public investment. The shape of the relationship between public debt and growth is an inverted U (concave), with a turning point of around 90‒100% of GDP. This threshold is the average for 12 countries, and the threshold may be as low as 60‒70% of GDP. Mencinger, Aristovnik, and Verbic (2014) use a dataset collected from 25 EU countries to examine the non-linear and concave effects of public debt on growth. They divide the sample into two sub-groups: “old” members who joined the EU between 1980 and 2010, and “new”.
(6) 102 (384). Yokohama Journal of Social Sciences, Vol. 23, No. 3. members who became EU member states between 1995 and 2010. The authors suggest that the debt-to-GDP turning point at which public debt starts to have negative effects on growth is between 80 and 90% of GDP for old members and 50 to 54% of GDP for new members. The nonlinear effect of public debt on growth is also examined in Panizza and Presbitero (2014). However, no evidence of public debtʼs causal effect on growth is found after robustness tests are run. They test for adverse causal effects of public debt on growth using the IV approach and fixed effects for OECD countries. They conclude that no impacts of debt on growth are apparent and that there is not enough evidence to conclude anything about the causal link between public debt and growth—in other words, that no such link exists. Researchers have also used data from developing countries and have found similar results. Clements, Bhattacharya, and Nguyen (2003) examine the relationship between external debt and growth as well as the channels through which external debt influences GDP growth. They use data from 55 low-income countries covering 1970 to 1999. The results lend some support to the debt Laffer curve theory. They find that growth will increase if the debt level is lower than a threshold of around 50% GDP for the face value of debt, 20‒25% of GDP for the net present value, or 100‒105% of exports for the present value of external debt, whereas growth will decrease if the debt level is higher than this threshold. The research shows that debt can influence growth through investments and the efficiency of resource use. Similarly, Pattillo, Poirson, and Ricci (2002) suggest a non-linear relationship between debt and growth using the Laffer curve. The authors use panel data on 93 developing countries covering 1969‒1998. They find that the average and marginal impacts of debt become negative at thresholds of around 35‒40% of GDP and 160‒170% of exports. Their work also shows that investment is not the primary channel through which debt affects economic growth. Poirson, Pattillo, and Ricci (2004) investigate these channels, finding that debt in low-debt countries tends to have positive impacts on total factor productivity and average negative effects on capital but that both effects are not significant. Kourtellos, Stengos, and Tan (2013) examine public debtʼs effect on growth from the perspective of multiple regimes using data from 82 countries and 10-year panel data covering 1980‒1989, 1990‒1999, and 2000‒2009. Their empirical analysis uses structural threshold regression and a Solow growth model that includes variable reflecting government size. The findings show that in low-democracy national regimes, higher public debt leads to lower economic growth, while, in high-democracy regimes, public debt does not have a significant effect on GDP growth. Studies using mixed samples that include both developed and developing countries also find a non-linear impact of public debt on economic growth. For example, Reinhart and Rogoff (2010) examine the relationship between economic growth, inflation, and external debt in 44 countries (20 advanced and 24 emerging market economies) over a period of 200 years. The findings show that public debt higher than a threshold of 90% of GDP has a negative impact on growth but that the relationship between debt and economic growth is weak when the debt is lower than the threshold. Kumar and Woo (2010) also explore the impact of a high level of public debt on economic growth in the long run. Their data are taken from both developed and developing countries and cover nearly 40 years (1970‒2007). They divide public debt into four levels: below 30% of GDP, 30‒60% of GDP, 60‒90% of GDP, and higher than 90% of GDP. The result shows a nonlinear effect of public debt on economic growth at a threshold (90% of GDP) similar to that in Reinhart and Rogoff (2010). This shift in economic growth may happen because higher initial debt leads to lower investment and a slowdown in labor productivity growth..
(7) The Impact of Public Debt on Economic Growth(Tran Thi Phuong). (385) 103. Literature Survey on the Relationship between Public Debt and Economic Growth in ASEAN Several studies have examined the relationship between public debt and economic growth using samples taken from both single countries and country groups among ASEAN members. Lee and Ng (2015) study whether public debt influences economic growth in Malaysia during 1991‒2013, finding that public debt and budget deficits have negative and significant impacts on economic growth through channels such as public savings and decreased investment. Rahman (2012) uses quarterly data from 2000‒2011 to examine the impact of the Malaysian governmentʼs public debt on economic growth. His results reveal that, in the long run, domestic public debt has negative effects on economic growth while external debt has no significant impact on GDP growth. The findings also indicate that in the short run, neither domestic nor external debt has a significant influence on Malaysiaʼs economic growth. Mohd Daud, Admad, and Azman-Saini (2013) use data on external debt and economic growth in Malaysia covering 1991‒2009 to explore the relationship between those variables. Their results show a non-linear correlation between external debt and improvements in economic growth. Thus, the empirical results on the impact of public debt on economic growth differ from study to study even in research on Malaysia. Patenio and Tan-Cruz (2007) examine the relationship between external debt servicing and economic growth during 1981 ‒ 2005 in the Philippines. The study shows that external debt servicing does not significantly affect economic growth since debt service payments in the Philippines are not high enough to cause a debt overhang problem. However, Akram (2015) studies whether public debt impedes economic growth in the Philippines, finding that public external debt has a negative correlation with GDP growth and investment, whereas domestic debt has a negative correlation with investment but a positive relationship with GDP growth. Azam, Emirullah, Prabhakar, and Khan (2013) analyze the impact of external public debt on economic growth in Indonesia using time series data from 1980‒2012, finding that external debt negatively affects economic growth when other variables─such as exports, gross savings, infrastructure, and the inflation rate─are controlled for. Vileth (2016) investigates the effects of external debt and debt servicing on economic growth in Lao PDR using data from 1996‒2015 and finds that external debt and debt servicing have negative impacts on GDP growth. Ha and Oanh (2017) use quarterly data on Vietnamese public debt from 2000 to 2012 to find that debt has a non-linear (inverted U-shaped) correlation with economic growth at a threshold level of 28% of GDP. Van and Sudhipongpracha (2015) study the effects of government budget deficits on economic growth in Vietnam during 1989‒2011. Their findings reveal that budget deficits have no direct impact on Vietnamʼs economic growth or productivity, and that foreign direct investment is a crucial factor in improving Vietnamʼs economic productivity from 1989 to 2011. Few studies have examined the relationship between public debt and economic growth for the whole ASEAN region. Wibowo (2017) uses data taken from only eight countries: Indonesia, Laos, Vietnam, Myanmar, Malaysia, Philippines, Thailand, and Cambodia. His findings reveal a positive and significant effect of public debt on GDP growth but indicate that this effect lasts for only a few years. His data on public debt were taken from World Bankʼs International Debt Statistics. These data were on gross public debt in general, which is the sum of external public debt and domestic debt; therefore, the effect of gross public debt may be the sum of the effects of external and domestic debt. Tables 1 and 2 summarize the empirical literature on the link between public debt and economic growth. As is apparent, most of the findings suggest non-linear effects of public debt on economic growth in studies.
(8) Yokohama Journal of Social Sciences, Vol. 23, No. 3. 104 (386). Table 1 Summary some empirical literature on the link of public debt on growth Data Sample. Advanced Countries. The result of Empirical Study on the effect of public debt on economic growth No effect. Positive effect. Negative effect. Non-Linear effect. 1. Dreger and Reimers (2013) use debt to GDP ratio as a variable representing for Debt. 2. Chechrita-Westphal and Rother (2012) argue that government debt to GDP has a non-linear relationship with growth 1. Panizza and F. through channels of private savings, public Presbitero (2014) use investment and total factor productivity. the OECD sample. 3. Mencinger, Aristovnik, and Verbic (2014) They conclude that use debt to GDP ratio in the sample of EU there is no evidence countries. The thresholds are different: to confirm that debt 80%‒94% for old member states and 53%‒54% has a causal effect on new member states. (these results are fit with growth. The data used general theoretical assumptions of Elmendorf for debt is a debt to and Mankiw 1999) GDP ratio data. 4. Cecchetti, Mohanty, and Zampolli (2011) use data of 18 OECD countries from 1980 to 2010 to find the nonlinear effect of debt on growth with thresholds for each kind of debt: government debt (92%‒99%), private debt, corporate debt, and household debt.. Developing-LowIncome Countries. 1. Clements, Bhattacharya, and Nguyen (2003) examine the link between external debt with growth. Channels are investment and efficiency of resource use. 2. Pattillo, Poirson, and Ricci (2002): investigate the impact of external debt on growth in developing countries. High debt appears to reduce growth mainly by lowering quality of investment. 3. Poirson, Pattillo, and Ricci (2004) study what the channels through which external debt affects growth are. They find out the channels of capital accumulation and total factor productivity.. Mixed advanced and Developing Countries. 1. Reinhart and Rogoff (2010) argue that the impact of debt is weak for the debt to GDP ratios below a threshold level of 90%. If debt ratios are higher than this level, median growth starts to fall by 1%, and average growth decreases considerably more. 2. Kumar and Woo (2010) argue that channel is private capital accumulation for emerging economies, for advanced countries, channels are private saving, investment..
(9) The Impact of Public Debt on Economic Growth(Tran Thi Phuong). (387) 105. Table 2 Summary empirical literature on the link of debt on growth in ASEAN Data Sample. The result of Empirical Study on the effect of public debt on economic growth Negative effect. Non-Linear effect. Malaysia. 1. Lee and Ng (2015) test the impact of public debt and budget deficit on economic growth 2. Abd-Rahman (2012b) argue that domestic has a negative impact on growth in long-run. 1. Mohd Daud, Admad, and Azman-Saini (2013) study the link of external debt with growth. Philippines. 1. Patenio and Tan-Cruz (2007) study effect of external public debt service on growth 2. Akram (2015) examines the effect of external public debt and domestic public debt on growth.. Indonesia. 1. Azam, Emirullah, Prabhakar, and Khan (2013) investigate the effect of external debt on economic growth. Vietnam. No effect. Positive effect. 1.Van and Sudhipongpracha (2015) study effect of the deficit on growth. 1. Ha and Oanh (2017) examine the impact of external debt on growth 1. Vileth (2016) tests external public debt and debt service on economic growth. Lao P.D.R ASEAN (Malaysia, Thailand, Indonesia, Vietnam, Laos, Philippines, Myanmar, Cambodia). 1. Muhammad (2017) investigates the impact of gross public debt on growth. focusing on a wide range of countries. Most of the empirical studies that use data from developed countries use the ratio of total public debt to GDP as the variable representing public debt (Dreger and Reimers, 2013; Chechrita-Westphal and Rother, 2012; Mencinger, Aristovnik and Verbic, 2014; Cecchetti, Mohanty, and Zampolli, 2011; Reinhart and Rogoff, 2010; Kumar and Woo, 2010), and most of the empirical literature that uses data from developing economies uses the ratio of external debt to GDP as the main variable reflecting public debt (Clements, Bhattacharya, and Nguyen, 2003; Pattillo, Poirson, and Ricci, 2002). Very few studies take into account the relationship between domestic public debt and economic growth due to data limitations. When we investigate the impact of public debt on growth, we should explicitly distinguish between kinds of.
(10) 106 (388). Yokohama Journal of Social Sciences, Vol. 23, No. 3. debt (e.g., external public debt vs. domestic public debt) since their effects on growth may vary according to the economic condition and other fundamentals. The empirical literature generally indicates that public debt (investigated in single countries) has mostly negative impacts on economic growth, especially in developing ASEAN countries such as Malaysia, the Philippines, Laos, and Vietnam. The main reason is that public debt levels in those countries are high enough to affect economic growth negatively. However, for samples comprising a wide range of countries, public debt levels vary from country to country. Therefore, the impact of public debt on economic growth has an inverted-U shape. A crucial consideration when studying this issue is the channel through which public debt affects growth. Only a few empirical studies have used econometric techniques such as instrumental variables to examine the causal relationship between public debt and economic growth. 3.Implications of Literature Survey for ASEAN Countries The ASEAN was established in 1967 in Bangkok, Thailand, and initially comprised five countries. Since 1999, ASEAN has had 10 members: Indonesia, Malaysia, the Philippines, Singapore, Thailand, Cambodia, Myanmar, Vietnam, Lao PDR, and Brunei Darussalam. The aims of ASEAN are as follows: to maintain peace and stability in the region; to promote political, socio-cultural, and economic cooperation; and to advance sustainable development. In December 2015, the ASEAN Economic Community (AEC) was established, opening up a huge market of over 622 million people and about USD 2.6 trillion, the seventh-largest market in the world. Table 3 shows the gross national income (GNI) per capita of all ASEAN countries in 2010 and 2016. In 2016, Singapore led ASEAN countries with GNI per capita of USD 51,007 (constant USD 2010); in second position was Brunei. Cambodia and Myanmar are the two poorest countries, with GNI per capita of just over USD 1,000 in 2016 (World Bank, 2018). Following the classification criteria of the World Bank (Table 4), we can divide ASEAN into three groups: lower-middle-income economies (Cambodia, Lao PDR, Vietnam, Myanmar, Indonesia, and the Philippines), upper-middle-income economies (Malaysia and Thailand), and high-income-economies (Brunei and Singapore). The structures and levels of public debt vary from country to country depending on the economic and political situation. Public debt levels in ASEAN are diverse. Singapore and Brunei have only domestic public debt, while Cambodiaʼs public debt is almost as high as its external public debt; the other ASEAN members have both types of debt (domestic and external public debt). Singapore has no external public debt; its ratio of public debt to GDP is the highest among ASEAN nations (over 110% of GDP in 2016). Brunei Darussalamʼs external public debt was estimated to equal zero (IMF Article IV, 2017). Brunei has the lowest public debt to GDP ratio in the ASEAN (over 3% of GDP in 2016). Singapore and Brunei are high-income countries with rich domestic financial resources; therefore, they do not borrow from abroad and use internal resources for economic development. These countries do not want to be dominated by external sources and seek to minimize their financial risk. However, Singapore and Brunei have very different debt management policies. The risk due to high levels of public debt in Singapore is approximately zero since it has assets to back all of its borrowing. Singaporeʼs government does not borrow in order to spend. Instead, it invests all its borrowing proceeds. As Figure 1 shows, ASEAN members have various debt structures. For example, Brunei Darussalam and Singapore have no external public debt, while Cambodia has a large proportion of external public debt and.
(11) The Impact of Public Debt on Economic Growth(Tran Thi Phuong). (389) 107. Table 3 GNI per capita of ASEAN Countries GNI per capita, PPP (current international $). Country. GNI per capita (constant 2010 US$). 2010. 2016. 2010. Vietnam. 4,150. 6,040. 1,260. 1,658. Cambodia. 2,360. 3,510. 750. 1,009. Philippines. 6,610. 9,390. 2,567. 3,318. 987. >1,263 (2015). Myanmar. 2016. 3,650. 5,530. Indonesia. 8,040. 11,220. 3,031. 3,841. Lao PDR. 3,870. 6,270. 1,069. 1,566. Malaysia. 20,020. 26,900. 8,783. 10,727. Thailand. 12,660. 16,070. 4,863. 5,592. Singapore. 70,240. 85,020. 46,305. 51,007. Brunei Darussalam. 78,340. 83,010. 35,010. 33,401. Lower middle income. Upper middle income High income. Source: World Bank, 2018. Table 4 Classification of ASEAN countries by GNI per capita Upper-middle-income Economies ($3, 956 to $12, 235). High-income Economies ($12, 236 or more). Cambodia, Lao PDR, Vietnam, Myanmar, Indonesia, The Philippines. Malaysia, Thailand. Brunei Darussalam, Singapore. Figure 3.1: Public debt structure of ASEAN members in 2012 Source: World Bank, 2018. 120. 100. Percet of GDP. 4. Lower-middle-income Economies ($1,006 to $3,955). 80. 60 Domestic public debt. 40. External public debt. 20. 0. Source: IMF and Worldbank, 2014 Source: IMF and World bank, 2014 Figure. 1 Public debt structure of ASEAN members in 2012.
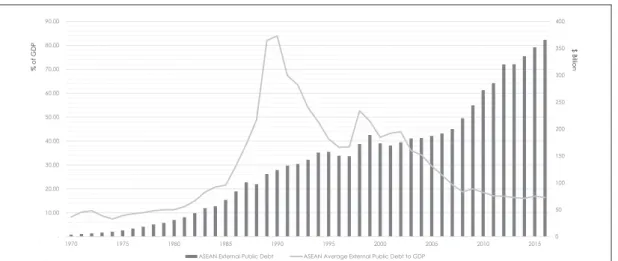
(12) Yokohama Journal of Social Sciences, Vol. 23, No. 3. 108 (390). Figure 3.2 External Public debt of ASEAN. 5. 400. 80.00. 350. 70.00. $ Billion. % of GDP. 90.00. 300. 60.00 250 50.00 200 40.00 150 30.00 100. 20.00. 50. 10.00. -. 1970. 1975. 1980. 1985. 1990. ASEAN External Public Debt. Source: World Bank, 2018 Bank, 2018 Source: World. 1995. 2000. 2005. 2010. 2015. 0. ASEAN Average External Public Debt to GDP. Figure 2 External Public debt of ASEAN. a very small proportion of domestic debt. Other countries have both external public debt and domestic debt. Therefore, the impact of public debt on each member countryʼs economic development varies depending on the type of debt it has. Most studies on the link between public debt and ASEAN membersʼ economic growth use data on external debt, budget deficits, and gross public debt. Two studies consider the impact of domestic debt on ASEAN membersʼ economic growth in the long run, finding that the effects differ depending on the macroeconomic conditions. The overall external public debt of the ASEAN almost equals the total external public debt of eight members countries (excluding Singapore and Brunei), as shown in Figure 2. The ratio of external public debt to GDP increased from 1970 to 1990 and then began to decrease in 1990, reaching a stable level on average of around 16% GDP from 2011 to 2016. Although the ratio of external public debt to GDP has decreased, the total amount of external public debt increased. These opposite shifts indicate that the growth rate of external public debt is slower than that of economic growth. Figure 3 shows the ratio of gross government debt to GDP for all ASEAN members from 1990 to 2016. Overall, the public debt to GDP ratio of lower-middle-income and upper-middle-income countries declined from 1990 to 2008 and then increased from 2008 to the present. Singapore has had the highest ratio of public debt to GDP among ASEAN nations in recent years, followed by Lao PDR, Vietnam, and Malaysia. Gross public debt and external public debt among ASEAN nations has increased significantly over the past 30 years. Furthermore, the ratio of public debt to GDP has risen since 2016, except in Thailand and the Philippines. Economic growth in the ASEAN heavily depends on the global economic situation, especially for highincome and upper-middle-income countries. Table 5 and Figure 4 show that the four lower-middle-income countries (Vietnam, Laos, Cambodia, and Myanmar ─ the so-called “VLCM”) suffered least from both the Asian financial crisis of 1997/98 and the global financial crisis of 2008/09. In 1998, six countries in the ASEAN had negative growth, while only four (the VLCM) had a positive rate. The global financial crisis hit the upper-middle-income group (Thailand and Malaysia) and the high-income group (Singapore and Brunei) hard due to a decrease in global demand and crude oil prices. Overall, the average economic growth rate in the.
(13) The Impact of Public Debt on Economic Growth(Tran Thi Phuong). 6 250. % of GDP. (391) 109. Figure 3.3 General government gross debt of ASEAN member in 1990-2016 General government gross Debt in ASEAN. 200. 150. 100. 50. 0. 1990. 1991. 1992. 1993. Vietnam. 1994. 1995. Cambodia. 1996. 1997. 1998. Lao P.D.R.. 1999. 2000. Myanmar. 2001. 2002. Philippines. 2003. 2004. Indonesia. 2005. 2006. 2007. 2008. Malaysia. 2009. Thailand. 2010. 2011. Singapore. 2012. 2013. 2014. 2015. 2016. Brunei Darussalam. Source: World Bank, 2018 2018 Source: World Bank,. Figure 3 General government gross debt of ASEAN members in 1990‒2016 Table 5 GDP per capita growth rate of ASEAN countries. Country Name Vietnam Cambodia Lao PDR Myanmar Philippines Indonesia Malaysia Thailand Singapore. 1998 4.42 2.28 2.07 4.48 (2.74) (14.35) (9.66) (8.73) (5.49). 2009 4.37 (1.40) 5.76 9.84 (0.46) 3.24 (4.27) (1.19) (3.56). 2016 5.09 5.29 5.53 4.91 5.26 3.83 2.67 2.93 0.68. Average (1985‒2016) 4.90 5.52 4.37 5.88 1.90 3.42 3.37 4.20 3.78. Brunei Darussalam. (2.80). (2.92). (3.77). (1.05). Growth rate. Figure 2018 Source:8World Bank,. 3.4 GDP per capita growth of ASEAN. 10.00. 5.00. -. (5.00). (10.00) ASEAN Lower Middle Income ASEAN Upper Middle Income ASEAN High Income (15.00). 2018 Source: World Bank, 2018 Source: World Bank,. Figure 4 GDP per capita growth of ASEAN over 1986‒2016.
(14) Yokohama Journal of Social Sciences, Vol. 23, No. 3. 110 (392). Table 6 Current Account Balance to GDP ratio of ASEAN members Country Vietnam Cambodia Lao PDR Myanmar Philippines Indonesia Malaysia Thailand Singapore Brunei Darussalam. 1998 (3.95) (5.56) (5.98). 2009 (6.23) (7.13) (1.04) 2.67 5.02 1.85 15.72 7.88 16.85 37.06. 2.14 4.03 13.20 12.53 21.56. Average (1985‒2016) (1.31) (5.92) (5.29) 0.53 (0.10) (0.37) 5.06 0.64 14.90 33.55. 2016 4.01 (8.87) (7.81) (3.18) (0.39) (1.80) 2.33 11.85 19.03 15.49. Source: World Bank, 2018. Figure 3.5 Current Account Balance to GDP ratio of ASEAN over 1985-2016 40.00. % Per GDP. 10. 35.00 30.00 25.00 20.00. ASEAN Lower Middle Income. 15.00. ASEAN Upper Middle Income. 10.00. ASEAN High Income. 5.00 -. 1985. 1987. 1989. 1991. 1993. 1995. 1997. 1999. 2001. 2003. 2005. 2007. 2009. 2011. 2013. 2015. (5.00) (10.00) (15.00). Bank, World 2018 Bank, 2018 Source: WorldSource:. Figure 5 Current Account Balance to GDP ratio of ASEAN over 1985-2016. ASEAN from 1985 to 2016 was high relative to other regions in the world. Myanmar had the highest average economic growth level in the ASEAN (of about 5.88% per year), followed by Cambodia (about 5.52%) and Laos (about 4.37%). The economic factors affecting public debt and growth in the ASEAN include trade balances, public investment, national savings, and budget deficits. These factors vary among the countries, which causes differences in levels of public debt and public debt management policies, which are subject to the political system. This study will describe some of the relevant economic factors and then discuss the public debt management policies and important national issues in each ASEAN nation. The nations have different current account balance levels. For example, the high-income countries have the highest current account balances, followed by the upper-middle-income countries, and the lower-middle-income countries. Table 6 and Figure 5.
(15) Figure 3.6 Net Investment in nonfinancial assets of the public sector of ASEAN members (In percent ofThe GDP) (393) 111 Impact of Public Debt on Economic Growth(Tran Thi Phuong). 11. Net investment in nonfinancial assets of in Public Net investment in Nonfinancial Assets PublicSector Sector % GDP. 10. 8. 6. 4. 2. 0. Vietnam. Cambodia. Lao PDR. Myanmar. Philippines. Indonesia. Malaysia. Thailand. Singapore. Brunei Darussalam. -2. -4 1998. 2003. 2009. 2013. 2016. Source: World Bank, 2018. Source: World Bank, 2018. Figure 6 Net Investment in nonfinancial assets of the public sector of ASEAN members (In percent of GDP). show the current account balances of ASEAN countries. Singapore and Brunei had the highest average current account balance to GDP ratios from 1985 to 2016 (14.9% and 33.55%, respectively). The lower-middleincome nations had negative average current account balances from 1985 to 2016. The high-income countries obtain large amounts of foreign currency from exports, so they have few foreign borrowing needs. Net public investment in the ASEAN also differs from country to country. Singapore has the lowest net investment to GDP ratio in non-financial assets in the ASEAN. The VLCM group has a very high level of public investment since they are developing countries that have only recently left the low-income group. Therefore, they need to invest a significant proportion of GDP in infrastructure. Figure 6 shows the levels of net public sector investment in non-financial assets over several years. Though Malaysia is an upper-middle-income nation, its ratio of net investment in non-financial assets to GDP is higher than Thailandʼs (more than 3.5% of GDP in 2016). This may be why the public debt level of Malaysia has been high recently. Besides the net investment in non-financial assets of the public sector, the ratio of gross savings to GDP also affects the level of public debt and economic growth in the ASEAN. Figure 7 shows the levels of gross savings among ASEAN members in 1998, 2009, and 2015. Singapore and Brunei had the highest ratios of gross savings to GDP. The VLCM subgroup had the lowest level. This may be why VLCM governments have to borrow to finance public spending and investment. Figure 8 shows the net lending/net borrowing levels of ASEAN countries from 1996 to 2016. The levels of the high-income countries have remained positive since 2003. Brunei has usually been a lender, while Singapore has maintained a budget balance, at a stable deficit level of around 0%. Among upper-middleincome nations, Thailandʼs budget deficit has been gradually improving since 2009, while Malaysiaʼs deficit has been increasing since 2010. However, for the lower-middle-income countries, net lending/net borrowing levels have remained negative for a long time, while also fluctuating across business cycles and varying among countries..
(16) Figure 3.7 Gross savings to GDP ratio of ASEAN members. 12. Yokohama Journal of Social Sciences, Vol. 23, No. 3. 112 (394). Gross savings (% of GDP) 60.00 50.00 40.00 30.00 20.00 10.00 -. Vietnam. Cambodia. Lao PDR. Myanmar. Philippines. Indonesia. 1998. 2015. 2009. Malaysia. Thailand. Singapore. Brunei Darussalam. Figure 3.8 Net lending (+) / net borrowing (-) (% of GDP) of ASEAN members 18 World Bank, 2018 Source: Figure 3.9 Current Account Balance of ASEAN members (% of GDP) Source. Figure 7 Gross savings to GDP ratio of ASEAN members. Current Account Balance of ASEAN High-income members. Net lending (+) / net borrowing (-) (% of GDP) of ASEAN High-Income Members 25. 60. 20. 50. 15. 40. 10. 30. 5. 20 0. 1996. 1997. 1998. 1999. 2000. 2001. 2002. 2003. 2004. 2005. 2006. 2007. 2008. 2009. 2010. 2011. 2012. 2013. 2014. 2015. 2016. 10. -5. 0. Figure 3.8 Net lending (+) / net borrowing (-) (% of GDP) of ASEAN members 17 Figure 3.9 Current Account Balance of ASEAN members (% of GDP) -10. 1985. 1987. 1989. 1991. 1993. 1995. 1997. 1999. 2001. 2003. 2005. 2007. 2009. 2011. 2013. 2015. 2013. 2015. -10. -15. Singapore. Singapore. Brunei Darussalam. Brunei Darussalam. Source: World Bank, 2018. Source: World Bank, 2018. Current Account Balance of ASEAN Upper-Middle-Income Members. Net lending (+) / net borrowing (-) (% of GDP) of ASEAN Upper-Middle-Income Members 20 4 15. 3 2. 10. 1 0 -1. 1996. 1997. 1998. 1999. 2000. 2001. 2002. 2003. 2004. 2005. 2006. 2007. 2008. 2009. 2010. 2011. 2012. 2013. 2014. 2015. 2016. -2. 5. 0. -3 -4. 1985. 1987. 1989. 1991. 1993. 1995. 1997. 1999. 2001. 2003. 2005. 2007. 2009. 2011. -5. -5. Figure 3.8 Net lending (+) / net borrowing (-) (% of GDP) of ASEAN 16 members Figure 3.9 Current Account Balance of ASEAN members (% of GDP) -6. -10. -7. Malaysia. Thailand. -15 Malaysia. Thailand. Source: World Bank, 2018 Source: World Bank, 2018. Current Account Balance of ASEAN Lower-Middle-Income members. Net lending (+) / net borrowing (-) (% of GDP) of ASEAN Lower-Middle-Income Members 10. 2 1 0 2000 -1. 5 2001. 2002. 2003. 2004. 2005. 2006. 2007. 2008. 2009. 2010. 2011. 2012. 2013. 2014. 2015. 2016. 1985. -2. 1987. 0. 1989. 1991. 1993. 1995. 1997. 1999. 2001. 2003. 2005. 2007. 2009. 2011. 2013. -5. -3 -4. -10. -5. -15. -6 -7. -20 Vietnam. Cambodia. Lao PDR. Myanmar. Philippines. Source: World Bank, 2018 Source: World Bank, 2018. Figure 8 Net lending (+) / net borrowing (-) (% of GDP) of ASEAN members. Vietnam. Cambodia. Lao PDR. Myanmar. Philippines. Indonesia. Source: World Bank, 2018 Source: World Bank, 2018. Figure 9 Current Account Balance of ASEAN members (% of GDP) . 2015.
(17) The Impact of Public Debt on Economic Growth(Tran Thi Phuong). (395) 113. Lao People s Democratic Republic 2) Lao PDR is one-party state ; its GDP growth rate has been highest in Asia, averaging about 7% per. year for the last decade. However, Laos remains a nation with underdeveloped infrastructure, especially in rural areas, limited land-line telecommunications. Agriculture accounts for about 20% of GDP but employs 73% of the total labor force. The unemployment rate was at a low level according to The World Factbook 2018, about 1.55 in 2016. On the other hand, 22% of the population is below the poverty line, a high level in ASEAN. The budget deficit of the Laos government was high at 5.6% of GDP in 2017. The public debt policy performance of Lao PDR has risen from moderate to the category which raises the risk of debt concern (IMF Article IV, 2017). The ratios of external public debt and publicly guaranteed (PPG) debt to GDP were significantly higher compared to other lower-middle-income countries in Asia. Both domestic public debt and external public debt rose significantly over the past 30 years. The public debt level of Laos breaches indicative benchmark for some years. The PPG debt ratio reached 65.8 percentage points of GDP at the end of the year 2015 higher than 62.5% GDP at the end of 2013. The increase in public debt of Laos is due to an increase in domestic debt which was issued in bills and bonds, higher borrowings from China and Thailand which was invested into power generation projects and the sovereign bonds which were issued in Thai market. Most of the public debt was issued in foreign currencies especially in US dollar. Therefore, the vulnerability of public debt highly depends on exchange rate depreciation. In particular, domestic debt increased from 11.6% of GDP in 2013 to 14.1% of GDP at the end of 2015. Most of the government borrowing was spent on big public infrastructure projects. In 2016, compensation in the public sector increased sharply, which led to a sharp increase in government expenditures and fiscal deficit. In FY 2015, the Lao PDR government tried to contain wage bill and reduce spending on capital projects. According to IMF Article IV (2017), the public debt to GDP ratio under pressure of external economic shocks, higher borrowing cost, and currency devaluation. Vietnam Vietnam has started transforming since 1986, from a highly agrarian and centrally planned economy to a more industrial and market-based economy. Vietnamese income has risen significantly since “Doimoi-1986”, its GDP growth rate reached 6.8% in 2017 due to the increase in domestic demand, and exports. A large part of the population resides in rural, 40.3% of the labor force are working in agriculture, the unemployment rate was at 2.2% in 2017, a low level in comparing with other countries in ASEAN, only 8% of Vietnam population are below poverty line. Vietnam has a stable political system, a young population, strong FDI inflows, stable currency and relatively low inflation rate. Vietnam government is actively taking part in global economic integration while acknowledging the need for reforming state-owned-enterprises, increasing business transparency, reducing non-performing loans level in the banking sector (The World Factbook, 2018). The total debt of Vietnam had increased significantly reached 62.4% of GDP in 2016 (IMF Article IV, 2017). This rise was reflecting of the previous deficit, easy fiscal stance, and the output gap. Presently, the public debt level in Vietnam has been lower than the maximum level of 65% of GDP that the National . 2)Laos and Vietnam are two of few countries in the world having one-party communist states. These economies began decentralizing control and promoting private enterprise in 1986..
(18) 114 (396). Yokohama Journal of Social Sciences, Vol. 23, No. 3. Assembly has been imposed. Although external public debt and public debt have been under the thresholds which are prescribed by the Vietnamese government, the current government debt level has reached to the level that requires attention since domestic debt has been increasing rapidly. The interest rate for domestic public debt was very high compared with external debt; that issue would lead to higher interest cost. Myanmar According to World Bank, Cambodia and Myanmar have been off the group of low-income countries since 2015 in ASEAN (World Bank, 2017). Myanmar is one of the fastest growing economies in the ASEAN; the GDP growth rate was 7.3% in 2015 and 6.4% in 2016 (The World Bank, 2018). Poverty situation in Myanmar has declined from 44.5% in 2004 to 25.6% in 2016 which was still high in the region. The country needs much support from international organizations and foreign countries to develop infrastructure. In Myanmar, some necessary infrastructure and services remain a challenge to access in both rural and urban areas. Myanmar is one of the world top countries influenced by global climate changing and natural disaster such as floods, cyclones, earthquakes, landslides. Public sector deficit of 2016 increased to 3.2% of GDP from 1.1% in 2015; the government is trying to cut spending and maintain support to priority public services such as education and health. The public debt of Myanmar in the fiscal year 2015-2016 was about 34.1% of GDP, in which domestic debt accounted for 18.1% of GDP and external debt accounted for 16% of GDP (IMF Article IV, 2017). Myanmar government has been undertaking a policy to keep the level of deficit lower than 5% of GDP per year to maintain the debt sustainability. Also, Myanmar government has just adopted Public Debt Law in 2016 to strengthen debt management. Cambodia Cambodia has experienced robust economic growth over the last few decades about 8% on average over the period 2000‒2010, and about 7% since 2011(World Bank, 2017). Cambodia economy growth mainly depends on tourism, garment, construction, and agriculture sectors. Textile exports accounted for 68% of total export in 2017 to the main markets such as the United States and European Union. The economy deeply relies on textile sectors which brings vulnerability for the economy; the current account deficit was about 9% of GDP in 2016. Cambodia is one of the poorest nations in ASEAN; long-term economic developing is facing various challenges such as corruption, limited human resource, large inequality in income, and limited jobs. The unemployment rate is at a low level around 0.3% in 2017, but 16.5% population live below the poverty line (The World Factbook, 2018). Cambodiaʼs transition from the low-income country will reduce the eligibility for international assistance and will challenge the government to find other finance sources for development. Public debt in Cambodia has been at a low level of debt distress risk in recent years. In Cambodia, domestic debt currently remains at a negligible level, just small amount of bonds that were issued in the early 2000s and some administrative claims with no interest. Ministry of Economy and Finance has established one specific department to manage the public debt issue with the level of liabilities and risks. The Cambodian authorities assert that over the medium term, they will maintain the ratio of debt to GDP below 30%. The total external public debt of Cambodia in 2016 was 31.9% of GDP in which 10.3% of GDP was multilateral debt, and 21.7% of GDP was bilateral debt, mainly from China (IMF Article IV, 2017). Cambodia government will.
(19) The Impact of Public Debt on Economic Growth(Tran Thi Phuong). (397) 115. start issuing domestic public debt in 2022 with a small amount and gradually increasing to about 3.7% of GDP in 2035. Philippines The Philippines economy has been through high rate growth period; the average rate is over 6% per year from 2011 to 2017. The country has large proportion remittances from more than 10 million overseas workers and migrants; therefore, the international reserves remain at a comfortable and stable level which creates good conditions for economic development. The Philippines government is expanding spending in infrastructure programs and human capital development, conducting tax reform policies, improving the competitiveness of Filipino products on the world market. Unemployment rate remains at a high level about 5.5% in 2016 and 5.7% in 2017. Population proportion below the poverty line of Philippines was about 21.6% in 2017, more than 60% of the population live in rural area, that is a challenge for the Philippines government to raise rural resident incomes (The World Factbook, 2018). Though the Philippines is a lower-middle-income country of the World Bankʼs group, the public debt of the Philippines was at a moderate level. The efforts of the Philippine government to improve tax administration and expenditure effectiveness have helped to ease its public debt burden and tight fiscal issue, the public debt level was 33.8% of GDP at the end of 2017 which decreased from 68% of GDP in 2003 since the economy developed rapidly and had some primary surpluses (IMF Article IV, 2017). Public debt in percent of GDP has been declining recently, which demonstrates that the government attempted to create the fiscal space for financial priorities. In general, the government debt in the Philippines has been at a sustainable level that would not bring much risk to the economy. Indonesia Indonesia is the largest economy in ASEAN; the economic growth rate has been slowdown since 2012 due to the decrease in exporting commodities. Indonesiaʼs real GDP growth rate was approximately 5% and 5.1% in 2016 and 2017, respectively. Indonesia has a high level of unemployment rate, about 5.6% in 2016 and 2017. Indonesia is still struggling with poverty (population proportion below the poverty line is about 10.9%), inadequate infrastructure, corruption and unequal resource distribution among its provinces (The World Factbook, 2018). Indonesiaʼs annual budget deficit was about 4.3% of GDP in 2017 and the government has lowered its debt to GDP ratio from 100% after the 1999 Asian financial crisis to almost 30% today (The World Factbook, 2018). Total central government debt of Indonesia at the end of 2016 was quite low around 28% of GDP reduced from 87% in 2000 (IMF Article IV). External debt amount has risen rapidly in the past five years. Also, both external debt and public debt were projected to rise slightly but remain at a reasonably low level. Indonesia has undertaken several reforms impressively over the last decade in public debt management by development and publication of debt management strategy and the establishment of Debt Management Office (DMO). This office manages all issues related to public debt in Indonesia and then recommends the necessary policies to control the debt level. Moreover, the Ministry of Finance and Bank Indonesia has promoted closer collaboration to control the official liquidity and loan cost to conduct better debt management..
(20) 116 (398). Yokohama Journal of Social Sciences, Vol. 23, No. 3. Thailand Thailand and Malaysia are only two upper-middle-income economies of ASEAN (World Bank, 2018). Thailandʼs economy depends heavily on exports which accounts for about two-thirds of GDP. With the well-developed infrastructure and pro-investment policies, a free-enterprise economy, Thailand produces electronics, agricultural commodities, processed foods, and automobiles and parts for export. The industry and service sectors produce approximately 90% of GDP, only 10% of GDP produced by the agricultural sector which employs about one-third of the labor force (The World Factbook, 2018). The unemployment rate of Thailand was lowest in ASEAN about 0.8% in 2016 and 0.7% in 2017. Real GDP growth rate of Thailand economy was 3.2% in 2016 and 3.7% in 2017. The budget deficit in 2017 was about -2.5% of GDP, that pushed the public debt level increased. The Thai government has issued the policy to keep the level of public debt under 50% of GDP, which is a stable threshold for the stability of the economy against potential shocks. The downward trend of GDP since the 2000s except for a substantial increase in FY 2009, the lower government revenue caused by a tax cut for fuel, the increased borrowing for water projects, and government guarantee for SOEsʼ loans have pushed up the level of public debt in FY 2016 to reach level of 42.2% of GDP (IMF Article IV, 2017). In general, the external public debt of Thailand has remained at a stable level under medium stress scenarios. The authorities are going to balance the central government budget by 2018 and keep the level of public debt at an average level which is lower than 50% of GDP. A flexible macroeconomic policy of exchange rate and low public debt continue providing favorable conditions for the economic development. Malaysia Malaysia is one of the two upper-middle-income countries in ASEAN (World Bank, 2017). Malaysia started transforming from a producing country of raw materials into a multi-sector emerging economy. Malaysia is now attempting to reach high-income position by 2020 and to promote further the value-added production by attracting more investment in high technology industries and services. Main exported products of Malaysia are electronics, oil, gas, and palm oil. These products also are the strong drivers of Malaysia economy. In 2015, the total amount of exports was approximately 73% of GDP. Real GDP growth rate of Malaysia was 4.2% and 5.4% in 2016 and 2017, respectively. Malaysia government aims to achieve a balanced budget by 2020 given its recent budget deficit was 2.9% in 2017. (The World Factbook, 2018) The government of Malaysia sets up the limitation for federal debt at 55% of GDP. Malaysia has been spending priorities to reduce the level of public debt gradually against the cases of declining revenues and increasing necessary spending. Government gross debt has sharply risen over the past years reflecting the primary deficit and deep falling of oil price. The debt borrowed by the SOEs has increased in recent years and was expected to increase in the medium term. Total public debt of Malaysia was 56.6% of GDP in 2016; it was decreasing in comparing with 57.95% of GDP in 2015 (IMF Article IV, 2017). Most of the public debt in Malaysia was issued in local currency. Singapore Singapore is a high-income economy which depends heavily on exporting electronics, petroleum products, medical and optical equipment, and on its vibrant transportation, financial sectors. Singapore.
(21) The Impact of Public Debt on Economic Growth(Tran Thi Phuong). (399) 117. economy contracted 0.6% in the year 2009 because of the global financial crisis but has continued to grow just years later, 2% in 2016 and 2.5% in 2017. The unemployment rate in Singapore was at a low level, approximately 2.1% in 2016 and 2.2% in 2017. Singapore has not officially had external public debt, and total gross debt has been rising gradually and reached 113% of GDP in the fiscal year 2016 (IMF Article IV, 2017). Even though its public debt level is currently highest among ASEAN countries, the risk of debt unsustainability is quite low, compared to others in ASEAN since the gross government assets are more significant than the total amount of governmental borrowings. The Singapore government issues debt as a tool to promote domestic capital markets and to support investment for mandatory saving programs. Singaporeʼs public debt includes a significant proportion of Special Singapore Government Securities (SSGS) issued to support the Central Provident Fund (CPF). Special issues of SGS are non-tradable bonds issued to meet the investment needs of CPF; the Government fully guarantees these special securities. Singapore government has not borrowed to finance deficit spending since the 1980s according to the Singapore Constitution and the Government Securities Act. Brunei Darussalam Brunei is a small country on the northern coast of Borneo whose economy heavily depends on crude oil and natural gas. Brunei has an excellent infrastructure, good health care system where its citizens pay no personal taxes, enjoy free medical service and education. Brunei Darussalam is one of the countries with the highest income per capita and lowest ratio of public debt in ASEAN. Exporting crude oil and gas accounts for almost 65% of GDP and 95% of the total export amount with Japan as the leading partner. Brunei has a very high level of gross national savings which was 48.8% of GDP in the year of 2017, Bruneiʼs GDP was mostly produced by industry and services sector which account for 56.5% and 42.3% of GDP, respectively (The World Factbook, 2018). Real GDP growth rate was about -1.3% in the year of 2017 and was -2.5% in the year of 2016. Due to high gross national saving and current account balance, public debt in this nation has been quite low, approximately 3.01% of GDP in 2016, a 0.06% rise from 2015, all from the domestic source. Most ASEAN members have implemented policies to maintain public debt at reasonable levels. For example, Vietnam, Thailand, and Laos PDR have limited the ratio of public debt to GDP, and Myanmar has limited budget deficit levels. Public debt structures vary among ASEAN countries. Singapore and Brunei do not issue domestic public debt; Cambodia has only external public debt and no domestic debt; while other countries have both external and domestic public debt. The AECʼs establishment at the end of 2015 means that the public debt management policies of ASEAN members should be consistent and unified. The member countries need to support each other in debt management and ensure that their debt policies will not negatively influence each other. Lower-middle-income nations (Vietnam, Laos, Cambodia, Myanmar, Indonesia, and the Philippines) are developing countries with low current account balance levels, weak gross savings, large public investments in non-financial assets (especially for the VLCM), and high levels of poverty. These factors contribute to the levels of public debt and economic growth of ASEAN members. Singapore and Brunei, high-income nations, have high current account balance levels, a high level of gross savings, and low budget deficits; they need only borrow from domestic sources to promote their domestic capital market. Other factors, such as poverty and the nationʼs economic composition, also affect growth and public debt. If we control for each countryʼs factors, we can compare public debtʼs impacts on economic growth among ASEAN countries..
(22) 118 (400). Yokohama Journal of Social Sciences, Vol. 23, No. 3. The empirical literature on the impact of public debt on growth in ASEAN countries shows that the level of external public debt is an important issue that ASEAN governments should consider. Most of the literature finds a negative link between external public debt and economic growth; some studies show different results. The data (especially on domestic and external debt) and research methods used to analyze the debt issue should be more specific and consistent. The literature is too narrowly focused on external debt, neglecting domestic debt. Further studies are needed on the distinction between domestic and external debt. Empirical studies on all ASEAN members should be conducted to obtain a comprehensive overview of public debt management policies among ASEAN members according to the macroeconomic condition of each country. 4.Conclusion The impact of public debt on economic growth is an important topic that has attracted the attention of many researchers and policymakers. The question of whether public debt is good for an economy remains controversial. Nevertheless, this study offers several findings. First, in the short run, public debt may have a positive impact on economic growth through productive public investments and an expansionary fiscal policy. However, this positive effect occurs only when the government spends its money productively and when the return from public spending is greater than the cost. On the other hand, most of the theoretical literature finds a negative link between high public debt levels and economic growth; the channels are lowered investment, lowered capital accumulation, lowered total factor productivity, and capital flight due to the high risk of default. The non-linear effect of public debt on economic growth is explained by the debt Laffer curve, which combines both the positive and negative effects of public debt on economic growth. The non-linear impact of public debt is examined by many empirical studies using data from both advanced and developing countries. The empirical literature argues that investment and productivity are the two main channels of the non-negative effect. When public debt is low, investors believe that the government is running the country well; they will increase their investment because it will reap benefits. In this mechanism, the positive impact of public debt on economic growth occurs through an increase in investment and productivity. However, when public debt is above a certain threshold, investors fear increased taxation or debt defaults; they will withdraw their investments from high-debt countries, and the reduced investment will lower economic growth. The threshold in the debt Laffer curve at which the effect of public debt on economic growth changes direction differs across data samples. Second, most studies focus on total public debt and external debt while neglecting the impact of domestic public debt on economic growth. Therefore, further research is needed on the impact of different kinds of public debt on economic growth to clarify the link between domestic and external debt and economic growth. Studies on how domestic debt affects economic growth are limited due to the limited availability of data on domestic public debt. Few reports on the domestic debt of ASEAN countries have been published, so researchers have to calculate data on domestic debt levels themselves. When the data become available, it will be possible to aggregate them and conduct empirical research on the impact of domestic public debt on economic growth. Third, the empirical literature that uses data from ASEAN countries indicates that external public debt may hurt growth but does not identify the channels through which this harm will occur. High-income, uppermiddle-income, and lower-middle-income ASEAN nations have different macroeconomic backgrounds and.
(23) The Impact of Public Debt on Economic Growth(Tran Thi Phuong). (401) 119. economic factors, such as per capita income levels, current account balance levels, budget deficits, gross savings, net public investments, poverty levels, and economic components. High-income countries have only domestic public debt, chiefly because they have high current account balances and gross savings. Singapore has the highest ratio of public debt to GDP in the ASEAN, but its debt risk is almost zero. Lower-middleincome countries and upper-middle-income countries have different public debt structures and public debt management policies. Therefore, further empirical studies are necessary in order to obtain a comprehensive view of the ASEANʼs public debt management policies and to assess the precise impacts of public debt on economic growth among ASEAN members. References Patenio, J. A. S., and Tan-Cruz, A. (2007). Economic growth and external debt servicing of the Philippines: 1981‒2005. In 10th National Convention on Statistics (NCS). Agénor, P., and Montiel, P. (1996). Development Macroeconomics. Princeton, N. J.: Princeton University Press. Alesina, A., and Tabellini, G. (1989). External debt, capital flight, and political risk. Journal of International Economics, 27 (3), 199‒220. Azam, M., Emirullah, C., Khan, A. Q., and Prabharker, A. C. (2013). The role of external debt in economic growth of Indonesia‒A Blessing or Burden. World Applied Science Journal, 25 (8), 1150‒1157. Barro, R. J. (1979). On the determination of the public debt. The Journal of Political Economy, 87 (5, 1), 940‒971. Bulow, J. I., and Rogoff, K. S. (1989). Sovereign Debt Repurchases: No Cure for Overhang, 106 (4), 1219‒1235. Calvo, G. A. (1998). Growth, debt, and economic transformation: The capital flight problem. In F. Coricelli, M. Di Matteo and F. Hahn (eds.), New Theories in Growth and Development (pp. 251‒269). New York: Palgrave Macmillan. Cecchetti, Stephen G., and Mohanty, Madhusudan S. and Zampolli, Fabrizio (2011). The Real Effects of Debt. BIS Working Paper No. 352. Available at SSRN: https://ssrn.com/abstract=1946170 Checherita-Westphal, C., and Rother, P. (2012). The impact of high government debt on economic growth and its channels: An empirical investigation for the euro area. European Economic Review, 56 (7), 1392‒1405. Clements, B. J., Bhattacharya, R., and Nguyen, T. Q. (2003). External debt, public investment, and growth in lowincome countries. IMF Working Paper, 1‒25. Cohen, D. (1991). Private Lending to Sovereign States: A Theoretical Autopsy. MIT Press Cohen, D. (1992). The debt crisis: A Postmortem. NBER Macroeconomics Annual 1992, Volume 7 (pp. 65‒114), MIT Press. Cohen, D., and Sachs, J. (1986). Growth and external debt under risk of debt repudiation. European Economic Review, 30 (3), 529‒560. Corden, W. M. (1989). Debt relief and adjustment incentives. Analytical Issues in Debt. IMF, Washington, 34 (4), 242‒257. Dreger, C., and Reimers, H. (2013). Does euro area membership affect the relation between GDP growth and public debt? Journal of Macroeconomics, 38, 481‒486. Eaton, J. (1993). Sovereign debt: A primer. The World Bank Economic Review, 7 (2), 137‒172. Elmendorf, D. W., and Mankiw, N. G. (1999). Government debt. Handbook of Macroeconomics, 1, 1615‒1669. Feenstra, Robert C., Robert Inklaar and Marcel P. Timmer (2013), “The Next Generation of the Penn World Table” available for download at www.ggdc.net/pwt Factbook, C. I. A. (2017). The world factbook. See also: https://www. cia.gov/library/publications/the-world-factbook. Gill, I. S., and Pinto, B. (2005). Public debt in developing countries: Has the market-based model worked? World Bank Policy Research Working Paper, (3674). Ha, Dao and Oanh, Do. (2017). External Debt and Economic Growth in Vietnam: A Nonlinear Relationship. ChinaUSA Business Review, 16. International Monetary Fund. (2017). Indonesia: Staff report for the 2016 Article IV Consultation. INTERNATIONAL.
図


+3


関連したドキュメント
An easy-to-use procedure is presented for improving the ε-constraint method for computing the efficient frontier of the portfolio selection problem endowed with additional cardinality
The inclusion of the cell shedding mechanism leads to modification of the boundary conditions employed in the model of Ward and King (199910) and it will be
It is suggested by our method that most of the quadratic algebras for all St¨ ackel equivalence classes of 3D second order quantum superintegrable systems on conformally flat
Keywords: continuous time random walk, Brownian motion, collision time, skew Young tableaux, tandem queue.. AMS 2000 Subject Classification: Primary:
Answering a question of de la Harpe and Bridson in the Kourovka Notebook, we build the explicit embeddings of the additive group of rational numbers Q in a finitely generated group
Then it follows immediately from a suitable version of “Hensel’s Lemma” [cf., e.g., the argument of [4], Lemma 2.1] that S may be obtained, as the notation suggests, as the m A
In our previous paper [Ban1], we explicitly calculated the p-adic polylogarithm sheaf on the projective line minus three points, and calculated its specializa- tions to the d-th
Definition An embeddable tiled surface is a tiled surface which is actually achieved as the graph of singular leaves of some embedded orientable surface with closed braid
