Investigating the Impacts of Customer
Experience and Attribute Performances on
Overall Ratings using Online Review Data:
Nonlinear Estimation and Visualization with a
Neural Network
著者
Sato Toshikuni
journal or
publication title
DSSR Discussion Papers
number
105
page range
1-45
year
2019-11
URL
http://hdl.handle.net/10097/00126435
Data Science and Service Research
Discussion Paper
Discussion Paper No. 105
Investigating the Impacts of Customer Experience
and Attribute Performances on Overall Ratings
using Online Review Data: Nonlinear Estimation
and Visualization with a Neural Network
Toshikuni Sato
November, 2019
Center for Data Science and Service Research Graduate School of Economic and Management Tohoku University 27-1 Kawauchi, Aobaku
Investigating the Impacts of Customer Experience and Attribute
Performances on Overall Ratings using Online Review Data: Nonlinear
Estimation and Visualization with a Neural Network
Toshikuni Sato†
†Graduate School of Economics and Management, Tohoku University
Abstract
This study investigates interpretable neural networks for marketing and consumer behavior research using customer reviews instead of measurement scales to better understand customer experiences. Service attribute ratings are used to measure attribute performances to compare the influence of customer experience and service performance on overall satisfaction. Although many researchers have investigated word-of-mouth reviews and their practical applications, the detailed contents of those reviews were generally disregarded, possibly because of their high dimensionality. To solve this problem, this study proposes some useful neural-network methods for specifying the expected assumptions based on previous knowledge or theories in consumer behavior research. Because neural networks help estimate nonlinear relationships between objective and predictive variables, a partial dependence plot is used to visualize the estimated functions and marginal effects. Empirical results not only provide a highly accurate neural-network model, they also create better marketing implications.
Keywords: Customer experience, Customer review, Neural networks, Interpretable machine learning, Nonlinear measurement model
1. Introduction
Customer experience, as proposed by Schmitt (1990), has been applied to a wide range of marketing areas, from retail marketing to service design and customer journey (Verhoef et al. 2009; Grewal 2009; Teixeira et al. 2012; Lemon & Verhoef 2016). Experiential marketing aims to provide the desired experience for customers via goods or services based on SEMs (strategic experiential modules), which are constructed around the five aspects of sense, feel, think, relate, and act (Schmitt 1999, p.60-63). To create a better marketing experience, Schmitt (1990) explained the importance of utilizing ExPros (experience providers) that included variables of communications, visual and verbal identity and
signage, product presence, co-branding, spatial environments, electronic media, and people.
Measurement scales have been developed by several researchers (Bustamante & Rubio 2017; Pelleiter & Collier 2018; Bleier et al. 2019; Nikhashemi et al. 2019) to evaluate customer experience. Although measurement scales are useful to understanding customer experience, this study focuses on online reviews obtained from websites and social network services, such as Amazon, Trip Adviser, Facebook, and Twitter.
Word-of-mouth (WOM) marketing is a powerful and important tool for diffusing information about new products, sales, and marketing campaigns (Trusov et al. 2009, Kozinets et al. 2010). However, online customer reviews (OCR) contain information related to customer experience when they consume products and receive services (Chen & Xie 2008). To utilize this kind of free-form textual information, several topic models based on latent dirichlet allocation (LDA) have been proposed for marketing areas (Tirunillai & Tellis 2014, Büschken & Allenby 2016). Deep-learning neural networks for natural language process are also popular (Collobert et al. 2010). Most studies for review data have focused on the relationships among words and terms, such that they adapt morphological analyses to divide text into effective words. They then convert text into high dimensional word data, and machine-learning methods are often used to analyze them. In contrast, many machine-learning methods have performed complicated model estimations known as “black box” (Larasati et al. 2011). It is important to obtain reasonable interpretations from these techniques in social science.
The purpose of this study is to utilize the advantages of machine learning for online review data and to discuss the marketing interpretations of the results. We develop a marketing model for forecasting overall satisfaction using the Rakuten travel dataset (Rakuten, Inc. 2016). For predictors, words in text and attribute ratings are used to measure customer experience and attribute performance, respectively. Additionally, the proposed model adopts the interaction of words, because they represent customer experiences, including perceptions and feelings during travel. It is also important to specify the nonlinear relationship between attribute performance and overall satisfaction (Finn 2011, Falk et al. 2010, Lin et
al. 2010, Cheung & Lee 2009, Gómez et al. 2004, Matzler et al. 2004, Anderson & Mittal 2000, Mittal et al. 1998, Brandt 1988).
2. Related Literature
This section reviews two marketing research areas to introduce the role of customer experience in marketing and consumer behavior. The first area includes customer experience studies, which conduct developing measurement scales and testing consumer behavior models. The second area includes online review studies that adopt review data for marketing models.
2.1. Measurement Scales and Models for Customer Experience
Many researchers have measured customer experiences and have investigated its impact on consumer behaviors. Table 1 summarizes representative studies in several areas, where researchers conceptualized customer experience in various unique scopes. Those studies commonly focus on customer feelings, emotions, perceptions, or mental states during their experiences.
Novak et al. (2000) discussed online experiences before Scimitt (1999) conceptualized experiential marketing. Subsequently, the other researchers developed measurement scales based on experience types. To define brand experiences, Brakus et al. (2009) extended three basic experience types: product, shopping and service, and consumption (Hoch 2002, Hui & Bateson 1991, Krein et al. 1992, Holbrook
& Hirschman 1982). For measurements, they defined brand experiences as subjective, internal consumer responses, and behavioral responses. Although they specified four constructs (i.e., sensory, affective, behavioral, and intellectual), Bustamante and Rubio (2017) improved the work of Brakus et al. (2009) by measuring social constructs.
Table 1: Customer experience studies
Author (year) Type of CX Constructs
Novak et al. (2000) Online Experience
Flow, Arousal, Challenge, Control, Focused Attention, Interactivity, Speed, Involvement, Importance, Skill, Telepresence, Time Distortion
Brakus et al. (2009) Brand Experience Sensory, Affective, Behavioral, Intellectual
Klaus & Maklan (2012; 2013) Service Experience Product experience, Outcome focus, Moments-of-truth, Peace-of-mind
Khan & Rahman (2016) Retail Brand Experience
Brand name influence, Customer billing, order & application forms, Mass media impression, Point-of-sales assistance, Recommendation by a salesperson, Emotional event experience, Brand stories connectedness
Bustamante & Rubio (2017) In-Store Customer Experience
Cognitive, Affective, Physical, Interaction with customers, Interaction with employees, Social
Pelletier & Collier (2018) Experiential
Purchases Fun, Escapism, Servicescape quality, Social congruence, Uniqueness
For consumer behavior models, many researchers have investigated the relationship between customer experience and satisfaction and loyalty, proposing two different approaches (Bustamante & Rubio 2017). Klaus and Mklan (2012; 2013) examined service experience quality using a formative model and estimated indirect effects of sub-experiential dimensions on satisfaction. Brakus et al. (2009) and Khan and Rahman (2016) assumed direct effect of an essential component of sub-experiential dimensions using a reflective model. Although these methods differed, both approaches leveraged customer experience to derive satisfaction directly or indirectly.
In addition to service experience quality, Klaus and Mklan (2012; 2013) explained the differences of perceived service quality as an overall judgment for excellence or superiority (Parasuraman et al. 1988). They defined customer experience as “a customer’s cognitive and affective assessment of all direct and indirect encounters with a firm relating to their purchasing behavior, triggering an experiential quality” (Klaus & Mklan 2013, p.228; Klaus & Mklan 2012, p.10). Hence, measuring service experience and quality should be distinguished from the measurement scales of perceived service quality (Parasuraman et al. 1985; 1988, Cronin & Tayler 1982) or customers’ evaluation of specific services.
Following Klaus and Mklan (2012; 2013), we specify that customer experience and quality are different measurements from attribute ratings, and they are predictors of overall satisfaction. Additionally, the attribute rating score is used to measure attribute performance, and it is an essential factor of overall satisfaction (Arbore & Busacca 2009, Matzler et al. 2004, Mittal & Kamakura 2001, Mittal et al. 1998, Brandt 1988). Hence, we assume that customer experience can be measured from review texts as cognitive and affective statements of customer experiences, and that attribute ratings for specific services take the place of attribute performances. Figure 1 shows the proposed conceptualized model.
Customer Experience/Quality (Words in Review Text)
Attribute Performance (Attribute Ratings)
Overall Rating
2.2. Measurements of Online Reviews
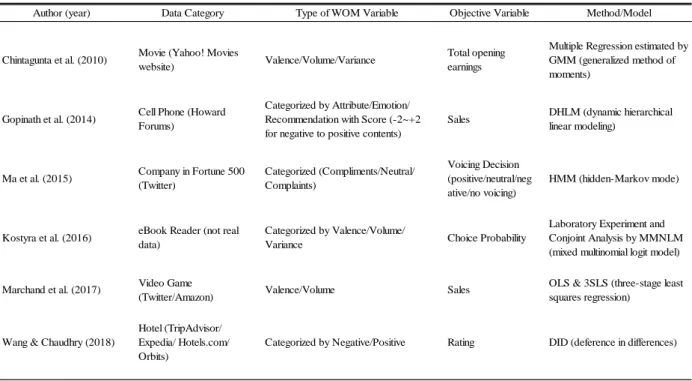
Table 2 summarizes several studies that investigated the influence of online reviews as marketing variables. Three variables of valance, volume, and variance were used to adopt online review data for marketing models (Kostyra et al. 2016, p.12-13). Chintagunta et al. (2010) investigated the impact of online user reviews on box-office performance using valance, volume, and variance as averages, numbers, and variances, respectively, for movie ratings. They found significant effects of valence; however, they also indicated that volume and variance were not effective predictors. Marchand et al. (2016) measured valence and volume from Twitter WOMs as a microblog and Amazon reviews as an OCR website for video games. They found that OCRs had long-term effects on sales, whereas microblog WOMs were effective during pre-release periods.
Table 2: WOM and OCR studies
Author (year) Data Category Type of WOM Variable Objective Variable Method/Model
Chintagunta et al. (2010) Movie (Yahoo! Movies
website) Valence/Volume/Variance
Total opening earnings
Multiple Regression estimated by GMM (generalized method of moments)
Gopinath et al. (2014) Cell Phone (Howard Forums)
Categorized by Attribute/Emotion/ Recommendation with Score (-2~+2 for negative to positive contents)
Sales DHLM (dynamic hierarchical linear modeling)
Ma et al. (2015) Company in Fortune 500 (Twitter) Categorized (Compliments/Neutral/ Complaints) Voicing Decision (positive/neutral/neg ative/no voicing) HMM (hidden-Markov mode)
Kostyra et al. (2016) eBook Reader (not real data)
Categorized by Valence/Volume/
Variance Choice Probability
Laboratory Experiment and Conjoint Analysis by MMNLM (mixed multinomial logit model)
Marchand et al. (2017) Video Game
(Twitter/Amazon) Valence/Volume Sales
OLS & 3SLS (three-stage least squares regression)
Wang & Chaudhry (2018)
Hotel (TripAdvisor/ Expedia/ Hotels.com/ Orbits)
Categorized by Negative/Positive Rating DID (deference in differences)
Some studies measured online reviews as a categorical variable. Ma et al. (2014) and Wang and Chaudhry (2018) labeled WOMs as positive, negative, or neutral, based on the rating (e.g., less than 4-star = negative) or WOM contents. They investigated the influence of manager responses (MR), defined
as the act of managers publicity replying to online reviews (Wang & Chaudhry 2018, p.163). Ma et al. (2014) indicated that MRs sometimes created negative effects. Additionally, Wang and Chaudhry (2018) recommended managing negative reviews rather than positive ones, because they found that MRs to positive reviews had negative impacts on later ratings. Kostyra et al. (2016), on the other hand, performed a conjoint experiment to analyze choice probability for eBook readers using categorized averages of ratings (valence), number of reviews (volume), and variance of ratings (variance). Their results indicated that valence and volume had positive effects on the choice probability and willingness-to-pay. Additionally, large level variance had a negative effect. They also found the OCRs decreased the effect of product attributes (e.g., brand, price, and technical features) by comparing two groups: review-provided and other.
Apart from the three measurements and categorizing methods, Gopinath et al. (2014) introduced scoring for WOM contents. They graded WOMs on a scale of −2 to 2 points, based on three aspects:
attribute, emotion, and recommendation, following the texts. They found significant effects of these
predictors with cell-phone sales. Their results also indicated the importance of paying attention to contents and not just focusing on WOM volume.
2.3. Customer Experience and Online Review Measures
We reviewed the methods of treating online reviews as marketing variables in a previous section, finding three issues in the preset methods. First, volume and variance were not effective in some cases (Chintagunta et al. 2010). Second, many researchers did not consider the detailed contents of online reviews (Gopinath et al. 2014), although, some researchers categorized texts by positive and negative content (Ma et. 2014; Wang & Chaudhry 2018). Third, there were no exact methods used to judge the text contents and words. It is sometimes inconvenient to check all words without using effective guidelines. However, many researchers showed interest in the impact of online reviews and developing better methods to measure them.
In contrast, our research measures customer experience using online reviews. On the other hand, perceived attribute performance is measured using attribute ratings, assuming that the text information in online reviews and their ratings represent a different construct. One possible problem is that the WOM behaviors are driven by customer satisfaction (Klaus & Maklan 2012; 2013). However, the customer describes an event at a point in time when perceptions of their experiences are fresh. Concretely, we prepare two example reviews, as follows:
i. “I was very satisfied, because the dinner was delicious, and I also like the buffet breakfast. Additionally, the staff was very kind to me.”
ii. “Bad services” (lowest rating).
These reviews mainly indicate descriptions of experiences, sometimes including a reason. Izogo and Jayawardhena (2018) investigated Facebook WOMs using Netnography, a qualitative research methodology, to study cultures and communities emerging through computer-mediated communications (Kozinets 2002). They indicated that several constructs related to customer experience could be conjectured from WOM sentence expressions. Therefore, we use word information directly from reviews to measure customer experience. Although Sridhar and Srinivasan (2012) adapted a similar method and model as our concept, our study investigates the effects of word frequency on overall ratings and compares them with the effects of each attribute rating.
3. Methods and Model
3.1. Basic ProcedureOur research procedure is as follows:
i. Make a frequent-term text matrix based on morphological analysis. ii. Compare several neural-network models.
We first adapt morphological analysis to divide text samples into words and count the frequencies of each. Second, we propose interpretable neural-network models and compare their accuracy using training and testing datasets. Finally, we use a partial dependence plot (PDP) (Hastie et al. 2009) to investigate marginal effects and to discuss marketing implications.
3.2. Neural Network as Mental Processing
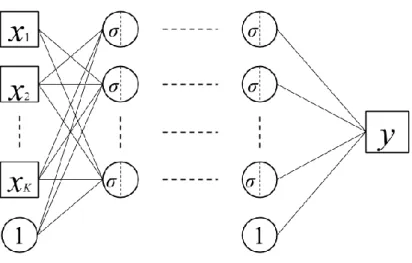
This section introduces the basic feed-forward neural-network model and its use as a measurement model for mental processing. Figure 2 indicates the neural network as a regression model.
Figure 2: Feed-forward neural-network model
Let 𝑙 = 1, … , 𝐿 represent the number of layers. The top layer (𝑙 = 𝐿) in the network is express as
1 ;
L l Li i i
y
f
x
β z
c
, (1) where 𝑖 is the discrete individual, 𝑦𝑖 is the objective variable (output), 𝛃(𝐿) is the vector ofregression coefficients (weight parameters), z𝑖 is the vector of latent variables, and 𝑐(𝐿) is the constant
term (bias parameter). 𝛃(𝐿) and z 𝑖
(𝐿−1) are thus given by
1 , 2 , 3 , , L L L L L p
β , (2)
1 1 1 1 1 1 2 3 1 1 1 1 1 2 3,
,
,
,
,
,
,
,
,
L L L L L i p i L L L L p iz
z
z
z
g u
g u
g u
g u
z
(3)where g is an activation function (e.g., sigmoid), and 𝑢𝑗(𝑙−1) (𝑗 = 1, … , 𝑝) is given by
1 1 1 1 1 2 1 ,1 1 ,2 1 ,3 1 , 1 1 1 1 1 1 1 2 2 2 ,1 2 ,2 2 ,3 2 , 2 1 1 1 1 1 2 3 3 ,1 3 ,2 3 ,3 3 , 3 1 1 1 1 1 , ,1 ,2 ,3 L L L L L L q L L L L L L q L L L L L L q L L L L L L p q p q p p p i b b b b u z u b b b b z u b b b b z u b b b b z 1 1 1 2 1 3 2 1 . L L L L p i c c c c (4)
Hence, 𝑢𝑗(𝐿−1) is a latent variable (unit) formed by former latent variables transformed using the
activation function. Rewriting Eq. (4), we obtain a simple expression,
1 1 2 1
.
L L L L
i i
U B z c (5)
In the lowest latent layer (𝑙 = 0), similarly, we obtain the following equations,
1 1 1 1 1 0 1 1 ,1 1 ,2 1 ,3 1 , 1 1 1 1 1 1 1 1 0 1 2 2 ,1 2 ,2 2 ,3 2 , 2 2 1 1 1 1 1 0 1 3 3 ,1 3 ,2 3 ,3 3 , 3 3 1 0 1 1 1 1 1 , ,1 ,2 ,3 q q q p q p p q p p p i i b b b b u x c u b b b b x c u b b b b x c u b b b b x c . (6) Then, 1 1 0 1 . i i U B x c (7)
where 𝒙𝑖 is a vector of observable predictors (inputs). Eq. (7) indicates a formative model specification.
Therefore, the neural network can be regarded as a type of measurement model in consumer behavior research if we predict some assessments or scores for the psychological constructs of related predictors.
3.3. Skip-Layer Neural Network
Several related networks are used for machine leaning. Skip-layer networks (SLNet) and residual learning networks (ResNet) are modeled as follows:
1, 1
(2) Fully connected network (1) Skip-Layer
; ; ,
i i i
f x
x β NN x
(8)
(1) Make residual between (2) Fully connected network input and output
;
;
,
i i i
f
x
x
I
NN
x
(9)where 𝐈 is a vector whose elements are all ones. ResNet (Eq. 9) is a helpful network used for learning deep neural networks (He et al. 2016). The network of the second term learns the residuals between the objective and predictive variables (𝑦𝑖 − 𝒙𝑖𝐈). The important difference of these two models and the
next three semiparametric models is that the second term contains all predictors. Hence, these two models offer more complicated interpretations.
3.4. Semiparametric Neural Network
The essential problem of neural networks is their interpretability. Generally, network parameters cannot be identified, although the neural network provides better functional approximations. This is known as weight–space symmetry (Bishop 2006), indicating that it is nearly impossible to find unique solutions for parameters. However, Crane–Droesch (2017; 2018) focused on the approximation properties of feed-forward networks and proposed a semiparametric neural network. Let 𝑓 be a regression function; let 𝑁𝑁 be a function specified by a fully connected network containing latent variables; let 𝒙𝑖 be the
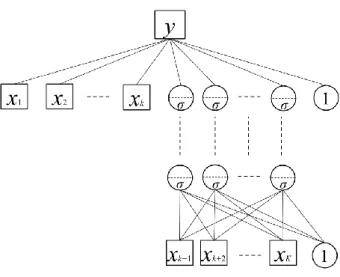
predictor (input) matrix; and let 𝜽 be all parameters containing constant terms and regression coefficients. Crane–Droesch (2017; 2018)’s model (Figure 3) is thus given by
1
1, 1 2, 2
(1) Specified with (2) Fully connected linear parameters network except X
;
;
i i i
f
x
x
β
NN
x
,(10)
where 𝒙1,𝑖 and 𝒙2,𝑖 are sub-vectors of 𝒙𝑖, and 𝛃1 and 𝜽2 = 𝜽 ∖ 𝛃1 are parameters corresponding
to 𝒙1,𝑖 and 𝒙2.𝑖 , respectively. This is similar specification using a partially linear regression model
(Robinson 1988); hence, we call this model as partially linear network (PLNet). Crane–Droesch (2017) investigated the estimates for 𝛃1 using a Monte Carlo simulation, showing its unbiasedness and consistency. Note that the linear part does not contain an intercept, because it cannot be identified separately from the nonlinear function, 𝑁𝑁 , similar to the partially linear model (Klemelä 2014).
Additionally, Crane–Droesch (2017; 2018) adopted this model for panel data analysis and indicated its better prediction compared with ordinal fixed effect models, lasso regression, random forest, and fully connected neural networks.
Figure 3: PLNet
In our research, we extend PLNet to a nonlinearity of part or all of 𝒙1,𝑖 and propose an additive model learning network (AMNet) (Figure 4), as follows:
2
, , , 1;
,
,
,
;
K M i d d d i d i d i d df
NN
x
x
x
x
, (11)where 𝑑 = 1, ⋯ , 𝐾 represents the number of predictors; 𝑚 = 1, ⋯ , 𝑀 is the degree of the polynomial; and 𝑁𝑁𝑑 is an independent network of predictor 𝑑. This model learns the independent
networks constructed by a single predictor with polynomial transformation and approximates the objective variable using the sum of the independent nonlinear faction, 𝑁𝑁𝑑. Thus, AMNet is a kind of
additive model (Hastie & Tibshirani 1986). In practice, it is possible to combine AMNet, PLNet, and fully connected networks using independent predictors. Similar to the additive model, only one 𝑁𝑁𝑑
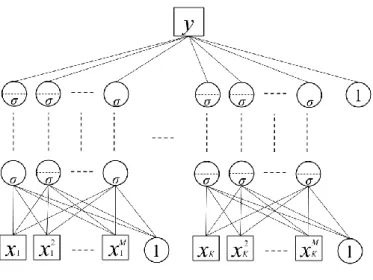
Figure 4: AMNet
If we know the relationship of some predictors from existing knowledge or theories, AMNet can be extended as follows:
1, 2, ,
1;
,
,
,
;
g G g g g i g g i i k i g gf
NN
x
x
x
x
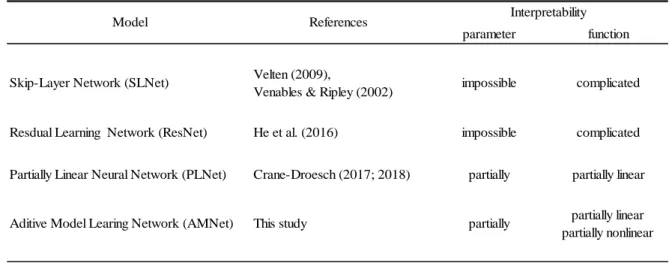
, (12)where 𝑔 = 1, … , 𝐺 is the number of independent predictor groups. For our setting, the review texts and attribute ratings represent a different construct. Thus, this model learns two networks constructed separately of words and rating scores (see Figure 5). This becomes a grouped AMNet (G-AMNet). Finally, Table 3 summarizes those models and their interpretability.
Table 3: Neural Networks and Interpretability
parameter function
Skip-Layer Network (SLNet) Velten (2009),
Venables & Ripley (2002) impossible complicated
Resdual Learning Network (ResNet) He et al. (2016) impossible complicated
Partially Linear Neural Network (PLNet) Crane-Droesch (2017; 2018) partially partially linear
Aditive Model Learing Network (AMNet) This study partially partially linear partially nonlinear
Model References Interpretability
3.5. Partial Dependence Function and Marginal Effect
The previous section introduced a few interpretable neural networks. However, it is still necessary to investigate the complicated multivariate function or fully connected network in cases such as G-AMNet. Estimating a partial dependence function is useful to solving this problem. The partial dependence function and PDP have been discussed to visualize the results given by some machine-learning methods (e.g., decision trees, random forests, and boosted regression) (Becker et al. 1996; Friedman 2001; Hasite et al. 2009; Greenwell 2017). Klemalä (2014) also discussed PDP in line with nonparametric regressions (Klemalä 2014, p.298-299).
Let 𝒙 = (𝑥1, ⋯ , 𝑥𝑑) represent the predictors of a regression model whose prediction is 𝑓(𝒙). If
we divide 𝒙 into an interest set, 𝑧𝑆, and its compliment, 𝑧𝐶 = 𝒙 ∖ 𝑧𝑆, then the “partial dependence” of
the response on 𝑧𝑆 is defined as
,
,
,C
S S S C S C C C
f z E f z z
f z z p z dz (13) where 𝑝𝐶(𝑧𝐶) is the marginal probability of 𝑧𝐶: 𝑝𝐶(𝑧𝐶) = ∫ 𝑝(𝐱) 𝑑𝑧𝑆. Eq. (14) can be estimated froma set training data by
,
11
ˆ
nˆ
,
,
S S S i C if
z
f z z
n
(14)where 𝑧𝑖,𝐶 (𝑖 = 1,2, … , 𝑛) are the values of 𝑧𝐶 occurring in the training sample. Thus, it averages over the effects of all the other predictors in the model.
To estimate the marginal effect, let 𝑧𝑖,𝑧 (𝑖 = 1,2, … , 𝑛) denote the estimates ordered points at which the regression function is evaluated. Applying a finite-difference estimate of the derivative to 𝑓̂𝑆(𝑧𝑆), we obtain
,
,
1,
, , 1, ˆ ˆ ˆ . S i S S i S S i S i S i S i S df z f z f z dz z z (15)Because it is inconvenient to calculate the derivative from the neural network, we simply estimate the marginal effect from the above equation, like in cases of some nonparametric regressions (Cameron & Trivedi 2005). The partial dependence function indicates an averaged 𝑓(𝒙) with respect to 𝑧𝐶 at any data points of 𝑧𝑆 . Thus, Eq. (15) indicates an averaged change of 𝑓(𝒙) when 𝑧𝑆 is changed. For example, assuming a simple linear regression, 𝑓(𝒙) = 𝑎 + 𝑏1𝑥1+ 𝑏2𝑥2+ ⋯ + 𝑏𝑑𝑥𝑑 , we obtain
𝑓𝑠(𝒙) = 𝑎 + 𝑏𝑑𝑥𝑑 and 𝑑𝑓𝑠(𝒙) 𝑑𝑥⁄ 𝑑= 𝑏𝑑 for 𝑧𝑆= 𝑥𝑑. In this case, the marginal effect of Eq. (15) is
the same as the analytical solution. Assuming 𝑓(𝒙) = 𝑎 + 𝑔1(𝑥1) + 𝑔2(𝑥2) + ⋯ + 𝑔2(𝑥2), which is a
simple expression of AMNet, we obtain 𝑓𝑠(𝒙) = 𝑎 + 𝑔𝑑(𝑥𝑑) for 𝑧𝑆= 𝑥𝑑, and the marginal effect can
be calculated with Eq. (15). Hence, PLNet and AMNet provide a more amenable interpretation compared to the fully connected network.
4. Empirical Applications
4.1. Data DescriptionThe data were provided by Rakuten, Inc. and contains customer reviews and ratings about accommodations in Japan, posted from January 1997 to November 2015 (Rakuten, Inc. 2016). We randomly selected 100,000 samples from the latest 2015 data, because the total sample (over 5 million) was too large. Additionally, we deleted samples missing values and lacking reviews. We finally used 80,000 samples for training data, and the remaining 16,761 were used for test data.
In morphological analysis, we selected the words based on parts-of-speech tags and truncating words whose total frequency was less than 100 to remove unusual words. Outliers (e.g., “am,” “is,” “are,” “do,” or “does”) were also deleted. As a result, a total of 684 words were gathered, including 112 adjectives, 113 adverbs, and 459 verbs. Their frequencies were used to measure customer experience.
For attribute performance, the six variables of attribute rating scores (5 scales) were Location, Room,
Meal, Bathroom (or Hot spring), Service, and Facility and Amenity (F&A). However, Meal, Bathroom,
and F&A scales contain 0 for the guests who did not use those services or for hotels not providing such services. We then make dummy variables (e.g., no_Meal, no_Bathroom, and no_F&A) that take 1 when the ratings of Meal, bathroom, or F&A take 0, respectively. Additionally, because of these dummy variables, Meal, Bathroom, and F&A contain a coefficient dummy variable that takes 1 when no_Meal,
no_Bathroom, and no_F&A are 0, respectively, and take 1 otherwise.
For the other predictors, purpose (Business, Leisure, and other) and companion (Alone, Family,
Colleague, Couple, and other) dummy variables are available. Additionally, we extracted the room type
from room names in the dataset and created a Japanese-styled room dummy variable (J_room), which takes 1 for Japanese-styled rooms. Similarly, month dummies were created using character strings of
posted dates in the dataset. Table 4 displays our arranged dataset.
Table 4: Dataset arrangement
Word1 Word2 ・・・ Word684 Location Room Meal Bathroom Service A & F Business Leisure
User1 0 0 0 4 3 0 3 3 3 0 1 User2 1 0 0 4 3 3 2 3 3 1 0 User3 0 2 0 4 5 4 4 5 4 0 1 User4 0 0 0 5 4 5 4 4 4 0 1 ・・・ User5 0 1 0 5 3 0 3 3 3 0 0 User6 0 0 1 5 4 5 4 5 5 0 1 ・ ・ ・ ・ ・ ・ ・ ・ ・ ・ ・ ・ ・ ・ ・ ・ ・ ・ ・ ・ ・ ・ ・ ・ ・ ・ ・ ・ ・ ・ ・ ・ ・ ・ ・ ・
Alone Family Colleague Friend Couple no_Meal no_Bath no_A & F J_room Jan Feb ・・・ Oct Overall(Y)
0 0 0 0 1 1 0 0 1 1 0 0 4 1 0 0 0 0 0 0 0 0 0 0 0 3 ・・・ 0 0 0 1 0 0 0 0 1 0 1 0 4 0 1 0 0 0 0 0 0 0 0 0 0 5 1 0 0 0 0 1 0 0 0 0 0 0 4 1 0 0 0 0 0 0 0 0 0 0 0 5 ・ ・ ・ ・ ・ ・ ・ ・ ・ ・ ・ ・ ・ ・ ・ ・ ・ ・ ・ ・ ・ ・ ・ ・ ・ ・ ・ ・ ・ ・ ・ ・ ・ ・ ・ ・ ・ ・ ・
4.2. Comparative Models and Optimization
We compared the following five models using ordinal linear regression without the words.
684,
6,
21
,
FCNet
f
NN Words
Attribtes
DummyVariables
(16)
684
6 1 21 2,
PLNet
f
NN Words
Attributes
β
DummyVariables
β
(17)
684 6 2 9 1 ,1 1 ,2 1 ,9 1 21 2,
P PLNet k k k k k k kf
NN Words
Attribute
Atribute
Attribute
DummyVariables
β
(18)
0 684 6 2 7 1 21 2,
,
,
I AMNet k k k k kf
NN
Words
NN
Attriubte
Attribute
Attribute
DummyVariables
β
(19)
0 684 1 6 21 2.
G AMNetf
NN
Words
NN
Attributes
DummyVariables
β
(20)
0 1 6 21 2.
G AMNetf
NN
Attributes
DummyVariables
β
(21)For simplicity, we note purpose, companion, no meal, no bathroom, no F&A, J_room, and month as dummy variables in the above models. FCNet is a standard feed-forward network, and PLNet sets linear parameters for attribute ratings and dummy variables. P-PLNet contains ninth-degree polynomial terms for each attribute rating, whereas the independent AMNet (I-AMNet) has six networks constructed by seventh-degree polynomial variables for each attribute rating with the word network. Grouped AMNet (G-AMNet) specifies the two networks as customer experience and attribute performance, constructed with words and attribute ratings, respectively. G-AMNet0 is set without the word network to check the importance of words as predictors.
The neural network optimization method uses Adam (Kingma & Ba 2015), and all of the necessary pre-parameter settings follow the default values from the original paper (see Appendix II for a detailed algorithm). This method achieves faster convergence of optimization by adjusting the learning rate with the first and second moments of the gradients. To tune the units, we changed their number from 1 to 10,
and from 10 to 100 by 10s. Then, we chose the unit number for minimum mean squared error (MSE), comparing the MSEs of training and test datasets among the different numbers of units. After unit tuning, we added the latent layer and tuned the unit again. We repeated this process until the MSE stopped improving. Using PLNet, we fixed the units and layers of the word network for the other models. We changed the degree of the polynomial for each attribute rating from 2 to 15 jointly and compared the MSEs. Although each predictor was normalized by dividing each maximum value for efficient learning, we reported the results based on non-normalized parameter estimates. Table 11 in Appendix I summarizes the details of each final network.
4.3. Model and Coefficient Comparison
Table 5 reports the training and test MSEs for each model, showing that G-AMNet achieves the lowest MSE, although, FCNet also shows better prediction when training MSE. Additionally, I-AMNet shows a slightly better prediction capability than P-AMNet.
Table 6 reports the estimates of linear parameters in each model. Note that the blanks in Table 6 indicate the parameter that cannot be identified from the nonlinear part. However, there is a large difference in the estimates for the coefficients of “companion” (i.e., alone, family, colleague, couple). Therefore, we investigate the estimates of G-AMNet to check validity. We repeated the estimation 50 times using different initial values generated from the standard normal distribution and evaluated the series of estimates via mean and standard deviation. The results of the validation for G-AMNet are shown in the G-AMNet (V) column of each Table. From Table 5, G-AMNet provides stable forecasting; however, we found that the estimates for the coefficients of companion depend on the initial values in Table 6.
Table 5: MSE
Model LR FCNet PLNet P-PLNet I-AMNet G-AMNet0 G-AMNet
Training 0.24730 0.20327 0.22452 0.21942 0.21579 0.21451 0.20321 0.20188 (0.001)
Test 0.24367 0.22260 0.22794 0.22063 0.21785 0.21136 0.20704 0.20655 (0.001)
G-AMNet (V)
Table 6: Coefficient Estimates
PLNet P-PLNet I-AMNet G-AMNet0 G-AMNet
Intersept -0.166 (0.023) *** Location 0.116 0.586 (0.012) *** Room 0.256 1.418 (0.012) *** Meal 0.139 0.775 (0.012) *** Bathroom 0.087 0.445 (0.011) *** Service 0.269 1.635 (0.013) *** F & A 0.095 0.445 (0.014) *** Business 0.014 -0.002 -0.003 0.001 -0.004 0.003 (0.005) 0.022 (0.009) ** Leisure 0.024 0.011 0.010 0.006 0.004 0.011 (0.005) 0.016 (0.008) * Alone -0.160 0.066 -0.006 0.117 0.162 0.020 (0.125) 0.045 (0.020) * Family -0.177 0.054 -0.016 0.099 0.145 0.004 (0.124) 0.012 (0.020) Colleague -0.156 0.078 0.006 0.131 0.177 0.031 (0.126) 0.056 (0.022) ** Friend -0.144 0.090 0.023 0.143 0.183 0.043 (0.125) 0.054 (0.021) ** Couple -0.165 0.074 0.002 0.125 0.167 0.024 (0.125) 0.027 (0.021) no_Meal 0.525 0.910 0.684 0.588 (0.010) *** no_Bathroom 0.284 0.766 0.485 0.290 (0.012) *** no_F & A 0.148 0.034 0.396 0.075 (0.021) *** J_room -0.007 -0.003 0.000 -0.008 -0.011 -0.011 (0.001) -0.011 (0.005) * Jan 0.010 0.015 0.014 0.009 0.012 0.012 (0.001) 0.002 (0.009) Feb 0.014 0.022 0.018 0.016 0.020 0.020 (0.002) 0.010 (0.009) Mar 0.005 0.010 0.010 0.010 0.012 0.011 (0.002) 0.004 (0.009) Apr -0.006 0.002 -0.001 0.002 0.004 0.003 (0.002) -0.009 (0.009) May 0.020 0.021 0.022 0.019 0.017 0.018 (0.002) 0.024 (0.008) ** Jun 0.020 0.025 0.023 0.024 0.025 0.023 (0.002) 0.027 (0.008) ** Jul 0.012 0.014 0.013 0.016 0.013 0.013 (0.002) 0.019 (0.008) * Aug 0.009 0.011 0.009 0.008 0.009 0.009 (0.001) 0.011 (0.008) Sep 0.007 0.008 0.008 0.006 0.006 0.008 (0.001) 0.007 (0.008) Oct 0.012 0.015 0.011 0.007 0.010 0.009 (0.001) 0.014 (0.008) . R2 Adj.R2 RSE ‘***’ 0.001 ‘**’ 0.01 ‘*’ 0.05 ‘.’ 0.1 0.7217 0.7216 0.4974 Without Words G-AMNet (V)
4.4. Partial Dependence Functions and Marginal Effects
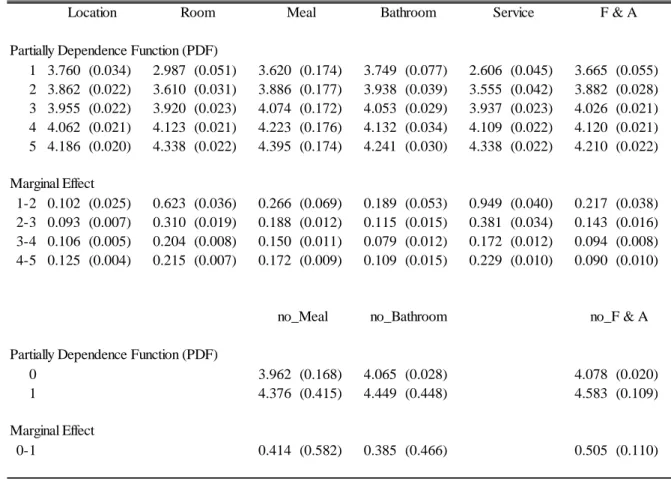
Table 7 and Figure 6 in Appendix I report the estimated partial dependence functions and marginal effects for the attribute ratings by G-AMNet (V). Table 7 shows that nearly all estimates are stable, although some (e.g., Meal, no_Meal, no_bathroom, and no_F&A) depend on initial values. Hence, we plan to address their instability in future studies.
From the results in Table 7 and Figure 6, we found the nonlinear relationships between attribute ratings and overall rating so that the marginal effects of attribute ratings are not constant. The marginal effect decreases until the rating changes to four points in Room, Meal, Bathroom, and Service. It also keeps decreasing in F&A, whereas it increases in Location. When the rating changes from four to five, the marginal effect increases in the former four attributes (Room, Meal, Bathroom, and Service). However, it may not provide large contributions to overall rating.
Table 7: Details of estimated marginal effects
1 3.760 (0.034) 2.987 (0.051) 3.620 (0.174) 3.749 (0.077) 2.606 (0.045) 3.665 (0.055) 2 3.862 (0.022) 3.610 (0.031) 3.886 (0.177) 3.938 (0.039) 3.555 (0.042) 3.882 (0.028) 3 3.955 (0.022) 3.920 (0.023) 4.074 (0.172) 4.053 (0.029) 3.937 (0.023) 4.026 (0.021) 4 4.062 (0.021) 4.123 (0.021) 4.223 (0.176) 4.132 (0.034) 4.109 (0.022) 4.120 (0.021) 5 4.186 (0.020) 4.338 (0.022) 4.395 (0.174) 4.241 (0.030) 4.338 (0.022) 4.210 (0.022) 1-2 0.102 (0.025) 0.623 (0.036) 0.266 (0.069) 0.189 (0.053) 0.949 (0.040) 0.217 (0.038) 2-3 0.093 (0.007) 0.310 (0.019) 0.188 (0.012) 0.115 (0.015) 0.381 (0.034) 0.143 (0.016) 3-4 0.106 (0.005) 0.204 (0.008) 0.150 (0.011) 0.079 (0.012) 0.172 (0.012) 0.094 (0.008) 4-5 0.125 (0.004) 0.215 (0.007) 0.172 (0.009) 0.109 (0.015) 0.229 (0.010) 0.090 (0.010) 0 3.962 (0.168) 4.065 (0.028) 4.078 (0.020) 1 4.376 (0.415) 4.449 (0.448) 4.583 (0.109) 0-1 0.414 (0.582) 0.385 (0.466) 0.505 (0.110)
Partially Dependence Function (PDF)
Marginal Effect
no_Bathroom no_Meal
Location Room Meal Bathroom
Partially Dependence Function (PDF)
Marginal Effect
Service F & A
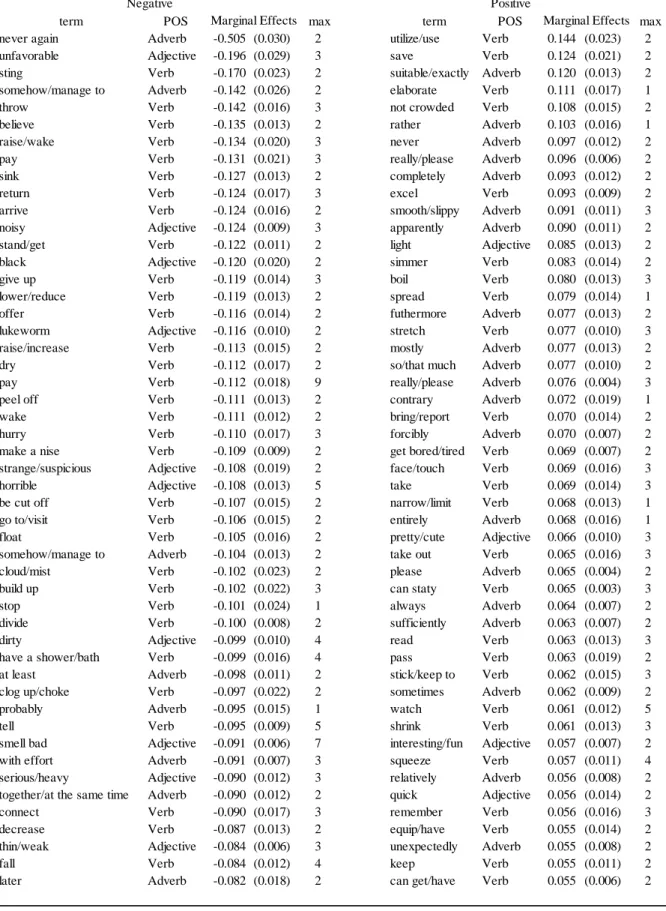
Table 8: Top-50 negative and positive marginal effects when the word frequency changes to one from zero
term POS max term POS max
never again Adverb -0.505 (0.030) 2 utilize/use Verb 0.144 (0.023) 2 unfavorable Adjective -0.196 (0.029) 3 save Verb 0.124 (0.021) 2 sting Verb -0.170 (0.023) 2 suitable/exactly Adverb 0.120 (0.013) 2 somehow/manage to Adverb -0.142 (0.026) 2 elaborate Verb 0.111 (0.017) 1
throw Verb -0.142 (0.016) 3 not crowded Verb 0.108 (0.015) 2
believe Verb -0.135 (0.013) 2 rather Adverb 0.103 (0.016) 1
raise/wake Verb -0.134 (0.020) 3 never Adverb 0.097 (0.012) 2
pay Verb -0.131 (0.021) 3 really/please Adverb 0.096 (0.006) 2
sink Verb -0.127 (0.013) 2 completely Adverb 0.093 (0.012) 2
return Verb -0.124 (0.017) 3 excel Verb 0.093 (0.009) 2
arrive Verb -0.124 (0.016) 2 smooth/slippy Adverb 0.091 (0.011) 3 noisy Adjective -0.124 (0.009) 3 apparently Adverb 0.090 (0.011) 2 stand/get Verb -0.122 (0.011) 2 light Adjective 0.085 (0.013) 2
black Adjective -0.120 (0.020) 2 simmer Verb 0.083 (0.014) 2
give up Verb -0.119 (0.014) 3 boil Verb 0.080 (0.013) 3
lower/reduce Verb -0.119 (0.013) 2 spread Verb 0.079 (0.014) 1
offer Verb -0.116 (0.014) 2 futhermore Adverb 0.077 (0.013) 2
lukeworm Adjective -0.116 (0.010) 2 stretch Verb 0.077 (0.010) 3 raise/increase Verb -0.113 (0.015) 2 mostly Adverb 0.077 (0.013) 2
dry Verb -0.112 (0.017) 2 so/that much Adverb 0.077 (0.010) 2
pay Verb -0.112 (0.018) 9 really/please Adverb 0.076 (0.004) 3
peel off Verb -0.111 (0.013) 2 contrary Adverb 0.072 (0.019) 1
wake Verb -0.111 (0.012) 2 bring/report Verb 0.070 (0.014) 2
hurry Verb -0.110 (0.017) 3 forcibly Adverb 0.070 (0.007) 2
make a nise Verb -0.109 (0.009) 2 get bored/tired Verb 0.069 (0.007) 2 strange/suspicious Adjective -0.108 (0.019) 2 face/touch Verb 0.069 (0.016) 3
horrible Adjective -0.108 (0.013) 5 take Verb 0.069 (0.014) 3
be cut off Verb -0.107 (0.015) 2 narrow/limit Verb 0.068 (0.013) 1 go to/visit Verb -0.106 (0.015) 2 entirely Adverb 0.068 (0.016) 1 float Verb -0.105 (0.016) 2 pretty/cute Adjective 0.066 (0.010) 3 somehow/manage to Adverb -0.104 (0.013) 2 take out Verb 0.065 (0.016) 3
cloud/mist Verb -0.102 (0.023) 2 please Adverb 0.065 (0.004) 2
build up Verb -0.102 (0.022) 3 can staty Verb 0.065 (0.003) 3
stop Verb -0.101 (0.024) 1 always Adverb 0.064 (0.007) 2
divide Verb -0.100 (0.008) 2 sufficiently Adverb 0.063 (0.007) 2
dirty Adjective -0.099 (0.010) 4 read Verb 0.063 (0.013) 3
have a shower/bath Verb -0.099 (0.016) 4 pass Verb 0.063 (0.019) 2 at least Adverb -0.098 (0.011) 2 stick/keep to Verb 0.062 (0.015) 3 clog up/choke Verb -0.097 (0.022) 2 sometimes Adverb 0.062 (0.009) 2
probably Adverb -0.095 (0.015) 1 watch Verb 0.061 (0.012) 5
tell Verb -0.095 (0.009) 5 shrink Verb 0.061 (0.013) 3
smell bad Adjective -0.091 (0.006) 7 interesting/fun Adjective 0.057 (0.007) 2 with effort Adverb -0.091 (0.007) 3 squeeze Verb 0.057 (0.011) 4 serious/heavy Adjective -0.090 (0.012) 3 relatively Adverb 0.056 (0.008) 2 together/at the same time Adverb -0.090 (0.012) 2 quick Adjective 0.056 (0.014) 2
connect Verb -0.090 (0.017) 3 remember Verb 0.056 (0.016) 3
decrease Verb -0.087 (0.013) 2 equip/have Verb 0.055 (0.014) 2
thin/weak Adjective -0.084 (0.006) 3 unexpectedly Adverb 0.055 (0.008) 2
fall Verb -0.084 (0.012) 4 keep Verb 0.055 (0.011) 2
later Adverb -0.082 (0.018) 2 can get/have Verb 0.055 (0.006) 2 Positive
Marginal Effects Marginal Effects
Table 8 summarizes the top-50 words ordered by the magnitudes of negative and positive marginal effects when the word frequency increases from zero to one. Figure 7 in Appendix I picks up the two words, “unfavorable” and “light,” which are the top negative and positive words among adjectives, respectively. Additionally, the details of estimates for partial dependence functions and marginal effects are reported in Table 9.
In Table 8, we find the asymmetry effect between negative and positive words, so that the marginal effects of negative words are larger than that of positive words. This result indicates that managing the negative customer reviews is more important. This was a similar conclusion of Wang and Chaudhry (2018). Figure 7 and Table 9 indicate that the positive and negative marginal effects decrease with increasing frequencies of “unfavorable” and “light,” respectively. Note that these marginal effects are estimated based on overall rating. For negative words, a negative effect is estimated, because the word might be used frequently in customer reviews with lower overall ratings. Therefore, some words might appear unreasonable.
Table 9: Illustrations of partial dependence functions and marginal effect for words
0 4.082 (0.020) 0 4.082 (0.020) 1 3.886 (0.036) 0-1 -0.196 (0.029) 1 4.167 (0.023) 0-1 0.085 (0.013) 2 3.682 (0.064) 1-2 -0.205 (0.036) 2 4.223 (0.034) 1-2 0.055 (0.017) 3 3.541 (0.084) 2-3 -0.141 (0.028) 3 4.257 (0.046) 2-3 0.035 (0.016) 4 3.461 (0.094) 3-4 -0.081 (0.022) 4 4.279 (0.057) 3-4 0.022 (0.013) 5 3.415 (0.100) 4-5 -0.045 (0.017) 5 4.293 (0.066) 4-5 0.014 (0.010) Unfavorable Light
PDF Marginal Effect PDF Marginal Effect
Comparing the marginal effects of attribute ratings and words, the overall ratings seem to be more affected by attribute service performance. However, we found that word frequency was important when the attribute ratings achieved higher points (3–5). Because we assume the review texts represents a customer experience, managers should pay attention to customer experiences, even if they obtain better
service attribute assessments. Additionally, it is effective to overall customer satisfaction to keep providing better experiences so that the customers willingly write positive reviews. Therefore, it is useful to realize improvement by investigating the review text based on the negative words estimated by G-AMNet.
Finally, we select the most effective two words (i.e., “never again” and “unfavorable”) and illustrate an example for a 2-dimensional partial dependence plot. The results are reported in Table 10 and Figure 8. When the frequency of the phrase, “never again,” changes from zero to one, the marginal effects of “unfavorable” decreases. Similarly, increasing the frequency of “unfavorable,” the marginal effect of “never again” decreases. Focusing on the interaction effect, a “never again” and an “unfavorable” easily promote decreasing overall ratings. However, it needs four “unfavorables” to reduce the overall rating by the same magnitude as without a “never again.” For illustration purposes, compare the color of the heat map and the two line graphs in Figure 8. These 2-dimensional PDPs should help obtaining a proper interpretation for interaction effects.
Table 10: Illustrations of 2-dimensional partial dependence functions and marginal effects
0 1 0 4.084 (0.020) 3.577 (0.034) 0 -0.507 (0.031) 1 3.888 (0.036) 3.463 (0.046) 1 -0.425 (0.036) 0-1 -0.197 (0.029) -0.115 (0.039) 2 3.683 (0.064) 3.402 (0.067) 2 -0.280 (0.056) 1-2 -0.205 (0.036) -0.060 (0.028) 3 3.542 (0.084) 3.372 (0.081) 3 -0.169 (0.065) 2-3 -0.141 (0.028) -0.030 (0.018) 4 3.461 (0.094) 3.357 (0.091) 4 -0.104 (0.064) 3-4 -0.081 (0.022) -0.016 (0.012) 5 3.416 (0.100) 3.348 (0.096) 5 -0.067 (0.058) 4-5 -0.045 (0.017) -0.008 (0.008) Partial Dependence Function
U nf avo ra bl e Never_again 1 Never_again (fixed) Marginal Effect U nf avo ra bl e Never_again 0-1 0 U nf avo ra bl e ( fi xe d)
5. Conclusions and Future Research
This study proposed a marketing model to estimate the impact of customer experience using a constrained neural network to process online review data. We investigated the relationship of overall ratings with customer experience and attribute performance. G-AMNet achieved better performance
than a fully connected neural network, indicating that different variables types should need to be treated separately when applying neural networks. We attribute this to a technique called “dropout,” which randomly drops units and their connections from the fully connected neural network during training. This makes it possible to improve the accuracy while avoiding overfitting (Srivastava et al. 2014). G-AMNet and the other semiparametric neural networks can be regarded as special cases of dropout.
Social science data is often handled differently from those of natural science or machine learning. Thus, it might be important to consider the model-driven approach of machine-learning algorithms for social science applications. In this study, we assumed that customer reviews and attribute ratings represented a different construct, then the G-AMNet learns the variables as separate networks. Additionally, the PDP estimated by this model provides natural interpretations for customer experience and attribute performance. The results indicate that the impactful words are useful to finding implementations of customer experience and services, and the negative words are especially important, because the customer might be more sensitive to the negative experience than the positive one.
For future research, there are three main limitations and issues. First, it is necessary to develop a measuring and validation method to specify the psychological variables from the text data posted by customers. According to Izogo and Jayawardhera (2018), customer reviews and experiences have a strong relationship. However, there are no systematic methods to measure the constructs from the textual data. Toubia et al. (2019) estimated latent topics based on psychological theory, and Humphreys and Wang (2018) called the latent topic a construct and discussed the applications of LDA in social science. For neural networks, CR and AVE (Sato 2019, Fornell & Larcker 1981) can be extended, because Sato (2019) proposed the construct validation for a nonlinear measurement model and discussed the reliability coefficient with the marginal effect estimation.
Second, the setting of our conceptualized model requires more strict causal relationships, because our model is very simple. For example, the relationship between customer experience and attribute performance should be estimated. However, we did not achieve this with our neural network. Moreover, past reviews might provide customer expectations or ideal points, affecting customer experience.
Therefore, specifying causal relationships among predictors and introducing dynamic effects in the network should improve the accuracy and validity of our model. The heterogeneity of consumers, hotels, and regions having high dimensional word data is an important remaining issue. Additionally, it requires specifying the context of the words and discussing how to find and visualize important interaction effects among the words.
Third, we should investigate the theoretical property of neural networks and apply it to the Bayesian neural-network method (e.g., Gaussian process regression model (Lee et al. 2018)). Because some estimates were unstable in G-AMNet, discovering this reason is very important for neural network interpretations in the social sciences. Additionally, the stochastic model for high dimensional data, such as Gaussian process regression, provides probabilistic inferences for the estimated parameters and functions. This is an advantage of the Bayesian neural network. Combining other Bayesian methods, we expect to resolve the sparsity of marketing data, which does not contain enough data when sorted by individuals.
References
Anderson, Eugene W. and Mary W. Sullivan (1993), The Antecedents and Consequences of Customer Satisfaction for Firms, Marketing Science, 12(2), 125-143.
Anderson, Eugene W. and Vikas Mittal (2000), Strengthening the Satisfaction-Profit Chain, Journal of
Service Research, 3(2), 107-120.
Arbore, Alessandro and Bruno Busacca (2009), Customer Satisfaction and Dissatisfaction in Retail Banking: Exploring the asymmetric impact of attribute performance, Journal of Retailing and
Consumer Services, 16(4), 271-280.
Becker, Richard A., William S. Cleveland, and Ming–Jen Shyu (1996), The Visual Design and Control of Trellis Display, Journal of Computational and Graphical Statistics, 5(2), 123-155.
Bleier, Alexander, Colleen M. Hormeling, and Robert W. Palmatier (2019), Creating Effective Online Customer Experiences, Journal of Marketing, 83(2), 98-119.
Brandt, D. Randall (1988), How Service Marketers Can Identify Value-Enhancing Service Elements,
Journal of Service Marketing, 2(3), 35-41.
Brakus, J. Josko, Brend H. Schmitt, and Lia Zarantonello (2009), Brand Experience: What Is It? How Is It Measured? Does It Affect Loyalty?, Journal of Marketing, 73(3), 53-68.
Büschken, Joachim and Greg M. Allenby (2016), Sentence-Based Text Analysis for Customer Reviews,
Marketing Science, 35(6), 953-975.
Bustamante, Juan Carlos and Natalia Rubio (2017), Measuring Customer Experience in Physical Retail Environments, Journal of Service Management, 28(5), 884-913.
Cameron, A. Colin and Pravin K. Trivedi (2005), Microeconometrics: Methods and Applications, Cambridge University Press.
Chen, Yubo and Jinhong Xie (2008), Online Consumer Review: Word-of-Mouth as a New Element of Marketing Communication Mix, Management Science, 54 (3), 477-491.
Cheung, Christy M. K. and Matthew K. O. Lee (2009), User Satisfaction with an Internet‐Based Portal: An asymmetric and nonlinear approach, Journal of the American Society for Information Science
and Technology, 60(1), 111-122.
Chintagunta, Pradeep K., Shyam Gopinath, and Sriram Venkataraman (2010), The Effect of Online User Reviews on Movie Box Office Performance: Accounting for Sequential Rollout and Aggregation Across Local Markets, Marketing Science, 29(5), 944-957.
Collobert, Ronan, Jason Weston, Léon Bottou, Michael Karlen, Koray Kavukcuoglu, and Pavel Kuksa (2011), Natural Language Processing (Almost) from Scratch, Journal of Machine Learning
Research, 12, 2493-2537.
Crane–Droesch, Andrew (2017), Semiparametric panel data models using neural networks, arXiv:1702.06512v2, 1-15.
Crane–Droesch, Andrew (2018), Machine Learning Methods for Crop Yield Prediction and Climate Change Impact Assessment in Agriculture, Environmental Research Letters, 13(11), 1-12.
Cronin, Joseph J. and Steven A. Taylor (1992), Measuring Service Quality: A Reexamination and Extension, Journal of Marketing, 56(3), 55-68.
Falk, Tmas, Maik Hammerschmidt, and Jeroen J. L. Schepers (2010), The Service Quality-Satisfaction Link Revisited: Exploring Asymmetries and Dynamics, Journal of the Academy of Marketing
Science, 38(3), 288-302.
Finn, Adam (2011), Investigating the Non-linear Effects of E-Service Quality Dimensions on Customer Satisfaction, Journal of Retailing and Consumer Services, 18, 27-37.
Fornell, Claes, and David F. Larcker (1981), Evaluating Structural Equation Models with Unobservable Variables and Measurement Error, Journal of Marketing Research, 18(1), 39-50.
Friedman, Jerome H. (2001), Greedy Function Approximation: A Gradient Boosting Machine, The
Annals of Statistics, 29(5), 1189-1232.
Gómez, Miguel I., Edward W. McLaughlin, Dich R. Wittink (2004), Customer Satisfaction and Retail Sales Performance: An empirical investigation, Journal of Retailing, 80(4), 265-278.
Goodfellow, Ian, Y. Benigo, and A. Courville (2016), Deep Learning, The MIT Press.
Gopinath, Shyam, Jacquelyn S. Thomas, and Lakshman Krishnamurthi (2014), Investigating the Relationship Between the Content of Online Word of Mouth, Advertising, and Brand Performance,
Marketing Science, 33(2), 241-258.
Greenwell, Brandon M. (2017), pdp: An R Package for Constructing Partial Dependence Plots, The R
Journal, 9(1), 421-436.
Grewal, Dhruv, Mchael, Levy, and V. Kumar (2009), Customer Experience, Management in Retailing: An Organizing Framework, Journal of Retailing, 85(1), 1-14.
Hastie, Trevor and Robert Tibshirani (1986), Generalized Additive Models, Statistical Science, 1(3), 297-318.
Hastie, Trevor, Robert Tibshirani, and Jerome Friedman (2009), The Elements of Statistical Learning: Data Mining, Inference, and Prediction Second Edition, Springer.
He, Kaiming, Xiangyu Zhang, Shaoqing Ren, and Jian Sum (2016), Deep Residual Learning for Image Recognition, 2016 IEEE Conference on Computer Vision and Pattern Recognition, 771-778 Hoch, Stephen J. (2002), Product Experience is Seductive, Journal of Consumer Research, 29(3),
448-454.
Hoffman, Donna L. and Thomas P. Novak (1996), Marketing in Hypermedia Computer-Mediated Environments: Conceptual Foundations, Journal of Marketing, 60(3), 50-68.
Holbrook, Morris B. and Elizabeth C. Hirschman (1982), The Experiential Aspects of Consumption: Consumer Fantasies, Feelings, and Fun, Journal of Consumer Research, 9(2), 132-140.
Hui, Michael K. and John E. G. Bateson (1991), Perceived Control and the Effects of Crowding and Consumer Choice on the Service Experience, Journal of Consumer Research, 18(2), 174-184. Humphreys, Ashlee, and Rebecca Jem–Hui Wang (2018), Automated Text Analysis for Consumer
Research, Journal of Consumer Research, 44(6), 1274-1306.
Izogo, Emest Emeka and Chanaka Jayawardhena (2018), Online Shopping Experience in An Emerging e-retailing market: Towards a Conceptual Model, Journal of Consumer Behavior, 17(4), 379-392. Khan, Imran and Zillur Rahman (2016), Retail Brand Experience: Scale Development and Validation,
Journal of Product & Brand Management, 25(5), 435-451.
Kingma, Diederik P. and Jimmy Lei Ba (2015), ADAM: A Method for Stochastic Optimization, arXiv:1412.6980v8, 1-15.
Klaus, Philipp 'Phil' and Stan Maklan (2012), EXQ: A Multiple-item Scale for Assessing Service Experience, Journal of Service Management, 23(1), 5-33.
Klaus, Philipp 'Phil' and Stan Maklan (2013), Towards A Better Measure of Customer Experience,
International Journal of Market Research, 55(2), 5-33.
Klemelä, Jussi Sakari (2014), Multivariate Nonparametric Regression and Visualization: With R and Applications to Finance, Wiley.
Kostyra, Daniel S., Jochen Reiner, Martin Natter, and Daniel Klapper (2016), Decomposing the Effects of Online Customer Reviews on Brand, Price, and Product Attributes, International Journal of
Research in Marketing, 33(1), 11-26.
Kozinets, Robert V. (2002), The Field Behind the Screen: Using Netnography for Marketing Research in Online Communities, Journal of Marketing Research, 39(1), 61-72.
Kozinets, Robert V., Kristine de Valck, Andrea C. Wojnicki, and Sarah J.S. Wilner (2010), Networked Narratives: Understanding Word-of-Mouth Marketing in Online Communities, Journal of
Marketing, 74(2), 71-89.
Krein, Roger A., Ambuj Jain, and Daniel J. Howard (1992), Store Shopping Experience and Consumer Price-Quality-Value Perceptions, Journal of Retailing, 68(4), 376-398
Larasati, Aisyah, Camille DeYong, and Lisa Slevitch (2011), Comparing Neural Network and Ordinal Logistic Regression to Analyze Attitude Responses, Service Science, 3(4), 304-312.
Lee, Joehoon, Yasaman Bahri, Romman Novak, Samuel S. Schoenholz, Jeffery Pennington, and Jascha Sohl-Dickstein (2018), Deep Neural Networks as Gaussian Processes, arXiv:1711.00165, 1-17. Lemon, Katherine N. and Peter C. Verthoef (2016), Understanding Customer Experience Throughout
the Customer Journey, Journal of Marketing, 80(6), 69-96.
Lin, Shu–Ping, Chen-Lung Yang, Ya–hui Chan, and Chwen Sheu (2010), Refining Kano's ‘Quality Attributes–Satisfaction’ Model: A moderated regression approach, International Journal of
Product Economics, 126(2), 255-263.
Ma, Liye, Baohong Sun, and Sunder Kekre (2015), The Squeaky Wheel Gets the Grease- An Empirical Analysis of Customer Voice and Firm Intervention on Twitter, Marketing Science, 43(5), 627-645. Marchand, André, Thorsten Hernnig–Thurau, and Caroline Wiertz (2017), Not all Digital Word of Mouth is Created Equal: Understanding the Respective Impact of Consumer Reviews and Microblogs on New Product Success, International Journal of Research in Marketing, 34(2), 336-354.
Matzler, Kurt, Franz Bailom, Hans H. Hinterhuber, Birgit Renzl, and Johann Pichler (2004), The Asymmetric Relationship Between Attribute-Level Performance and Overall Customer Satisfaction: A reconsideration of the importance–performance analysis, Industrial Marketing
Management, 33(4), 271-277.
Mittal, Vikas, Wagner A. Kamakura (2001), Satisfaction, Repurchase Intent, and Repurchase Behavior: Investigating the Moderating Effect of Customer Characteristics, Journal of Marketing Research, 38(1), 131-142.
Mittal, Vikas, William T. Ross, Jr., and Patrick M. Baldasare (1998), The Asymmetric Impact of Negative and Positive Attribute-Level Performance on Overall Satisfaction and Repurchase Intentions, Journal of Marketing, 62(1), 33-47.
Nikhashemi, S. R., Charles Jebrarhakirthy, and Khaldoon Nusair (2019), Uncovering the Roles of Retail Brand Experience and Brand Love in the Apparel Industry: Non-linear Structural Equation Modelling Approach, Journal of Retailing and Consumer Services, 48, 122-135.
Novak, Thomas P., Danna L. Hoffman, and Yiu–Fai Yung (2000), Measuring the Customer Experience in Online Environments: A Structural Modeling Approach, Marketing Science, 19(1), 22-42. Parasuraman, A., Valarie A. Zeithaml, and Leonard L. Berry (1985), A Conceptual Model of Service
Quality and Its Implications for Future Research, Journal of Marketing, 49(4), 41-50.
Parasuraman, A., Valarie A. Zeithaml, and Leonard L. Berry (1988), SERVQUAL: A Multiple-Item Scale for Measuring Consumer Perceptions of Service Quality, Journal of Retailing, 64(1), 12-40. Parasuraman, A., Valarie A. Zeithaml, and Leonard L. Berry (1994), Reassessment of Expectations as a Comparison Standard in Measuring Service Quality: Imprications for Further Research, Journal of
Marketing, 58(1), 111-124.
Pelletier, Mark J. and Joel E. Collier (2018), Experiential Purchase Quality: Exploring the Dimensions and Outcomes of Highly Memorable Experiential Purchases, Journal of Service Research, 21(4), 456-473.
Proserpio, Davide and Georgios Zervas (2017), Online reputation Management: Estimating the Impact of Management Response on Consumer Reviews, Marketing Science, 36(5), 645-665.
Rakuten, Inc. (2016), Rakuten Travel data, Informatics Research Data Repository, National Institute of informatics. (dataset). https://doi.org/10.32130/idr.2.2.
Robinson, P. M. (1988), Root-N-Consistent Semiparametric Regression, Econometrica, 56(4), 931-954. Sato, Toshikuni (2019), Construct Validation for a Nonlinear Measurement Model in Marketing and Consumer Behavior Research, Data Science and Service Research Discussion Paper (Tohoku
University), No.101, 1-39.
Schmitt, Brend (1999), Experiential Marketing, Journal of Marketing Management, 15(1), 53-67. Sridhar, Shrihari and Rajin Srinivasan (2012), Social Influence Effects in Online Product Ratings,
Journal of Marketing, 76(5), 70-88.
Srivastava, Nitish, Geoffrey Hinton, Alex Krizhevsky, Ilya Sutskever, and Ruslan Salakhutdinov (2014), Dropout: A Simple Way to Prevent Neural Networks from Overfitting, Journal of Machine
Learning Research, 15(1), 1929-1958.
Teixeira, Jorge, Lia Patrício, Nuno J. Nunes. Leonel Nóbrega, Raymond P. Fisk, and Larry Constantine (2012), Customer Experience Modeling: From Customer Experience to Service Design, Journal of
Service Management, 23(3), 362-276.
Tirunillai, Seshadri and Gerard J. Tellis (2014), Mining Marketing Meaning from Online Chatter: Strategic Brand Analysis of Big Data Using Latent Dirichlet Allocation, Journal of Marketing
Research, 51(4), 463-479.
Toubia, Olivier, Garud Iyengar, Renée Bunnell, and Alain Lemaire (2019), Extracting Feature of Entertainment Products: A Guided Latent Dirichlet Allocation Approach Informed by the Psychology of Media Consumption, Journal of Marketing Research, 56(1), 18-36.
Trusov, Michael, Randolph E. Bunklin, and Koen Pauwels (2009), Effects of Word-of-Mouth versus Traditional Marketing; Findings from an Internet Social Networking Site, Journal of Marketing, 73(5), 90-102.
Velten, Kai (2009), Mathematical Modeling and Simulation: Introduction for Scientists and Engineers, Wiley.
Venables, W. N. and B. D. Ripley (2002), Modern Applied Statistics with S, Springer.
Verhoef, Peter C., Katherine N. Lemon, A. Parasuraman, Anne Roggeveen, Michael Tsiros, and Leonard A. Schlesinger (2009), Customer Experience Creation: Determinants, Dynamics and Management Strategies, Journal of Retailing, 85(1), 31-41.
Wang, Yang and Alexander Chaudhry (2018), When and How Managers' Responses to Online Reviews Affect Subsequent Reviews, Journal of Marketing Research, 55(2), 163-177.
Appendix I: Other Figures and Tables
Table 11: Details of each network
0th 1st 2nd 3rd 4th 5th Words (684) Attribute ratings (6) Dummy Variables (21) Words (684) 3 7 8 Attribute Ratings (6) Dummy Variables (21) Words (684) 3 7 8 9th Degree Polynomial for Each Attribute Rating
(54) Dummy Variables (21) Words (684) 3 7 8 7th Degree Polynomial Location (7) 7 7th Degree Polynomial Room (7) 7 7th Degree Polynomial Meal (7) 7 7th Degree Polynomial Bathroom (7) 7 7th Degree Polynomial Service (7) 7 7th Degree Polynomial F & A (7) 7 Dummy Variables (21) attribute ratings (6) 70 100 30 40 Dummy Variables (21) Words (684) 3 7 8 attribute ratings (6) 80 80 50 8 Dummy Variables (21) Output (1) G-ANnet0 Output (1) Output (1) Output (1) Output (1) Model PLNet P-PLNet G-AMNet I-AMNet FCNet
Layer (unit or dimension)
9