鳥取大学研究成果リポジトリ
Tottori University research result repository
タイトル
Title
Wavelet Transform and Machine Learning-Based Biometric
Authentication Using EEG Evoked by Invisible Visual
Stimuli
著者
Auther(s)
Miyake, Takahiro; Kinjo, Nozomu; Nakanishi, Isao
掲載誌・巻号・ページ
Citation
Proceedings of the 2020 IEEE Region 10 Conference
(TENCON2020)
刊行日
Issue Date
2020-11
資源タイプ
Resource Type
会議資料 / Conference Paper
版区分
Resource Version
著者版 / Author
権利
Rights
© 2020 IEEE. Personal use of this material is
permitted. Permission from IEEE must be obtained
for all other uses, in any current or future media,
including reprinting/republishing this material
for advertising or promotional purposes, creating
new collective works, for resale or redistribution
to servers or lists, or reuse of any copyrighted
component of this work in other works.
DOI
Wavelet Transform and Machine Learning-Based
Biometric Authentication Using EEG Evoked by
Invisible Visual Stimuli
1st Takahiro MIYAKEGraduate School of Sustainability Sciences
Tottori University
Tottori,Japan
2nd Nozomu KINJO
Graduate School of Sustainability Sciences Tottori University Tottori,Japan 3rd Isao NAKANISHI Faculty of Engineering Tottori University Tottori,Japan [email protected]
Abstract— In this study, we propose the authentication of
individuals using electroencephalograms (EEGs) evoked by the application of invisible visual stimuli. In our previous study, we introduced a wavelet transform, which is a time-frequency analysis method, and applied it to extract features, including time information, to enable more accurate discrimination between individuals. An equal error rate (EER) of 9.4 % was achieved using Euclidean distance matching. In this paper, we introduce a machine learning-based approach in order to further improve the verification performance. An EER of 8.1 % is achieved by the proposed method after training the constituent neural networks using ensemble learning with 30 networks.
Keywords— Biometric authentication, Invisible stimulation Machine Learning, Electroencephalogram (EEG), Wavelet Transform
Ⅰ. INTRODUCTION
Biometric authentication based on human biometric information has attracted significant attention as a means of personal authentication. However, personal information such as fingerprints and facial features are external, and therefore, liable to be stolen by others. Moreover, since personal authentication is performed only once before a user starts using a system, it is not possible to detect possible instances of identity forgery once the initial authentication is completed. In order to address these problems, highly confidential biometrics that enable continuous authentication throughout the use of a system is necessary.
Electroencephalogram (EEG) has recently emerged as a biometric candidate that is both difficult to forge and suitable for continuous authentication. As EEG information is not exposed on the surface of an individual's body, it is highly confidential and information leakage is unlikely. Moreover, EEG is continuously generated by an individual, and is thus suitable for continuous authentication. In conventional research on personal authentication using EEG, EEG evoked by external visual stimuli has been used [1-4]. The authentication performance of techniques using EEG evoked by external stimuli is expected to be superior to those using spontaneously generated EEG. However, the external stimuli used in such techniques are generally perceptible to human beings. In the context of continuous authentication of the users of a system, imperceptible stimuli are preferable in order to avoid interference with the users' work.
To address the aforementioned problems, we propose a personal authentication technique based on EEG evoked by
Fig.1. Flow of stimulus presentation.
invisible visual stimuli. In our previous study, features to discriminate between individuals were extracted via frequency analysis of EEGs acquired from 20 subjects; the verification performance was then evaluated [5]. The equal error rate (EER), which represents the error rate of classification, was ascertained to be 43 %, and a high authentication rate could not be obtained. As a response, we introduced time-frequency analysis and proposed verification using features including time information based on Euclidean distance matching [6]. This improved the EER to 9.4 %. In this study, we introduce machine learning-based methods, support vector machine (SVM), and neural networks (NN) at the verification stage to further improve the verification performance.
Ⅱ.PERSON AUTHENTICATION USING EVOKED EEG BY
INVISIBLE VISUAL STIMULATION
The salient characteristics of our previous study [5] on personal authentication using EEG evoked by invisible visual stimuli can be outlined as follows.
Figure 1 depicts the flow of invisible stimulus presentation. For gazing, a red cross-shaped figure was presented at the
center of a white background, and a stimulus was presented above or below the gazing figure. A black circular figure was used as a visual stimulus. Invisible visual stimulation was realized by decreasing the contrast of the figure and increasing its frame rate to 120 frames per second (fps). After initiating the measurement, the red cross-shaped figure for gazing was first presented for 5 seconds. Following this, the invisible visual stimulus was presented for approximately 8 ms, followed by the presentation of the gazing figure again for approximately 992 ms. This succession of presentations comprised a presentation cycle lasting a total of 1 s, and was repeated 55 times. The number of experimental subjects was taken to be 20. In a dark room, the subjects were made to sit on a chair located at a distance of 75 cm from a display on which the stimuli were presented; they were asked to maintain a resting state. 10 measurements were performed on each subject, and EPOC produced by EMOTIV was taken to be the measured EEG (number of channels = 14, sampling rate = 128 Hz, bandwidth = 0.2 Hz - 43 Hz). In order to investigate the visibility of the visual stimulus, we prepared four types of visual stimuli with varying degrees of contrast, and asked each subject whether the stimuli were "visible" or "invisible" after recording the corresponding measurements. Figure 2 depicts the visual stimuli with varying degrees of contrast, where a contrast of 0 % corresponds to an image with no inserted stimulus, and those with 5 %, 10 %, and 100 % mean stimuli with corresponding intensities. The image corresponding to 5 % stimulus intensity was not perceived by all the subjects and was, therefore, regarded to be an invisible stimulus.
During preprocessing, the amplitudes of the EEG data were measured for 55 seconds, and the mean was computed. Values exhibiting deviations greater than ±100 µV from the average were regarded to be noise and one cycle of the EEG data that contained noise was removed. The remaining EEG data totaling a duration of 9 s was treated as a continuous EEG. Power spectra of α (8–13 Hz), low β (13–20 Hz), high β (20– 30 Hz), and γ (30–43 Hz) wavebands obtained via fast Fourier transform (FFT) were used as individual features. Figure 3 depicts the flow of the verification procedure. Euclidean distance matching was used as the method of verification and a minimal EER of about 40 % was observed. Thus, high verification performance could not be achieved.
Ⅲ. FEATURE EXTRACTION AND DISCRIMINATION VIA TIME-FREQUENCY
ANALYSIS
The degraded verification performance can be attributed to the loss of time information in the extracted individual features. To address this, we introduce wavelet transform, which is a time-frequency analysis technique, and reassess the verification performance using features in a time-frequency domain [6].
A. Continuous Wavelet Transform (CWT)
A wavelet basis is defined by Eq. (1) by scaling and translating a localized basis wave called the analyzing wavelet or the mother wavelet [7].
𝛹
𝑎,𝑏(𝑡) =
1 √𝑎𝛹(
𝑡−𝑏
𝑎
)𝑑𝑡
(1)The continuous wavelet transform is defined by Eq. (2) by convolving an input signal x(t) with the wavelet basis
𝑥̃(𝑎, 𝑏) = ∫
𝑥(𝑡)
1 √𝑎 +∞ −∞𝛹
∗(
𝑡−𝑏 𝑎)𝑑𝑡,
(2)Fig.2. Four visual stimuli of varying intensities.
Fig.3. Flow of the verification procedure where a denotes a scale parameter corresponding to the inverse of a frequency and b denotes a shifting parameter, which is a time index. The wavelet base is scaled by changing the value of a and translated by changing the value of b. The wavelet coefficient x̃(𝑎, 𝑏) is squared to obtain a scalogram and the time-frequency characteristic of the scalogram is used as a feature [6].
B. Synchronization of scalograms
As individual features, scalograms include temporal information. Therefore, in order to compare them, it is necessary to synchronize the beginning of each presentation cycle with those of the others.
As explained in the previous section, the visual stimuli were presented in cycles of one second. Therefore, it can be assumed that EEG data of duration one second includes one evoked response. Thus, scalograms are extracted from patches of EEG data of duration one second. Using a scalogram as a template, scalograms for verification are cyclically shifted in a time domain and a correlation value is calculated between two scalograms at each shift. The correlation value is defined by
R
k=
∑Ii=1∑Jj=1(fi,j−f̅)(gi,j+k−g̅)
√∑Ii=1∑Jj=1(fi,J−f̅)2√∑i=1I ∑Jj=1(gi,J+k−g̅)2
,
(3)where f and g denote the respective powers of the two scalograms, I denotes the frequency range, J denotes the time
range, and k denotes the shift value. A shift value corresponding to the maximum correlation value is taken to be a synchronization point. Scalograms shifted by the shift value are compared to the template scalogram during verification.
C. Feature extraction
Based on the knowledge that the power in the α-waveband of an EEG increases upon the presentation of a visual stimulus [8-10], scalograms in specific frequency bands, like those in
α, low β, high β, and γ wavebands, were extracted as
individual features. Figure 4 depicts an example of a scalogram divided into the four component frequency bands. The synchronization described in the previous subsection is performed by separately using the scalograms corresponding to individual frequency bands.
Further, the validity of the time information obtained by introducing time-frequency analysis is investigated based on scalograms averaged over a time domain [6]. Figure 5 depicts examples of scalograms averaged over each time-region, which are determined by equally dividing the entire time-domain. The time region 1 contains no time information, and therefore, corresponds to the spectrum by FFT. The scalograms averaged over time regions are used to form templates and each of them is compared with the corresponding scalogram of verification data.
D. Verification results
After deleting the EEG data that could not be synchronized due to the presence of a significant quantity of noise from the EEG database obtained from [5], we compiled 120 scalograms in aggregate. 60 of them were used to form templates and the remaining 60 were used as test data. Each template was created by averaging three scalograms for each subject after synchronization, and then randomly selecting one of them. The other two spectrograms were synchronized to the selected scalogram using the method described in Section III B. Cross-validation was performed 10 times, and Euclidean distance matching was used as the verification method. As a result, an average EER of 12.0 % was observed over the four electrodes (O1, O2, P7, and P8) when the number of time-regions corresponding to the α-waveband was taken to be 4. In particular, four electrodes are chosen to enable adequate monitoring of the occipital region of each subject's head, which is the expected site of responses generated by visual stimulation. A minimal EER of 9.4 % was observed in the α-waveband at the electrode O1 when the number of time regions was taken to be 16. The reason for the improvement in EER is that the induced EEG contains some response to the stimuli. Featuring a scalogram that is able to extract the response in time-frequency domain using the wavelet transform is more suitable than FFT.
Ⅳ. IMPROVING DISCRIMINATION PERFORMANCE BY INTRODUCING MACHINE LEARNING-BASED METHODS In our previous studies [5,6], Euclidean distances between template data points and test data points were calculated and used for the verification of subjects. In this study, two machine learning-based methods, SVM and NN, are introduced to improve the verification performance.
A. Verification based on Support Vector Machine (SVM)
SVM is a two-class classification method. It is known that margin maximization and kernel tricks enable more accurate
Fig. 4. A scalogram with divided four frequency bands.
Fig.5. Averaged scalograms corresponding to different time regions.
verification than Euclidean distance matching. In this study, we use SVM-Light, which is an open-source software [11]. In SVM, a brute force evaluation method called grid search is used to determine the value of the parameter, c, which corresponds to the tolerance level of misjudgment of the training data, and the parameter, g, which represents the complexity of the verification boundary. In addition, an appropriate kernel function is selected from among the linear, polynomial, and RBF kernels. As the parameters and kernel functions differ depending on the training data, the optimal values of the parameters that induce highest verification performance are identified via grid search during the training stage and then used during the verification stage.
The verification performance is evaluated under a stimulus intensity of 5 % and 16 time regions in the α-waveband at the electrode O1, corresponding to the settings that had yielded the best performance in our previous works. Cross-validation is performed 10 times.
Under the aforementioned conditions, an EER of 14.1 % was achieved, which is inferior compared to the EER of 9.4 % achieved using Euclidean distance matching [6]. However, the verification performance at electrode O2 is observed to have improved upon the application of SVM, which is discussed later.
B. Verification by Neural Network (NN)
NN is a supervised learning method that imitates the functional mechanism of the human brain. Its structure comprises simplified networks consisting of a large number of
Table.1. Verification results of each designed network
cells called neurons connected to each other via synapses. The weights corresponding to the synapses are updated via learning to decrease the error between the outputs of the network and the learning data. Learning is generally performed following the error backpropagation method. In this study, we construct a hierarchical NN using Neural Network Toolbox of MATLAB. Because NN possesses various parameters, such as the number of layers and the number of neurons in each layer, we first design certain patterns of the networks. Figure 6 depicts seven networks designed in this study. We evaluate their verification performances based on the data obtained from a randomly selected subject. The networks learned to output 0 corresponding to input data taken from the selected subject and 1 corresponding to those taken from other subjects. If the output of the network is less than a predefined threshold, the input data of the network is considered to have been taken from the genuine subject. If the output is larger than the threshold, the input data is regarded to have been taken from an imposter.
The results have been summarized in Table 1, in which cross-validation was performed 10 times. In our study, verification is assumed to be a technique to determine whether a prospective user is a genuine user. Therefore, for each subject, all other subjects are regarded as imposters and their data are also examined during verification. The matching ratio of each network is defined to be the ratio of the sum of the number of data points obtained from the genuine subject that were correctly adjudged to pertain to him/her and the number of data points obtained from other subjects that were correctly adjudged to pertain to other subjects to the total number of data points used during learning or testing, when the threshold is set to 0.5. The matching ratio corresponding to a genuine subject is defined to be the ratio of the number of data points obtained from the genuine subject that were correctly adjudged to pertain to him/her to the total number of data points gathered from the subject. The matching ratio during learning and that corresponding to the genuine subject is observed to be 100 % for each of the developed networks, thereby confirming the successful execution of learning. However, the matching ratio during testing is observed to vary among the networks. Comparing the matching ratios during testing with the ones corresponding to the genuine subject, it is ascertained that testing based on data from genuine subjects is relatively successful. However, testing based on data from imposters is observed to be unsuccessful except in the case of Network 7. Further, the performances of Networks 1–6 could not be fully generalized. As a result, Network 7 is confirmed to perform better than the other candidate networks.
Fig.6. The 7 networks designed in this study
Fig.7. NN classifier without and with ensemble learning Next, we use Network 7 to evaluate the verification performance corresponding to all subjects. As usual, cross-validation is performed 10 times. An EER of 12.1 % is Network1 Network2 Network3 Network4 Network5 Network6 Network7
EER[%] 32.3 30.4 32.5 31.6 34.9 27.4 0.7
The learning matching rate[%] 100 100 100 100 100 100 100
The test matching rate[%] 67.0 68.0 63.3 64.0 55.0 61.0 89.7
The learning matching rate
(only himself)[%] 100 100 100 100 100 100 100
The test matchinge rate
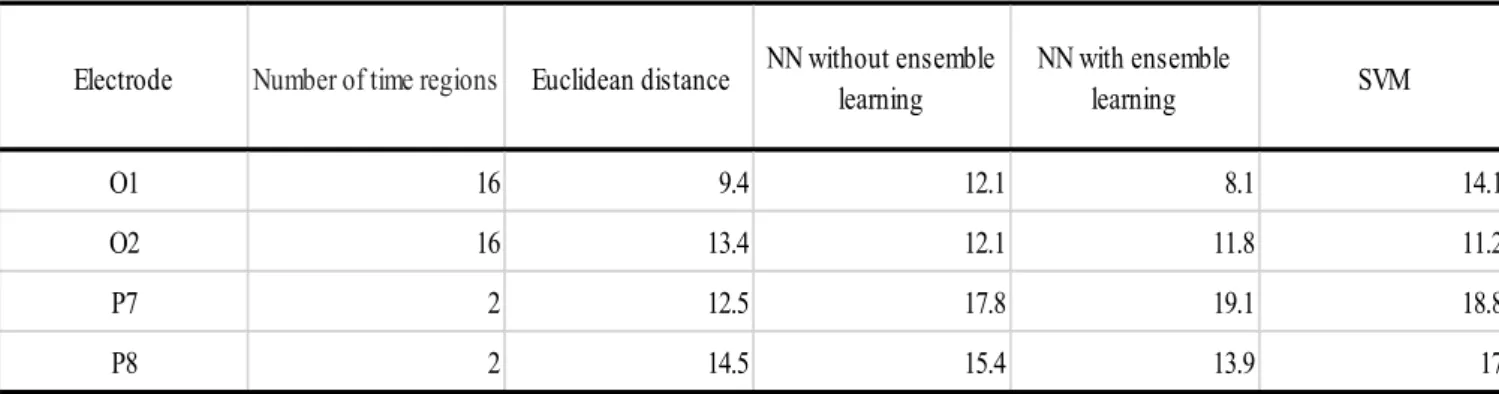
Table.2. EERs using each classifier at four electrodes
observed, which is inferior to the EER of 9.4 % obtained by using Euclidean distance matching [6].
Thus, we consider a single NN to be a weak classifier and introduce ensemble learning that uses multiple NNs to form a strong classifier. Figure 7 compares the performances of an NN without ensemble learning and NNs with ensemble learning. In the case of multiple NNs equipped with ensemble learning, the average of the outputs obtained via multiple NNs is regarded as the final output.
We evaluate the verification performance of NNs with ensemble learning. By employing ensemble learning using 30 networks, an EER of 8.1 % was achieved, which is better than the EER of 9.4 % obtained using Euclidean distance matching.
V.CONSIDERATION
Table 2 presents the EERs obtained at the four electrodes, O1, O2, P7, and P8 via each classifier. The verification performance at the electrode O2 is observed to improve after the introduction of machine learning, whereas those at the electrodes, O1 and P8, are observed to improve only after the application of NNs with ensemble learning. The latter improvement can be attributed to the elimination of the influence of the initial weights during learning by taking the average of the outputs obtained from multiple NNs.
Conversely, the verification performance at the electrode P7 does not improve at all even after the introduction of machine learning-based methods. Thus, the effect of introducing machine learning-based techniques is different for each electrode. As the parameters of the NNs used in this study are determined based on a subject, they might not be optimal. The verification performance may be further improved via adjustments by considering NNs corresponding to each subject.
Further, it is necessary to consider the possibility of overtraining of data in the case of machine learning-based methods. This is a phenomenon that occurs when the number of features is larger than the number of learning data points. For instance, the degradation of the verification performance observed after the introduction of SVM may be caused by overtraining. To prevent overtraining, it is necessary to increase the amount of training data.
Further, the number of subjects and data also affects the reliability of the verification performance. In future works, the number of subjects and measurement data points should be increased in order to improve the reliability of the results.
VI. CONCLUSIONS
In this study, EEGs evoked by invisible visual stimuli were examined using machine learning-based methods in
order to improve the verification performance of biometric identity evaluation systems. A minimal EER of 8.1% was achieved using the ensemble learned NNs, and this corresponds to the best verification performance. However, it was also confirmed that the verification performance was not always improved by applying machine learning-based methods because of overtraining induced by suboptimal structures of networks.
In future works, we need to construct more generalizable networks to further improve the verification performance. In addition, the number of subjects and the measurement data points need to be increased in order to improve the reliability of the obtained results.
REFERRENCES
[1] Y. Zeng, Q. Wu, K. Yang, L. Tong, B. Yan, J. Shu, D.
Yao, “EEG-Based Identity Authentication Framework Using Face Rapid Serial Visual Presentation with Optimized Channels”, Sensors, Vol. 19, No. 6, 2019.
[2] J. Clerk Maxwell, A Treatise on Electricity and Magnetism, 3rd ed., vol. 2. Oxford: Clarendon, 1892, pp.68–73.
[3] Y. Matsuyama, M. Shozawa, R. Yokote, “Brain signal’s
low-frequency fits the continuous authentication”, Neurocomputing, Vol. 164, pp.137-143, 2015.
[4] S. Yeom, Heung-II, S. Lee, “Person authentication from
neural activity of face-specific visual selfrepresentation”, Pattern Recognition, Vol. 46, Issue 4, pp.1159-1169, 2013.
[5] I. Nakanishi, M. Hattori,“Biometric Potential of Brain Waves Evoked by Invisible Visual Stimulation”,Proc. of 2017 International Conference on Biometrics and Kansei Engineering (ICBAKE2017), pp.94-99, Sep. 2017.
[6] N. Kinjo, I. Nakanishi, “Biometric Authentication using
Evoked EEG by Invisible Visual Stimulation -Feature Extraction Based on Wavelet Transform-”, Proc. Of 2019 International Workshop on Smart Info-Media System in Asia (SISA2019), pp. 88-92, Sep. 2019.
[7] W. Hsu, Y. Sun, “EEG-based motor imagery analysis
using weighted wavelet transform features”, Journal of Neuroscience Methods, Vol. 176, Issue 2, pp.310-318, 2009.
[8] S. J. Brooks, V. Savov, E. Allzen, C. Benedict, R.
Fredriksson, H. B. Schioth, “Exposure to subliminal arousing stimuli induces robust activation in the amygdata, hippocampus, anterior cingulate, insular cortex and primary visual cortex: A systematic meta-analysis of fMRI studies”, NeuroImage, Vol. 59, pp.2962-2973, 2012.
[9] S. Uono, W. Sato, R. Sawada, T. Kochiyama, M. Toichi,
“Spatiotemporal commonalities of fronto-parietal activation in attentional orienting triggered by supraliminal and subliminal gaze cues: An event-related
Electrode Number of time regions Euclidean distance NN without ensemble
learning NN with ensemble learning SVM O1 16 9.4 12.1 8.1 14.1 O2 16 13.4 12.1 11.8 11.2 P7 2 12.5 17.8 19.1 18.8 P8 2 14.5 15.4 13.9 17
potential study”, Biological Psychology, Vol. 136, pp. 29-38, 2018.
[10] M. Hoshimiya, R. Kakigi, S. Watanabe, K. Miki, Y.
Takeshima, “Brain responses for the subconscious
recognition of faces”, Neurosci Res, Vol. 46, pp.435-442, 2003.
[11] T. Joachims “Support Vector Machine”