Clarification of Physiological Functions of
Spindle Assembly Checkpoint Factor BubR1
著者
Yoshida Ayae
year
2018
その他のタイトル
紡錘体形成チェックポイント因子BubR1の生理学的
機能の解明
学位授与大学
筑波大学 (University of Tsukuba)
学位授与年度
2017
報告番号
12102甲第8577号
URL
http://doi.org/10.15068/00152281
Clarification of Physiological Functions of Spindle Assembly Checkpoint Factor BubR1
A Dissertation Submitted to
the Graduate School of Life and Environmental Sciences, the University of Tsukuba
in Partial Fulfillment of the Requirements
for the Degree of Doctor of Philosophy in Biological Science (Doctoral Program in Biological Sciences)
Table of Contents
Abstract...1
Abbreviations...3
General Introduction...5
Chapter 1 BubR1 insufficiency impairs liver regeneration in aged mice after hepatectomy through intercalated disc abnormality Introduction...10
Materials and Methods...12
Results...17
Discussion...31
Chapter 2 Contribution of BubR1 to oxidative stress-induced aneuploidy in p53 deficient cells Introduction...37
Materials and Methods...39
Results...44
Discussion...55
General Discussion...59
Acknowledgements...63
1 Abstract
Budding uninhibited by benzimidazole-related 1 (BubR1) is a major factor of the spindle assembly checkpoint (SAC), which monitors the accurate separation of sister chromosomes. When SAC function is impaired, unequal chromosomal distribution occurs, resulting in aneuploidy. Loss-of-function mutations in the Bub1b gene, which encodes BubR1, cause premature chromatid separation syndrome, a congenital disease, due to impaired SAC function. In addition, BubR1 has
SAC-independent functions, playing roles in cellular processes such as cilia formation and aging, and each of its functions appear to be related to human disease. Therefore, I hypothesized that elucidating further physiological functions of BubR1 might aid in the discovery of new disease mechanisms in humans.
In the first study, I investigated the relationship between BubR1 and impaired liver regeneration due to aging. Delayed liver regeneration after partial hepatectomy (PHx) is frequently observed in aged patients, and leads to acute liver injury. Low expression of BubR1 is also reportedly involved in aging; however, its effects on liver regeneration have not been investigated. Thus, I investigated the effects of BubR1 insufficiency on liver regeneration in mice. Low-BubR1-expressing mutant (BubR1L/L) mice displayed delayed recovery of the liver weight-to-body weight ratio and increased liver deviation enzyme levels after PHx. Microscopic observation of BubR1L/L mouse livers demonstrated an increased number of necrotic hepatocytes and intercalated disc anomalies, resulting in widened inter-hepatocyte and perisinusoidal spaces, smaller hepatocytes, and early-stage microvilli atrophy. Up-regulation of desmocollin-1 (DSC1) was observed in wild type, but not in BubR1L/L, mice after PHx. In addition, BubR1 knockdown caused the down-regulation of DSC1 in a human
keratinocyte cell line. The data suggest that BubR1 insufficiency resulted in impaired liver regeneration through weakened microstructural adaptation against PHx, enhanced transient liver failure, and delayed hepatocyte proliferation.
In the second study, I investigated the contribution of BubR1 to carcinogenesis and tumor malignancy. Although there are numerous reports that high BubR1 expression is a poor prognostic maker for various tumors and that aneuploidy is observed in these tumors, the relationship between
2
these clinical findings and high BubR1 expression remains unclear. Therefore, I explored why high BubR1 expression occurs and how it relates to carcinogenesis and tumor malignancy. First, I examined the involvement of p53 signal pathway, a crucial molecule in avoiding aneuploidy, in the control of BubR1 expression. KBrO3,an oxidant, caused the activation of p53 signaling pathway and suppressed BubR1 expression in human diploid fibroblast MRC5 cells. This suppression was
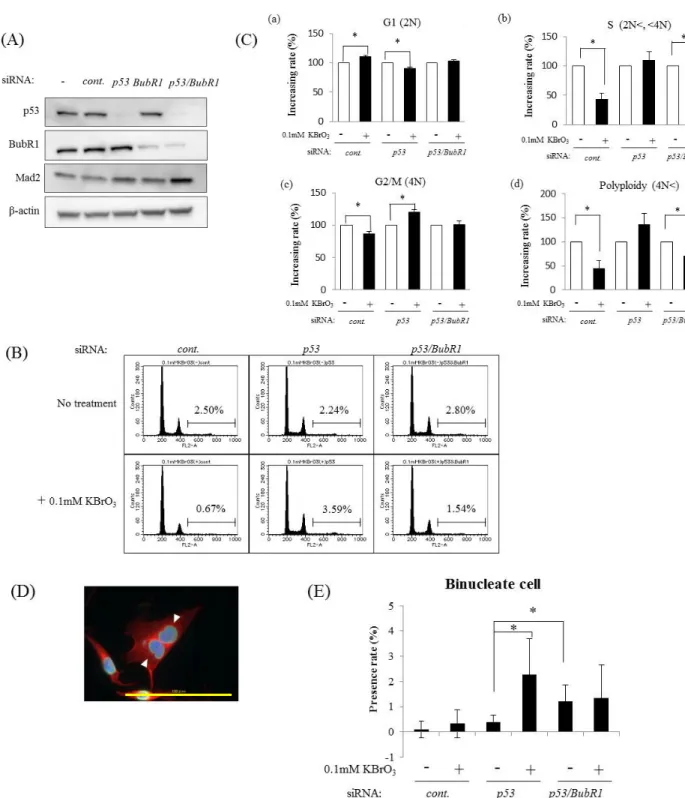
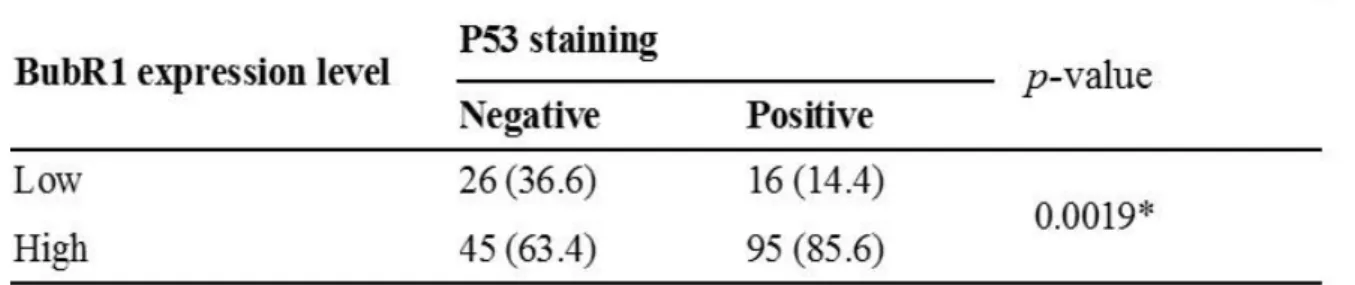
dependent on functional p53 and reactive oxygen species. In p53-depleted cells, KBrO3 did not suppress BubR1 expression and caused increases in both binucleated cells and cells with > 4N DNA content. BubR1 downregulation suppressed KBrO3-induced binucleation and cells with > 4N DNA content in p53 knockdown cells, suggesting that BubR1 contributes to enhanced polyploidization. In an analysis of 182 gastric cancer specimens, BubR1 expression was significantly higher p53 was positively stained, which indicates loss of p53 function (p= 0.0019). Moreover, p53 positivity and high BubR1 expression in tumors were significantly correlated with aneuploidy (p=0.0065). These observations suggest that p53 deficiency may lead to failure to downregulate BubR1, and p53 deficiency and BubR1 accumulation could contribute to gastric carcinogenesis associated with aneuploidy.
These studies reinforce the notion that BubR1 is associated with biologically important processes, both as part of the SAC and independently. Since abnormal expression of BubR1 results in various diseases, it is considered a useful target for drug development. In the future, it will be
necessary to elucidate the factors affecting each function downstream of BubR1. Moreover, further clarification of the relationships between different BubR1 functions at the molecular level will lead to the elucidation of new disease mechanisms, and contribute to the development of effective treatments for BubR1-related diseases.
3 Abbreviations
BubR1: budding uninhibited by benzimidazole-related 1 SAC: spindle assembly checkpoint
APC/C: anaphase-promoting complex/cyclosome CDC20: cell-division cycle protein 20
CDK1: cyclin-dependent kinase 1 MCC: mitotic checkpoint complex Mad2: mitotic arrest deficient 2
Bub3: budding uninhibited by benzimidazoles 3 homolog Mad3: mitotic arrest deficient 3
PCS: premature chromatid separation MVA: mosaic variegated aneuploidy PHx: partial hepatectomy
ID: intercalated disc DSC1: desmocollin-1
ALT: alanine:2-oxoglutarate aminotransferase AST: asparate:2-oxoglutarate aminotransferase LDH: lactate dehydrogenase
T-BIL: total bilirubin D-BIL: direct bilirubin I-BIL: indirect bilirubin TBA: total bile acid ALP: alkaline phosphatase IDs: intercalated disks
DICD: detachment induced cell death mRNA: messenger ribonucleic acid siRNA: small interfering RNA
4 PCR: polymerase chain reaction
5 General Introduction
Cell division is necessary for the development and maintenance of life, and occurs through the replication and even distribution of cellular components to two daughter cells. For the survival and evolution of species, division must occur accurately, and thus each step is controlled by cell cycle control mechanisms. One of these control mechanisms, the spindle assembly checkpoint (SAC), monitors whether chromosomes are evenly distributed to daughter cells. During DNA replication, replicated sister chromatids are attached to each other by a protein complex called cohesin. Upon entering mitosis, the kinetochore, a protein complex located at the centromere of each chromatid, binds microtubules extending from opposite poles of the cell. With proper kinetochore-microtubule attachment, the multisubunit ubiquitin E3 ligase, anaphase-promoting complex/cyclosome (APC/C) associates with a specific coactivator called cell division cycle 20 (CDC20), and ubiquitinates and degrades two key proteins maintaining the cell in prometaphase: cyclin B and securin. Cyclin B is a regulatory subunit of the master mitotic kinase cyclin-dependent kinase 1 (CDK1) and securin is an inhibitor of separase, a cohesin protease. Proteolysis of these proteins leads to the separation of sister chromatids (Bolanos-Garcia et al. 2011). However, if a kinetochore is improperly attached to the microtubules, multiple SAC factors associate there, forming the mitotic checkpoint complex (MCC), which incorporates CDC20 and interferes with APC/C activation, delaying anaphase onset and giving the cell time to correct attachment errors. Once proper attachment is achieved, the MCC is dismantled and the APC/C is activated, allowing progression to anaphase. Defects in the SAC allow cells with improperly attached kinetochores to enter anaphase, generating aneuploid cells. BubR1 (budding uninhibited by benzimidazole-related 1) forms the MCC with mitotic arrest deficient-like 1 (Mad2), Bub3 and CDC20, and plays a key role in SAC function (Yu 2002).
BubR1 is a metazoan homologue of yeast (Saccharomyces cerevisiae) Mad3. The general domain architecture of BubR1 is shown in Fig 1. Human (Homo sapiens) BubR1 is 1050 residues long and can be divided into three regions on both structural and functional grounds: the N-terminal region (residues 1–426), containing most of the sequence conserved with yeast Mad3, the C-terminal region (residues 730–1050) containing the kinase domain, and a middle region (residues 427–729).
6 Figure 1. Schematic of the structure of BubR1 and Mad3.
Two Lys-Glu-Asn (KEN) box motifs, three tetratricopeptide repeat (TPR) motifs, and one Gle2 (nucleoporin)-binding-sequence (GLEBS) motif are located in the conserved region and contribute to SAC function. The kinetochore attachment regulatory domain (KARD) and serine/threonine (S/T) kinase domain are in the non-conserved region of BubR1. The KARD may promote proper
kinetochore-microtubule attachments. The function of S/T kinase domain is controversial. H. sapiens,
Homo sapiens; M. musculus, Mus musculus; X. laevis, Xenopus laevis; D. melanogaster, Drosophila melanogaster; S. cerevisiae, Saccharomyces cerevisiae; S. pombe, Schizosaccharomyces pombe, and A. thaliana, Arabidopsis thaliana. The residue numbers in each domain of H. sapiens BubR1 and S. cerevisiae Mad3 are shown in parentheses below the domain abbreviations.
7
The N-terminal region is the most highly conserved across eukaryotes, and is involved in MCC formation and SAC function. The middle region is involved in promoting stable kinetochore and microtubule attachments (Karess et al. 2013). The function of serine/threonine (S/T) kinase domain is controversial.
Loss-of-function mutations in Bub1b, which encodes BubR1, cause premature chromatid separation (PCS) syndrome (Mendelian Inheritance in Man [MIM] 176430), a congenital disease also known as mosaic variegated aneuploidy (MVA) syndrome (MIM 257300) (Hanks et al. 2004,
Matsuura et al. 2006). PCS/MVA syndrome can be caused by the suppression of Bub1b transcription by an intergenic mutation 44-kb upstream of the Bub1b gene (Ochiai et al. 2014). PCS/MVA
syndrome is diagnosed by the presence of PCS in > 50% of metaphase cells and the presence of mosaic aneuploidy. Patients are more prone to develop childhood cancers such as Wilms tumor and rhabdomyosarcoma, which may be attributed to loss of SAC function. Obesity, polycystic kidneys, postcerebellar cysts, and hypoplasia of the cerebellar vermis are also common clinical findings, but the pathophysiological mechanisms of these features are unknown. In recent years, it has been postulated that these could be caused by SAC-independent BubR1 functions.
The primary cilium is a microtubule-based, nonmotile organelle that forms on the surface of quiescent mammalian cells (Nigg et al. 2009). It receives extracellular information and transmits signals required for cell proliferation, tissue development, and tissue homeostasis. Ciliary dysfunction results in human disorders known as ciliopathies (Baker et al. 2009) and affected patients show a series of clinical features including polycystic kidneys, polydactyly, obesity, and neuronal and other developmental abnormalities, similar to patients with PCS/MVA. Interestingly, impaired ciliogenesis was observed in skin fibroblasts from patients with PCS/MVA with mutations in Bub1b (Miyamoto et al. 2011), suggesting a link between ciliary dysfunction and loss of BubR1 function. Moreover, knockdown medaka fish (Oryzias latipes) displays ciliary dysfunction and typical phenotypes of ciliopathies (Miyamoto et al. 2011). These lines of evidence suggest that BubR1 plays an important, SAC-independent role in primary cilia formation.
8
BubR1 hypomorphic mice, with approximately 11% of the expression observed in wild type mice, show several early aging phenotypes, including short lifespan, cachectic dwarfism,
lordokyphosis, sarcopenia, cataracts, craniofacial dysmorphisms, arterial stiffening, fat loss, reduced stress tolerance, and impaired wound healing (Baker et al. 2004). It was demonstrated that low BubR1expression in these mice induces p16Ink4a (a CDK1 inhibitor and marker of senescence) and promotes the development of aging-related phenotypes independently of SAC function (Baker et al. 2008, Baker et al. 2011). Interestingly, BubR1 mRNA and protein levels naturally decrease with aging in mice and humans (Baker et al. 2004, Guntani et al. 2011). These findings suggest a role for BubR1 in the natural aging process.
Clearly, BubR1 is a multifunctional protein, and both its SAC-dependent and -independent functions are suggested to be related to human disease. Therefore, I hypothesized that elucidating further physiological functions of BubR1 might aid in the discovery of new disease mechanisms in humans.
Since decreased BubR1 expression contributes to aging-related phenotypes, I have investigated the relationship between BubR1 and impaired liver regeneration due to aging (Chapter 1). In addition, although numerous reports suggest that high BubR1 expression could be a poor prognostic maker for various tumors (Grabsch et al. 2003, Burum-Auensen et al. 2007, Yamamoto et al. 2007), and that aneuploidy was observed in these tumors (Pinto et al. 2008, Ando et al. 2010), the relationships between these clinical findings and BubR1 expression remain unclear. Thus, I have also investigated the contribution of BubR1 to carcinogenesis and tumor malignancy (Chapter 2). Based on the results of these studies, I then discuss future directions for functional BubR1 research, and a strategy for drug development for BubR1-related diseases.
9 Chapter 1
BubR1 insufficiency impairs liver regeneration in aged mice after hepatectomy through intercalated disc abnormality
10 Introduction
It was previously demonstrated that decreased BubR1 expression induces cellular senescence through p16INK4a up-regulation, and that mutant mice with decreased BubR1 expression display various progeroid phenotypes, such as short lifespan, cachectic dwarfism, lordokyphosis, cataracts, loss of subcutaneous fat and impaired wound healing (Baker et al. 2004, Matsumoto et al. 2007, Baker et al. 2008, Baker et al. 2011). Therefore, BubR1 could play an important role in regulating aging. Kyuragi et al recently generated a new BubR1 low-expression mouse, which is a useful model to investigate the role of BubR1 in response to various kinds of stress because they do not display any severe phenotypes during growth and development under normal circumstances (Kyuragi et al. 2015). Using this animal model, they have shown that reduced BubR1 expression inhibits intimal hyperplasia mediated by reduced vascular smooth muscle cell proliferation after carotid artery ligation.
Adult hepatocytes are normally quiescent cells in the G0 phase of the cell cycle and do not undergo cell division, whereas they proliferate to maintain liver homeostasis in response to several stimuli, such as surgical resections or liver injury (Fausto 1994, Michalopoulos et al. 1997). After partial hepatectomy (PHx), most of the quiescent hepatocytes (95% in young and 75% in old rats) rapidly enter the cell cycle (Michalopoulos 2007). In the mouse liver, peak DNA synthesis occurs at about 36–44 h after PHx, and DNA synthesis is synchronously initiated in hepatocytes (Matsuo et al. 2003, Taub 2004, Michalopoulos 2007). When DNA synthesis is impaired, hepatic regeneration is also impaired (Rudolph et al. 2000, Satyanarayana et al. 2003). Most of the increase in liver mass occurs within 3 days after PHx and the remnant liver regenerates to a size equivalent to the original volume within 5–7 days (Grisham 1962).
In animal models, hepatocytes are directly damaged and thereby induced to undergo necrosis or apoptosis to eliminate damaged cells after PHx (Guicciardi et al. 2013). Hepatocyte proliferation is initiated by several growth factors or cytokines during liver regeneration that occurs after massive hepatocyte necrosis or apoptosis (Fausto et al. 2006). The liver architecture during regeneration after PHx is significantly changed, and this change impacts liver function. Intra- and
11
inter-cellular junctions temporarily change during regeneration following PHx and reformation of the normal liver architecture occurs only after the original volume is restored. The mechanisms that regulate the reorganization of the liver architecture are not well understood (Taub 2004).
Liver regeneration is series of physio-pathological phenomena that allow recovery of damaged tissue and prevent liver failure (Haga et al. 2010). Impairment of liver regeneration is a critical problem for aged patients with liver diseases after surgical resection and PHx because their liver does not have the ability to regenerate physically and functionally. In the clinical setting, impairment of liver regeneration leads to liver dysfunction, which can worsen or affect the patient’s general condition and their postoperative prognosis. The operative mortality rate for patients after major hepatectomy increased incrementally with age (Fortner et al. 1990). Aging impairs liver regeneration and there is a reduced rate of hepatocyte proliferation following resection (Schmucker et al. 2011). However, the mechanism of impaired regenerative capacity in the aged liver has not been fully elucidated.
A previous study suggests that BubR1 insufficiency causes early onset of aging-associated phenotypes (Baker et al. 2004), but the physiological relevance of BubR1 to liver regeneration and/or the effects of BubR1 on liver architecture remain unclear. The purpose of this study is to investigate the effects of BubR1 insufficiency on liver regeneration and its architecture using BubR1 low-expression mice.
12 Materials and Methods
Experimental animals.
Animals were maintained under standard conditions and treated according to the Guidelines for the Care and Use of Laboratory Animals of Kyushu University. All experimental protocols were approved by the Kyushu University Institutional Animal Care and Use Committee. (Approval no. A24-220-0). Low-BubR1-expressing mutant (BubR1L/L) and wild-type (WT) littermate control (BubR1+/+) mice on a mixed genetic background of C57BL/6J/ and 129/SvJ were generated in the laboratory, as previously described. Five-week-old BubR1L/L and BubR1+/+ male mice were used for experiments. Young (7-week-old) and aged (53-week-old) C57BL/6JJcl male mice were obtained from CLEA Japan Inc. (Tokyo, Japan), and kept in my facility for 2 weeks before use.
Partial hepatectomy model.
Seventy percent PHx was performed as previously described (Greene et al. 2003, Haga et al. 2010). Briefly, the bilateral median lobe and left lateral lobe were ligated and removed. After the wounds were sutured, animals were kept on a warming mat to avoid hypothermia. Mice were sacrificed to collect the remaining lobes and blood samples at each indicated time point before and after PHx. The liver weight-to-body weight ratio (LW/BW) was calculated to estimate liver mass recovery. Liver tissue samples were frozen or fixed with formalin and embedded in paraffin. Blood samples were collected from the postcava during anesthesia.
Biochemical analyses.
Asparate:2-oxoglutarate aminotransferase (AST), alanine:2-oxoglutarate aminotransferase (ALT), lactate dehydrogenase (LDH), total bilirubin (T-BIL), direct bilirubin (D-BIL), indirect bilirubin (I-BIL), total bile acid (TBA), and alkaline phosphatase (ALP) plasma levels were analyzed by Nagashima Life Sciences Laboratory (Shiga, Japan).
13
A human keratinocyte cell line (HaCaT, Cell Lines Service, Eppelheim, Germany) was cultured in Dulbecco’s Modified Eagle’s Medium (DMEM, Thermo Fisher Scientific Inc., Waltham, MA, USA), supplemented with 10% heat-inactivated fetal bovine serum (FBS, Sigma-Aldrich Corp, St. Louis, MO, USA), 100 U/ml penicillin and 100 µg/ml streptomycin (Thermo Fisher Scientific Inc.) in plastic disposable tissue culture flasks for RNA extraction and coverslips for confocal laser scanning microscopy at 37°C in a 5% CO2/95% air incubator.
BubR1 knockdown using siRNA.
Lipofectamine RNAiMAX transfection reagent (Life Technologies, Carlsbad, CA, USA) was used to transfect a siRNA targeting BubR1 (sc-37542; Santa Cruz Biotechnology, Dallas, TX, USA) or negative control (12935-112; Thermo Fisher Scientific Inc.) into HaCaT cells at a final concentration of 5 nmol/L in transfection reagent (dilution, 1:1000; vol/vol), according to the
manufacturer’s protocol. After siRNA transfection at 24, 48 and 72 h, siRNA-transfected HaCaT cells were collected. Total RNA was extracted and reverse-transcription was performed to obtain cDNA. BubR1 and desmocollin-1 (DSC1) mRNA expression was evaluated using quantitative real-time polymerase chain reaction (qRT-PCR). For confocal laser scanning microscopy, cells were fixed with ice-cold methanol after siRNA transfection at 48h.
mRNA quantification using qRT-PCR.
Total RNA was isolated using ISOGEN (Nippongene, Tokyo, Japan) and cDNAs were synthesized from RNAs using SuperScript III First-Strand Synthesis SuperMix (Thermo Fisher Scientific Inc.) according to the manufacturer’s instructions. qRT-PCR amplification was performed using Applied Biosystems StepOnePlus Real-Time PCR System (Thermo Fisher Scientific Inc.). The primer/probe sets for mouse Ccnd1 (Mm00432359_m1), Ccne1 (Mm00432367_m1), Ccna2
(Mm00438064_m1), Ccnb2 (Mm01171453_m1), p21 (Mm04205640_g1), p16 (Mm00494449_m1) and desmocollin-1 (Mm00496525_m1) from the TaqMan gene expression assays (Thermo Fisher Scientific Inc.) and the primer/probe set for β-actin (Mm00607939_s1) as a mouse endogenous
14
control were purchased from Thermo Fisher Scientific Inc. The primer/probes sets for human desmocollin-1 (Hs00245189_m1) and BubR1 (Hs02758991_g1) from the TaqMan gene expression assays (Thermo Fisher Scientific Inc.) and the primer/probe set for glyceraldehyde-3-phosphate dehydrogenase (GAPDH, Hs02758991_g1) as a human endogenous control were purchased from Applied Biosystems (Haga et al. 2010). Mouse BubR1 expression was analyzed using QuantiFast SYBR Green PCR kit (QIAGEN, Tokyo, Japan) and normalized to GAPDH, as previously described (Kyuragi et al. 2015). The sequences of primers are as follows: mouse BubR1, 5′-CAG TCC CAG CAC AGA CAG TTC CA-3′ (forward) and 5′-GCT AGC GAG CTT CTC TGT GGT TCA-3′ (reverse); and GAPDH 5′-ATC TGG AAA GCT GTG GCG-3′ (forward) and 5′-CCA CGA CGG ACA CAT TG-3′ (reverse).
Tissue histopathological examination.
Hematoxylin-eosin (HE) staining and silver impregnation stain were performed on 10% formalin-fixed and 3-µm paraffin-embedded sections of liver tissue. For transmission electron microscopic observation, liver samples were fixed in glutaraldehyde. Immunostaining was performed to detect proliferating cell nuclear antigen (PCNA; M0879, Dako, Tokyo, Japan) and streptavidin– biotin–peroxidase staining was performed using Histofine SAB-PO (M) immunohistochemical staining kit (Nichirei Bioscience Inc., Tokyo, Japan) and counterstained with hematoxylin. At least 1000 hepatocytes were counted for the mitotic index and PCNA positivity in different sections for each group. The necrosis score was calculated by counting the number of necrotic lesions per low-power magnification (×40) in 8 fields per slide.
Formalin-fixed/paraffin-embedded tissue specimens were used for immunofluorescence staining. Deparaffinization was performed by soaking in xylene for 5 min (twice), 100% ethanol for 3 min, 95% ethanol for 3 min, 85% ethanol for 3 min, 75% ethanol for 3 min and washing with PBS for 5 min. The sections were pretreated by autoclaving (121C) for 20 min in 0.01 mol/L citrate-buffered saline (pH 6.0) for antigen retrieval. Non-specific reactions were blocked with 10% goat serum (Histofine SAB-PO(R) kit, Nichirei Bioscience Inc.) for 10 min. The sections were incubated with
15
rabbit polyclonal antibodies against DSC1 (LS-C167539, 1:50; LifeSpan BioSciences, Seattle, WA, USA) at 4C overnight, before washing with PBS. The sections were incubated with anti-rabbit immunofluorescence antibodies (Alexa Fluor 555, 1:200, Abcam) to detect DSC1 for 60 min and washed 3 times with PBS for 5 min each.
Confocal Laser Scanning Microscopy.
siRNA mediated HaCaT cells were rinsed in PBS at 37 °C, fixed in cold methanol for 3 min at −20 °C, blocked (PBS containing 2% BSA and 2% normal goat serum) for 30 min at room
temperature, and incubated with the following antibodies at the indicated dilution: rat anti-DSC1 at 1:100 (MAB7367; R&D Systems, Inc., Minneapolis, MN USA), rabbit anti-BubR1 at 1:100 (612503; BD Biosciences, San Jose, CA). Cells were rinsed in PBS at 37 °C, fixed in 4% paraformaldehyde for 15 min at 37 °C, permeabilized (PBS containing 0.2% Triton X-100) for 5 min at room temperature, blocked (PBS containing 2% BSA and 2% normal goat serum) for 30 min at room temperature. Secondary antibodies conjugated to Alexa Fluor 488, 555 (Molecular Probes) were used at 1:2,000 dilution. After a wash in PBS containing 4,6-diamidino-2-phenylindole (DAPI) for 5 min, the coverslips were mounted in ProLong Gold (Thermo Fisher). Fluorescence image acquisition was performed using a Nikon A1R confocal imaging system controlled by the Nikon NIS Elements software (Nikon). The objective lens was an oil immersion Plan-Apo × 60 numerical aperture (NA) 1.40 lens (Nikon). Images were acquired as Z-stacks at 0.2-μm intervals and maximum-intensity projections were generated using the NIS Elements software (Nikon).
Western blot analysis.
Western blot analysis was performed as previously described (Liu et al. 2012). Livers were isolated and all surrounding material was removed. After preparing lysates, proteins were separated using SDS-PAGE and transferred to a nylon membrane. The blots were probed with primary antibody for DSC1 (LS-C 167539, 1:500, LifeSpan BioSciences). Equal loading was confirmed using β-actin
16
(#4970, 1:1000, Cell Signaling Technology Inc.). Results are representative of three independent animals of each genotype at each age.
Enzyme-linked immunosorbent assay for hepatocyte growth factor.
Frozen liver tissue was homogenized in lysis buffer (CelLytic MT Cell Lysis Reagent, Sigma Aldrich, St. Louis, MO, USA) containing protease inhibitor cocktail (Nacalai Tesque, Kyoto, Japan) and hepatic hepatocyte growth factor (HGF) levels were measured using the Mouse/Rat HGF Quantikine ELISA Kit (R&D Systems, Minneapolis, MN, US). HGF levels were normalized to total protein levels in the liver tissue, as measured using a Bio-Rad Protein Assay (Bio-Rad, Hercules, CA, USA).
Statistical analysis.
Data were presented as the mean±standard deviation (SD). The Student’s t-test was performed using JMP pro (version 9.0.0, SAS Institute Inc., Cary, NC, USA). Additional professional statistical assistance was provided by Junji Kishimoto, Kyushu University. Differences were
17 Results
BubR1 mRNA expression in liver regeneration after partial hepatectomy.
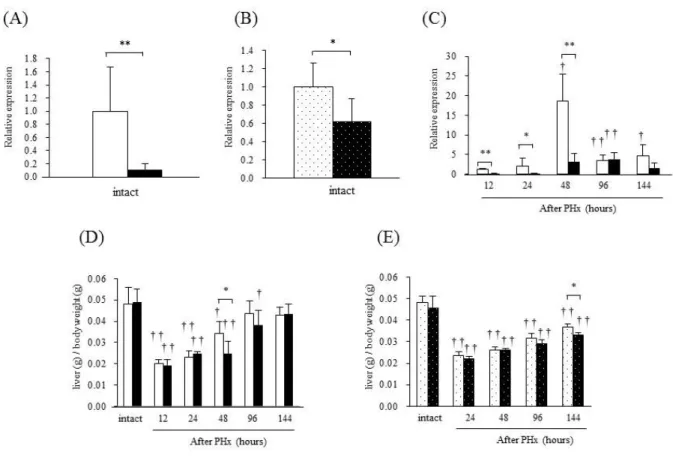
BubR1 mRNA expression levels in the liver are shown in Fig. 2A, B and C. In BubR1L/L mice, BubR1 mRNA expression was significantly lower (0.11±0.09, p<0.01) than that of BubR1+/+ mice (1.00±0.67; Fig. 2A). BubR1 expression (0.62±0.26, p<0.05) was significantly decreased in aged mice compared with young mice (1.00±0.26; Fig. 2B). Fig. 2C revealed an alteration of BubR1 mRNA expression after PHx in BubR1L/L mice and BubR1+/+ mice. In BubR1+/+ mice, BubR1 mRNA expression was significantly increased after PHx and reached a maximum level 48 h after PHx (18.55±6.92). In BubR1L/L mice, the expression level was low, similar to that observed in untreated
BubR1L/L mice. In addition, BubR1 expression was delayed in BubR1L/L mice.
The LW/BW was compared in BubR1+/+ and BubR1L/L mice (Fig. 2D), and in young and aged mice (Fig. 2E). In all groups, LW/BW was significantly decreased 12 h after PHx. LW/BW was significantly lower in BubR1L/L mice (0.025±0.006, p<0.05) compared with BubR1 +/+ mice
(0.034±0.006) 48 h after PHx (Fig. 2D), and significantly lower in aged mice (0.033±0.002, p<0.05) compared with young mice (0.037±0.001) 144 h after PHx (Fig. 2E). The delay in liver regeneration did not cause significant change in mortality between BubR1+/+ and BubR1L/L mice at any time point after PHx.
Biochemical analysis during liver regeneration.
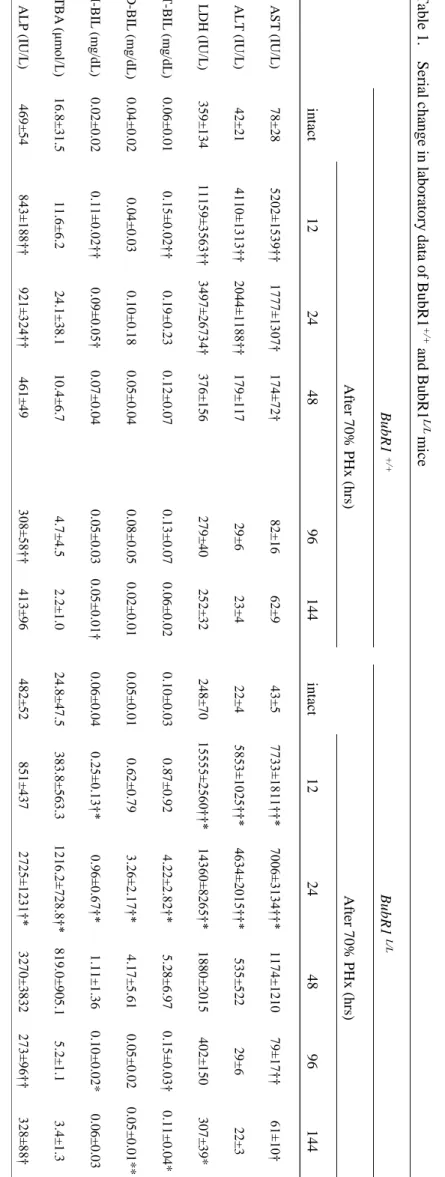
Tables 1 and 2 show serial changes in laboratory data of mice with PHx. Plasma AST, ALT and LDH levels were dramatically increased 12 h after PHx in BubR1L/L and BubR1+/+ mice, and these values were significantly higher in BubR1L/L mice than in BubR1+/+ mice 12‒24h after PHx (Table 1). In addition, plasma T-BIL, D-BIL, I-BIL, TBA and ALP levels were significantly higher in BubR1L/L mice 24 h after PHx. These data indicate that, in BubR1L/L mice, impaired liver function continues for a longer period compared with BubR1+/+ mice. The effect of aging on liver dysfunction after PHx was also examined, and levels of plasma AST, ALT and LDH 24‒48 h after PHx were significantly greater in aged mice than those in young mice (Table 2).
18
BubR1 insufficiency caused an abnormal cell-cycle progression in hepatocyte after partial hepatectomy.
To investigate the underlying mechanisms of impaired liver regeneration in BubR1L/L mice, I examined alterations of proliferation markers after PHx (Fig. 3A, B). In BubR1+/+ mice, the number of PCNA-positive hepatocytes (185.7±63.5 vs. 1.69±2.16, p<0.01) and those undergoing mitosis (16.9±10.7 vs. 2.59±5.80, p<0.05) significantly increased 48 h after PHx compared with those 12 h after PHx. Such increases of both values were not observed in BubR1L/L mice (PCNA, 54.3±56.7; mitosis, 2.0±2.9). Fig. 3C shows the representative liver sections at 12, 24, 48, 96, 144 hours after PHx stained for PCNA in BubR1L/L and BubR1+/+ mice. The peak of hepatocyte proliferation is observed 48 h after PHx in normal mice (Lehmann et al. 2012). Slow progression of hepatocyte proliferation was evident in BubR1L/L mice 48 h after PHx and thereafter.
Based on reduced hepatocyte proliferation, I also investigated cyclin-D, cyclin-E, cyclin-A and cyclin-B mRNA expression levels (Fig. 3D). In BubR1L/L mice, cyclin-D (0.93±0.44, p<0.05), cyclin-A (0.23±0.07, p<0.01) and cyclin-B (0.10±0.05, p<0.01) mRNA expression levels were significantly lower compared with those of BubR1+/+ mice (1.71±0.47, 0.87±0.27 and 0.32±0.13, respectively) 12 h after PHx. The expression patterns of cyclin-D in BubR1+/+ and BubR1L/L mice were different: two peaks at 12 and 48 h after PHx were observed in BubR1+/+ mice while a single but broader peak was observed in BubR1L/L mice. In BubR1+/+ mice, cyclin-A and cyclin-B mRNA expression showed remarkable increases 48 h after PHx, and rapidly decreases 96 h after PHx. Cyclin-B mRNA expression was significantly attenuated in BubR1L/L mice (5.6±4.6, p<0.05)
compared with BubR1+/+ mice (21.3±12.5) 48 h after PHx. These low expression levels continued up to 144 h after PHx without a rapid decrease. Similar patterns were observed in the expression of cyclin-A. Cyclin-E mRNA expression was significantly higher in BubR1L/L mice (1.4±0.4, p<0.05) compared with BubR1+/+ mice (0.8±0.4) 24 h after PHx.
I also examined the expression of a CDK inhibitor, p21 (Fig. 3E). In BubR1L/L mice, p21 mRNA expression (3.51±1.51, p<0.05) was significantly higher than that in BubR1+/+ mice (1.74±0.76) 24 h after PHx. I also examined the mRNA expression of p16INK4a, another CDK
19
inhibitor, because it is reported that down-regulation of BubR1 causes up-regulation of p16 INK4a expression and induces cellular senescence (Baker et al. 2008, Baker et al. 2011). In my study, however, p16 INK4a mRNA expression was too low to detect in mice (data not shown). Moreover, I analyzed levels of HGF that is known to play an important role in driving liver regeneration (Michalopoulos 2007). There was no significant difference in the level of liver HGF between
BubR1+/+ and BubR1L/L mice (Fig. 3F).
BubR1 insufficiency increases hepatocyte necrosis accompanied with intercalated disc abnormality.
There were no detectable differences in liver histology between intact BubR1+/+ and
BubR1L/L mice (data not shown). In BubR1L/L mice, focal hepatic necrosis was observed 12‒96 h after PHx and the number of necrotic foci in the liver tissue of BubR1L/L mice (2.95±1.11, p<0.01) was significantly higher than in the BubR1+/+ mice (0.23±0.61; Fig. 4A) at 24 h after PHx. Also the necrosis area in BubR1L/L mice (0.016±0.005, p<0.05) was significantly larger than in the BubR1+/+ mice (0.010±0.004; Fig. 4B) at 24 h after PHx. The necrosis area in BubR1L/L mice showed a maximum at 24 hours and then gradually decreased. The necrotic foci scattered in liver lobule and it was characterized by necrotic hepatocytes and dilation of perisinusoidal spaces with hemorrhage (Fig. 4C, D).
Fig. 4E shows transmission electron microphotographs of hepatic tissue obtained from
BubR1+/+ (panels a1 and a2) and BubR1L/L mice (panels b1 and b2) 12 h after PHx. Compared with
BubR1+/+ mice, BubR1L/L mice showed wider intercellular spaces. Observation at higher
magnification revealed a wider perisinusoidal space containing atrophic microvilli and dispatched intercalated disks (IDs) (white arrows) in the hepatic tissue of BubR1L/L mice (panel b2). In addition, hepatocyte mitochondria were severely swollen and electron-lucent. In BubR1L/L mice 12 h after PHx, the number of damaged hepatocytes was higher than in BubR1+/+ mice, and these features were not observed in BubR1L/L mice without PHx (data not shown). These histopathological findings suggest that in BubR1L/L mice, abnormal structural intercellular alterations are accompanied by hepatocyte necrosis after PHx.
20
Effects of low BubR1 expression on desmocollin-1 expression.
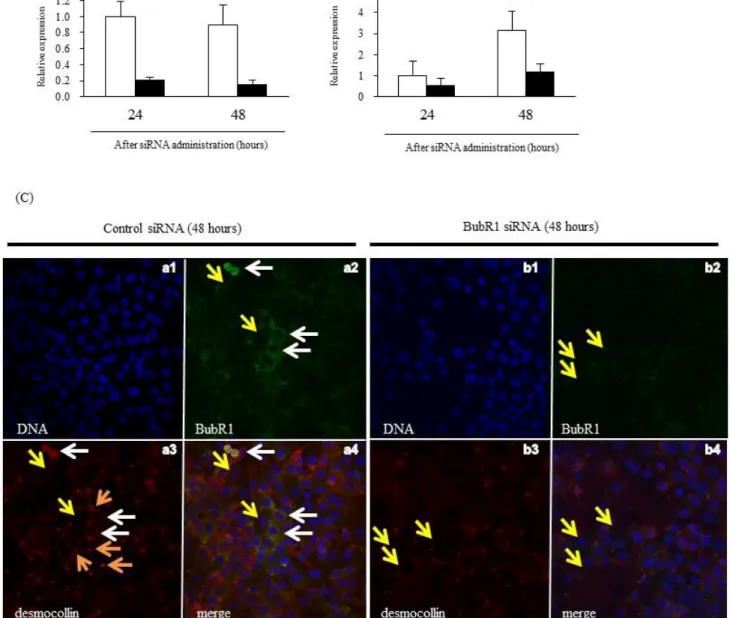
To investigate a possible mechanism of liver injury and impaired liver regeneration, I studied the effect of low BubR1 expression on desmocollin-1 (DSC1) expression in mouse liver tissue and HaCaT cells. Immunohistochemical examination revealed that DSC1 expression in the liver was attenuated after PHx in BubR1 L/L mice compared with Bub1R+/+ mice (Fig. 5A). Western blot analysis of the liver extracts also revealed that in BubR1L/L mice, DSC1 protein expression (0.36±0.18, p<0.05) was significantly decreased 24 h after PHx compared with BubR1+/+ mice (0.78±0.26) (Fig. 5B). I then examined the effect of BubR1 siRNA on DSC1 expression in HaCaT cells. BubR1 expression was significantly decreased 24 and 48 h after transfection (siRNA(+) vs. siRNA(−) at 24 h; 0.21±0.03 vs. 1.00±0.19, p<0.01, and at 48 h; 0.16±0.05 vs. 0.89±0.25, p<0.01; Fig. 6A). DSC1 mRNA
expression was also attenuated and significantly inhibited 48 h after transfection (siRNA(+) vs. siRNA(−); 1.19±0.39 vs. 3.16±0.89, p<0.01; Fig. 6B). These results suggest that BubR1 regulates DSC1 expression in hepatocytes. To demonstrate the effect of BubR1on junctional formation in HaCaT cells treated with and without BubR1 siRNA, I performed confocal laser scanning microscopy analysis using combined BubR1/desmocollin-1/DNA staining. Fig. 6C shows confocal laser
microphotographs of HaCaT cells treated with control siRNA (panels a1, a2, a3, and a4 ) and BubR1 siRNA (panels b1,b2,b3, and b4) 48 h after BubR1 siRNA. Panels a2 and a3 show positive correlation between expression of BubR1 and DSC1. White arrows indicate high expression of BubR1 and DSC1 (panels a2, a3, and a4) in parallel. Yellow arrows indicate low expression of BubR1 and DSC1 (panels a2, a3, a4, b2, b3, and b4) in parallel. Compared with control siRNA (panel a3), BubR1 siRNA (panel b3) showed small number of red dots structure which indicate desmosome junction between cells (orange arrows). These confocal laser scanning microscopy findings suggest that BubR1 expression could correlate with DSC1 expression and affect desmosome junctional formation.
21
Figure 2. Alterations in BubR1 mRNA expression and liver weight (LW)/body weight (BW) ratio.
(A) BubR1 mRNA expression in intact BubR1+/+ (□) and BubR1L/L (■) mice. (B) BubR1 mRNA expression in intact 9-week-old ( ) and 55-week-old ( ) C57BL/6JJcl mice. (C) Changes in BubR1 mRNA expression in BubR1+/+ (□) and BubR1L/L (■) mice after PHx. Relative expression level to unhepatectomized BubR1+/+ mice is shown. (D) Changes in LW/BW in BubR1+/+ (□) and BubR1L/L (■) mice after PHx. (E) Changes in LW/BW in 9-week-old ( ) and 55-week-old ( ) C57BL/6JJcl mice. Data are presented as the mean ± S.D. †p<0.05, ††p<0.01 vs. intact mouse in each group. *p<0.05, ** p<0.01 vs. BubR1+/+ mice at each sampling point.
22 Tabl e 1. Ser ial cha nge i n l abor at or y dat a of B ubR 1 +/+ a nd B u bR 1 L /L m ice B u b R 1 + /+ B u b R 1 L/L Af ter 7 0 % P Hx ( h rs ) Af ter 7 0 % P Hx ( h rs ) in ta ct 12 24 48 96 144 in tact 12 24 48 96 144 A S T (IU/L ) 7 8 ±2 8 52 02 ±1 53 9† † 17 77 ±1 30 7† 17 4± 72 † 8 2 ±1 6 6 2 ±9 4 3 ±5 77 33 ±1 81 1† †* 70 06 ±3 13 4† †* 1 1 7 4 ±1 2 1 0 79 ±1 7† † 61 ±1 0† ALT (IU/L ) 4 2 ±2 1 41 10 ±1 31 3† † 20 44 ±1 18 8† † 1 7 9 ± 1 1 7 2 9 ±6 2 3 ±4 2 2 ±4 58 53 ±1 02 5† †* 46 34 ±2 01 5† †* 5 3 5 ± 5 2 2 2 9 ±6 2 2 ±3 L DH (IU/ L ) 3 5 9 ± 1 3 4 11 15 9± 35 63 †† 34 97 ±2 67 34 † 3 7 6 ± 1 5 6 2 7 9 ± 4 0 2 5 2 ± 3 2 2 4 8 ± 7 0 15 55 5± 25 60 †† * 14 36 0± 82 65 †* 1 8 8 0 ±2 0 1 5 4 0 2 ± 1 5 0 3 0 7 ± 3 9 * T -BI L ( m g /d L ) 0 .0 6 ±0 .0 1 0.1 5±0 .0 2† † 0 .1 9 ±0 .2 3 0 .1 2 ±0 .0 7 0 .1 3 ±0 .0 7 0 .0 6 ±0 .0 2 0 .1 0 ±0 .0 3 0 .8 7 ±0 .9 2 4 .2 2 ±2 .8 2† * 5 .2 8 ±6 .9 7 0.1 5±0 .0 3† 0 .1 1 ±0 .0 4 * D -BIL ( m g /d L ) 0 .0 4 ±0 .0 2 0 .0 4 ±0 .0 3 0 .1 0 ±0 .1 8 0 .0 5 ±0 .0 4 0 .0 8 ±0 .0 5 0 .0 2 ±0 .0 1 0 .0 5 ±0 .0 1 0 .6 2 ±0 .7 9 3.2 6±2 .1 7† * 4 .1 7 ±5 .6 1 0 .0 5 ±0 .0 2 0 .0 5 ±0 .0 1 * * I-BIL ( m g /d L ) 0 .0 2 ±0 .0 2 0.1 1±0 .0 2† † 0.0 9±0 .0 5† 0 .0 7 ±0 .0 4 0 .0 5 ±0 .0 3 0 .0 5 ±0 .0 1† 0 .0 6 ±0 .0 4 0.2 5±0 .1 3† * 0.9 6±0 .6 7† * 1 .1 1 ±1 .3 6 0 .1 0 ±0 .0 2 * 0 .0 6 ±0 .0 3 T B A (μ m ol/ L ) 1 6 .8 ±3 1 .5 1 1 .6 ±6 .2 2 4 .1 ±3 8 .1 1 0 .4 ±6 .7 4 .7 ± 4 .5 2 .2 ± 1 .0 2 4 .8 ±4 7 .5 3 8 3 .8 ± 5 6 3 .3 12 16 .2 ±7 28 .8 †* 8 1 9 .0 ± 9 0 5 .1 5 .2 ± 1 .1 3 .4 ± 1 .3 AL P (IU/L ) 4 6 9 ± 5 4 84 3± 18 8† † 92 1± 32 4† † 4 6 1 ± 4 9 30 8± 58 †† 4 1 3 ± 9 6 4 8 2 ± 5 2 8 5 1 ± 4 3 7 27 25 ±1 23 1† * 3 2 7 0 ±3 8 3 2 27 3± 96 †† 32 8± 88 † PH x, par tia l h epa tec tom y ; A ST , a spa rat e: 2 -oxog lut ar at e am inot ra nsf er ase ; A L T , al an ine :2 -oxog lut ar at e am inot rans fer as e; LD H , l ac tat e dehy dr og ena se ; T -B IL, tot al b ili ru bi n ; D -B IL, d ir ec t bi lir ub in; I -B IL, indi re ct bi lir ubi n; T B A , tot al bi le a ci d; A LP , al k al ine ph ospha tas e † p<0.05, † † p < 0.01 v s e ac h i nt ac t, * p < 0.05, ** p <0.0 1 v s BubR 1 +/+ m ice 22
23 T ab le 2. Se ri al ch ang e i n la bor at or y da ta o f y oung and ol d m ice . y o u n g ( 9 -w ee k -o ld ) ag ed ( 5 5 -w ee k -o ld ) Af ter 7 0 % P Hx ( h rs ) Af ter 7 0 % P Hx ( h rs ) in tact 24 48 96 144 in tact0 24 48 96 144 A S T (IU/L ) 3 0 ±2 26 40 ±1 02 9† † 19 1± 50 †† 94 ±1 6† † 7 7 ±3 1 5 2 ±2 8 * * 51 26 ±1 21 2† †* 40 2± 67 †† ** 8 7 ±8 7 1 ±6 ALT (IU/L ) 1 5 ±2 25 28 ±7 28 †† 16 9± 56 † 36 ±7 †† 3 4 ±1 5 3 1 ±1 9 * * 44 51 ±9 99 †† * 61 1± 13 2† †* * 5 1 ±1 2 2 8 ±5 L DH (IU/ L ) 1 8 5 ± 1 8 62 99 ±3 07 2† 38 2± 70 †† 52 7± 10 2† † 2 2 8 ± 9 2 3 0 5 ± 6 1 * 13 59 2± 50 59 †* 64 5± 60 †† ** 3 1 4 ± 5 * 3 2 5 ± 1 2 1 PH x , par tial hepat ect om y ; A ST , as p ar at e: 2 -oxogl ut ar at e am inot rans fer as e; A L T, al an ine: 2 -oxo gl ut ar at e am inot rans fer as e; L D H , l act at e d ehy dr ogenas e; T -BIL , tot al bi lir ubi n; D -BIL , di rec t bi lir ubi n; I -B IL , i nd ir ec t bi lir ubi n; TB A , t ot al bi le a ci d; A L P , al k al ine pho sp h at as e † p <0.05, † † p < 0.01 v s e ac h i nt ac t, * p < 0.05, ** p <0.0 1 v s y oun g m ice 23
24 Figure 3. Changes in proliferation markers after PHx.
25
(A) PCNA-positive cells, (B) cells undergoing mitosis. (C) Representative liver sections at 12, 24, 48, 96, 144 hours after PHx stained for PCNA. (magnification ×200): arrowhead, cells undergoing mitosis. (D) cyclin D, cyclin E, cyclin A and cyclin B mRNA expression, (E) p21 mRNA expression, (F) HGF level in BubR1+/+ (□); BubR1L/L (■); data are presented as the mean ± S.D. †p<0.05, ††p<0.01 vs. intact mouse in each group. *p<0.05, ** p<0.01 vs. BubR1+/+ mice at each sampling point.
26 Figure 4. Histopathological data.
27
(A) Necrosis score and (B) necrosis area after PHx: BubR1+/+ (□); BubR1L/L (■); data are expressed as the mean ± S.D. †p<0.05, ††p<0.01 vs. 12 h after PHx. **p<0.01 vs. BubR1+/+ mice at each sampling point. (C) Representative altered liver histopathology at 24 h after PHx with HE staining (magnification ×40): arrowhead, necrosis foci. Scale bars: 500 µm (D) Representative necrosis foci histopathology at 24 h after PHx in BubR1L/L mice: Left, HE staining; right, silver impregnation (magnification ×400); arrow, necrotic hepatocytes; arrowhead, dilation of perisinusoidal spaces with hemorrhages. (E) Transmission electron microphotographs of hepatic tissue obtained from BubR1+/+ (panels a1 and a2) and BubR1L/L (panels b1 and b2) mice 12 h after PHx. Compared with BubR1+/+ mice, BubR1L/L mice displayed a wider intercellular space. Observation at higher magnification revealed a wider perisinusoidal space containing atrophic microvilli and dispatched intercalated discs (white arrows) in the hepatic tissue of BubR1L/L mice (panel b2). In addition, hepatocyte mitochondria were severely swollen and electron-lucent. Nucl, nucleus; MV, microvilli; Mt, mitochondria; white arrows, intercalated disc. Scale bars: 5 µm in panels a1 and b1; 1 µm in panels a2 and b2
28 Figure 5. DSC1 expression in hepatocytes after PHx.
(A) Immunohistochemical staining of DSC1: red staining indicates DSC1 at the intercalated disc. (B) Western blotting data of DSC1: upper panel shows representative data for DSC1; BubR1+/+ (□);
29
Figure 6. Effect of BubR1 siRNA on DSC1 expression in HaCaT3 cells.
(A) Expression of BubR1 and (B) DSC1 mRNA after BubR1 siRNA transfection; control siRNA (□); BubR1 siRNA (■); data are mean ± S.D. **p<0.01 vs. control siRNA at each sampling point. (C) BubR1 siRNA reduced DSC1 expression and disarrayed HaCaT cells.
Control (panel a1, a2, a3, and a4) and BubR1 siRNA mediated (panel b1, b2, b3, and b4) HaCaT cells were stained using BubR1 (green)- and DSC1-specific antibodies (red) and analyzed by conforcal laser scanning microscopy. DNA was visualized by DAPI staining (blue). Representative
30
experimental results are shown. White arrows indicate high expression of BubR1 and DSC1. Yellow arrows indicate low expression of BubR1 and DSC1. Compared with control siRNA (panel a3), BubR1 siRNA (panel b3) showed small number of red dots structure which indicate desmosome junction between cells (orange arrows).
31 Discussion
Aging delays liver regeneration after hepatectomy leading to postoperative liver failure and worsening general condition, which critically affect the patient’s prognosis. Although this
phenomenon was reported over 50 years ago, the molecular mechanism for the loss of regenerative capacity in aged livers has not been fully elucidated (Timchenko 2009).
Novel findings in this study are summarized as follows: (1) BubR1 insufficiency delays liver regeneration after PHx possibly because of transient impairment of G1-S cell cycle progression; (2) microscopic observation of BubR1L/L mice liver shows increased necrotic hepatocytes.
Transmission electron microphotographs of hepatic tissue also show increased necrotic hepatocytes accompanied by intercalated disc (ID) abnormality; and (3) I demonstrated, for the first time, that BubR1 controls expression of DSC1, a transmembrane cell adhesion protein in desmosomes. The increase in levels of DSC1, which is expressed in the desmosome, was suppressed in BubR1L/L mice liver after PHx. In addition, down-regulation of BubR1 expression with siRNA reduced DSC1 expression in HaCaT cells. These findings provide evidence for a possible molecular mechanism by which aging impairs liver regeneration after hepatectomy.
BubR1 is a key molecule in the spindle assembly checkpoint during mitosis (Yu 2002). Previous studies demonstrated that BubR1 insufficiency in mice caused phenotypic changes that are similar to those found in aging mice (Baker et al. 2004, Matsumoto et al. 2007, Baker et al. 2008, Baker et al. 2011). At the early stage (48 h after PHx) of the liver regeneration, BubR1 mRNA
expression was significantly increased in WT mice (BubR1+/+), suggesting that BubR1 is an important molecule involved in this process. Regeneration assessed by the increased LW/BW after PHx
indicates impaired liver regeneration in BubR1L/L mice. Aged WT mice also showed impaired liver regeneration, and I observed that BubR1 expression in intact liver significantly decreased in aged mice compared with young mice. These observations indicate that transient delayed liver regeneration after hepatectomy is associated with reduced BubR1 expression and other factor such as EGF and FoxM1B may affect sustained delayed liver regeneration in aged mice (Schmucker et al. 2011). It was previously observed in the senescent liver that activity of ALT, AST, and all types of bilirubin was
32
increased in the blood of partially hepatectomized aged mice as a result of liver dysfunction (Schmucker 2005). The reduced BubR1 expression level itself did not affect circulating hepatic enzyme levels or liver weight and morphology in untreated BubR1L/L mice (data not shown), ruling out the possibility that the reduction of BubR1 expression contributes to alterations of liver function and size in BubR1L/L mice (Fig. 1D, Table 1). Thus, my results suggest that age-related inhibition of liver regeneration may be attributed to the reduction in BubR1 expression (Haga et al. 2010, Gregg et al. 2012, Sanchez-Hidalgo et al. 2012).
Hepatocytes are normally quiescent cells. The initiation of hepatocyte proliferation or liver regeneration after hepatectomy requires activation of the mitogenic genes and repression of genes responsible for inhibiting hepatocyte proliferation (Su et al. 2002). Fewer hepatocytes in older animals and humans enter the S-phase after partial hepatectomy compared with younger subjects (Schmucker et al. 2011). In mice, a sharp peak of hepatocyte proliferation is usually observed at 48 h post-PHx (Lehmann et al. 2012), but such steep increase and decrease were not observed in BubR1L/L mice. Instead, a few cells initiated proliferation and mitosis 48 h after PHx, and continued to
proliferate up to 144 h. These findings suggest that hepatocyte proliferation after PHx was delayed in
BubR1L/L mice. As a result, delayed cyclin gene expression was observed in hepatectomized BubR1L/L mice. Comparison of cyclin-D expression patterns in BubR1+/+ and BubR1L/L mice revealed an apparent delay in cyclin-D induction after PHx in BubR1L/L mice. Increasing of cyclin-D and –E expression accelerate the G1/S phase transition (Resnitzky et al. 1994). At 24 h after PHx, cyclin-D and –E expression levels in BubR1L/L mice were higher than in BubR1+/+ mice, it suggested that G1/S phase cells accumulated in Bub1b L/L mice. Cyclin-A and -B expression levels increase in late S phase and peak in G2 of normal cells (Muschel et al. 1993). While cyclin-A and -B peak expression levels were observed at 48 h after PHx in BubR1+/+ mice, moderate cyclin-A and -B expression was induced at 48 h after PHx in BubR1L/L mice, and remained constant up to 144 h. These patterns were the same as those of the mitotic and PCNA-positive indices hepatocytes in hepatectomized BubR1L/L mice. These results suggested that fewer proliferating hepatocytes may result from a delay in cell cycle progression in BubR1L/L mouse hepatocytes. I also found that p21 expression was higher in BubR1L/L
33
than BubR1+/+ mice at 24 h post-PHx. p21 is a CDK inhibitor that hampers the activity of cyclin-E/CDK2 and cyclin-D/CDK4/6 complexes (Wang et al. 2002). Therefore, my results suggest that arrest and/or delay of cell cycle progression from G1 to S phase occurred in hepatocytes in the partially hepatectomized BubR1L/L mice. Several studies demonstrate that p21 plays a key role during liver regeneration, such as in the acute liver injury model (Hui et al. 2002) and in the extended hepatectomy model (Lehmann et al. 2012). Moreover there was no difference in the HGF protein content between BubR1+/+ mice and BubR1L/L mice, it suggested that both mice had received the equivalent to the stimulation of cell proliferation. Therefore these studies demonstrated up-regulation of p21 accompanied by a delay in cell cycle progression, which is consistent with my results in
BubR1L/L mice.
Microscopic observation revealed that after PHx, necrosis but not apoptosis of hepatocytes was strongly induced in BubR1L/L mice compared with BubR1+/+ mice. These observations were consistent with a biochemical analysis of blood in BubR1L/L mice. The activities of ALT, AST and all types of bilirubin were increased in partially hepatectomized BubR1L/L mice. Such increases are observed in the clinical condition when liver regeneration is impaired in the patients after PHx. In the regenerating liver, epithelial cells require physical contact with extracellular matrix to avoid the detachment induced cell death (DICD) of hepatocytes. After PHx, the reconstitution of a
perisinusoidal extracellular matrix stabilizes the newly formed hepatocyte population. Thus, necrosis that is observed in partially hepatectomized BubR1L/L mice might be the result of excessive DICD caused by failure of perisinusoidal extracellular matrix reconstitution.
Morphological analysis of livers from BubR1L/L mice demonstrated a widened interhepatocyte space, shrinking hepatocytes, a widened perisinusoidal space and atrophy of microvilli in the early stages after PHx, suggesting that partial microstructure failure results from a weak adaptation to changed microcirculatory flow by PHx in BubR1L/L mice. Hepatocytes connect via intercellular junctions called IDs to form liver cell plates. IDs are composed of different types of junctional complexes, including gap-junctions made of connexins, tight- and adherens-junctions, and desmosomes. Desmosomes are button-like structures composed of intracellular anchor proteins and
34
transmembrane adhesion proteins. The intracellular anchor proteins play a role in connecting the cytoskeleton to the transmembrane adhesion proteins including desmocollin, a member of the cadherin family. Desmosomes maintain the integrity of cells to resist mechanical stress, and have dynamic structures whose adhesiveness can switch between high and low affinity adhesive states during cell division, thereby participating in fundamental processes such as cell proliferation, differentiation and morphogenesis (Garrod et al. 2008). Thus, it is possible that the weakened cell attachment observed in the hepatectomized BubR1L/L mice could be caused by desmosome abnormality. There are multiple components to hepatocyte junctions. I evaluated expression of occludin located at the tight junctions, E-cadherin located at the adherent junctions, DSC1 and desmoglein in mouse liver. Expression of occludin, E-cadherin, and desmoglein was not so
remarkably different between BubR1L/L mice and BubR1+/+ mice by immunohistochemistry (data not shown). Expression of desmocollin-1 was remarkably different in control cells compared with BubR1 reduced cells in vitro and in mouse liver. DSC1, a desmosome transmembrane cell adhesion protein, is highly expressed in the liver (Donetti et al. 2004). I showed that up-regulation of DSC1 expression after PHx was not observed in BubR1L/L mice. I also demonstrated that small interfering RNA-mediated down-regulation of BubR1 suppressed DSC1 expression in HaCaT cells which is well known that both mRNA and protein are abundant. These results suggest that BubR1 could be a critical regulating factor for DSC1 expression. My hypothesis is that DSC1 could be a target protein which is ubiquitinated by APC/C for the degradation by the proteasome. To investigate this
hypothesis, I examined the DSC1 protein expression under APC/C inhibitor by Western blot. Western blot showed that APC/C inhibitor upregulated the DSC1 expression same as securin with which BubR1 directly interacts in vitro and in vivo (manuscript in preparation). My speculation is that DSC1 is one of the proteins that are ubiquitinated by APC/C and, thus may be one of the targets of BubR1. However, to further explore the relationship between a cell cycle checkpoint protein and a junctional protein are needed. The reduced DSC1 level could cause abnormal cell attachment and delay liver regeneration in BubR1L/L mice.
35
Based on these findings, I propose a possible scenario that occurs after PHx in aged
individuals. Hepatectomy induces many stresses, including physical stress and cell division-associated stress. After hepatic resection, portal hypertension occurs because the vascular network in the remnant lobes is reduced despite constant blood flow from the portal vein (Bosch et al. 1992). The liver cells and liver sinusoidal endothelial cell attachment are affected by these stresses during liver regeneration after hepatectomy (Sato et al. 1997), leading to transient DICD and G1 arrest to prevent an excessive DICDs. DSC1 expression also increases, thus leading to reinforcement of desmosomes to maintain cell attachments, which is an important process to prevent massive DICD and anokisis, and thus focal necrosis of hepatocytes. In the case of low BubR1 expression, the increased level of DSC1 expression is not enough to reinforce the desmosome after PHx, leading to increased DICD and anokisis, and thus resulting in hepatocyte focal necrosis. Impairment of cell attachment induces DICD and G1 arrest in a p21-dependent manner (Collins et al. 2005). Therefore, the delayed G1/S progression occurs through up-regulation of p21 caused by secondary effects from the failure of DICD reinforcement because of a DSC1 abnormality, rather than via a direct effect of low BubR1 level. Thus, delayed liver regeneration could occur after PHx in aged patients.
In summary, BubR1 insufficiency causes delayed liver regeneration after partial
hepatectomy. BubR1 expression is reduced along with aging. BubR1 insufficiency reduces DSC1 expression in the liver, and thus weakens the microstructural adaptation of the tissue against hepatectomy. BubR1 insufficiency, thus, enhances transient liver failure and injury through the cell cycle delay caused by up-regulation of p21 that results from the weakened microstructural adaptation. Therefore, hepatocyte proliferation is delayed and liver regeneration could be impaired. This work provides new insights into the role of BubR1 in liver regeneration, which may explain worsening liver function after hepatectomy in aged patients.
36
Chapter 2
37
Introduction
In 1891, von Hansemann et al. have first observed a numerical chromosome aberration, DNA aneuploidy, in malignant tumors (Hansemann 1891). Previous studies have revealed that significant parts of tumors exhibit DNA aneuploidy and tumors with DNA aneuploidy are
significantly correlated with poor cancer prognosis (Cimini 2008). Although extensive efforts have been made to unveil the mechanism causing DNA aneuploidy, it is still not totally understood.
The appropriate expression of spindle assembly checkpoint (SAC) factors may be one important factor to maintain chromosome stability. SAC is a surveillance system controlling the segregation of sister chromatids to daughter cells in mitosis (Musacchio et al. 2007). Overexpression or downregulation of SAC factors may cause an aberrant SAC function, an unequal segregation of chromosomes and DNA aneuploidy (Michel et al. 2001, Wang et al. 2004, Baker et al. 2006, Sotillo et al. 2007, Ando et al. 2010). Consistently, DNA aneuploidy is often found in various tumors with abnormal expression of SAC factors (Perez de Castro et al. 2007).
The p53 signaling pathway is a major suppressor of chromosome instability (Aylon et al. 2011). The p53 controls the transcription of cell cycle checkpoint factors, such as p21, and regulates cell cycle progression at G1-S or G2-M transitions (Levine 1997). The p53 also regulates BubR1 and Mad2 expression and suppresses centrosome amplification (Oikawa et al. 2005, Schvartzman et al. 2011) or aneuploidy. The correlation between abnormal p53 status and DNA aneuploidy has been observed in various human tumors (Ando et al. 2010, Kudela et al. 2012).
Aerobic metabolism, with its advantages of high levels of energy production, is essential for all the organisms exposed to oxidative stress (OS). However, OS causes DNA damage, and is an indirect cause of mutations, gene deletions, and chromosome instability that may lead to malignant transformation. OS is also suggested to contribute to an increase in aneuploid cells (Gorla et al. 2001, Roh et al. 2012). However, how the p53 signaling pathway activated by OS suppresses aneuploidy is not fully understood. In this study, I found that BubR1 and Mad2 are downregulated by OS in p53-dependent manner. When p53 expression was suppressed by siRNA, the BubR1 and Mad2
38
Mad2, downregulation suppressed OS-induced polyploidization in p53 knocked down cells, suggesting that BubR1 could have novel function other than SAC to contribute to polyploidization. Moreover, from the analysis of clinical gastric cancer specimens, I found that tumor with positive staining of p53 and high expression of BubR1 tended to exhibit aneuploidy. These findings could provide one possible model for underlying mechanism for gastric carcinogenesis associated with DNA aneuploidy.
39
Materials and Methods
Reagents and antibodies
Potassium bromate (KBrO3) was purchased from Sigma-Aldrich (Gillingham, UK). The following antibodies were used: a rabbit polyclonal anti-phospho (ser15) p53 antibody (Cell Signaling Technology, Beverly, MA), a mouse monoclonal anti-p53 antibody (DAKO, Dako Cytomation, Glostrup, Denmark), a mouse monoclonal anti-p21 antibody (DAKO, Dako Cytomation, Glostrup, Denmark), a mouse monoclonal anti-BubR1 antibody (Clone 9, BD Transduction Laboratories, San Jose, CA, USA), a mouse monoclonal anti-Mad2 antibody (ImmuQuest, Cleveland, UK), a mouse monoclonal β-actin antibody (Sigma Aldrich, St. Louis, MO, USA), a mouse monoclonal anti-Lamin A/C antibody (Cell Signaling Technology, Beverly, MA), a rat monoclonal anti--tubulin antibody (Abcam, Cambridge, UK), an Alexa594-conjugated goat anti-rat IgG antibody and an Alexa488-conjugated goat anti-mouse IgG antibody (Invitrogen, Carlsbad, CA).
Cell culture
Human fibroblasts cells (MRC5) and gastric cancer cells (SNU-1, KATOⅢ) were obtained from ATCC (Manassas, VA, USA). Gastric cancer cells (MKN-45 and MKN-28) were obtained from Riken Cell Bank (Tsukuba, Japan). MRC5 cells were cultured in Eagle’s Minimum Essential Medium supplemented with fetal bovine serum (10% v/v), at 37 °C in a 5% CO2 environment. In my
experiments, I used MRC5 cells collected between passages 5 and 8. KATOⅢ, 45 and MKN-28 cells were cultures in Roswell Park Memorial Institute 1640 medium supplemented with fetal bovine serum (10% v/v), at 37 °C in a 5% CO2 environment.
Western blotting
Cells in the logarithmic growth phase were lysed in lysis buffer (0.5 % NP-40, 20 mM Tris– HCl, pH 8.0, 150 mM NaCl, 1 mM EDTA, and 1 % protease inhibitor cocktail (Nacalai Tesque, Inc., Kyoto, Japan). The protein content was determined using Bradford assay (Bio-Rad, Hercules, CA,
40
USA). The same amount of protein (8 g) was loaded on each lane. The immunoreactive bands were detected using the LAS3000 system (GE healthcare, Tokyo, Japan).
Quantification of mRNA in fibroblast cells using real-time PCR
Total RNA was isolated using ISOGEN (Nippongene, Tokyo, Japan) and cDNAs were synthesized from RNAs using SuperScript™ III First-Strand Synthesis SuperMix (Invitrogen, Carlsbad, CA) according to manufacturer’s instructions. Quantitative PCR amplification was performed using Applied Biosystems StepOnePlus™ real-time PCR system (Life Technologies, Tokyo, Japan) and a QuantiFast™ SYBR® Green PCR kit (QIAGEN, Hilden, Germany). The BubR1 and Mad2 transcript levels were determined using β-actin as an endogenous control. The
oligodeoxynucleotide primers were as follows: BubR1, 5′-CTCGTGGCAATACAGCTTCA-3′ (forward) and 5′-CTGGTCAATAGCTCGGCTTC-3′ (reverse)(Ando et al. 2010), Mad2, 5′- ACTTAAATATCTCCCTACCTATACTGAGTCAA-3′ (forward) and
5′-TAGTAACTGTAGATGGAAAAACTTGTGCTA-3′ (reverse) (Bottone et al. 2003) and -actin, 5′-CCACGAAACTACCTTCAAC--3′ (forward) and 5′-GATCTTCATTGTGCTGGG-3′ (reverse)(Ando et al. 2010).
Small interfering RNA transfection
MRC5 cells were transfected with 10 nmol/L small interfering RNA (siRNA) oligonucleotides using Lipofectamine RNAiMAX Reagent (Invitrogen) according to the manufacturer’s instructions. The following siRNA were used: p53
(5′-GAAAUUUGCGUGUGGAGUA-3′ ON-TARGETplus human TP53 siRNA, Dharmacon), BubR1 (5′-AAGGGAAGCCGAGCUGUUGAC-3′) (Dai et al. 2004) and Mad2 (SMARTpool: ON-TARGETplus MAD2L1 siRNA, Dharmacon). The ON-ON-TARGETplus Non-targeting Pool
(Dharmacon) was used as control. Cells were lysed for Western blotting 24-36 h after transfection.
41
Cells were trypsinized, washed with cold PBS, and fixed with 70% ethanol in PBS at −20 °C. Samples were washed with cold PBS, resuspended in propidium iodide solution (50 µg/ml) containing RNase A (1 mg/ml) and incubated at 37 °C for 30 min. Nuclear DNA content of 104 cells were analyzed using FACS calibur system (Becton Dickinson) with CellQuest software (BD
Biosciences Japan).
Fluorescence immunostaining
Cells were fixed with 4% paraformaldehyde and immunostained with antibodies against Lamin A/C and -tubulin. Double staining was done with Alexa488- and Alexa594-conjugated secondary antibodies and the nuclei were counterstained with 4′, 6-diamino-2-phenylindole (DAPI). Images were captured using a BIOREVO BZ-9000 fluorescence microscope (Keyence, Tokyo, Japan). I determined cells as binucleate based on the structure of microtubule and nuclear matrix.
Patients
A total of 182 unselected Japanese patients with primary gastric cancer, who underwent a gastrectomy between 1994 and 2006 at the Department of Surgery and Science, Graduate School of Medical Sciences, Kyushu University Hospital, Fukuoka, were included in this study. None of the patients had been treated preoperatively with cytotoxic drugs. Informed consent was obtained from each patient.
Immunohistochemical staining
Immunohistochemical staining was performed according to a previously described protocol (Ando et al. 2010). Briefly, the sections were placed in 10 mM citrate buffer (pH 6.0) and boiled in a microwave for epitope retrieval. Endogenous peroxidase activity was quenched by incubation in 0.3% H2O2. After the blocking with 10% goat serum in PBS, the sections were incubated with a primary antibody. Streptavidin–biotin–peroxidase staining was performed using Histofine SAB-PO (M)
42
immunohistochemical staining kit (Nichirei, Tokyo, Japan), according to manufacturer’s instructions. Sections were counterstained with Mayer’s hematoxylin and examined at magnification of 400×.
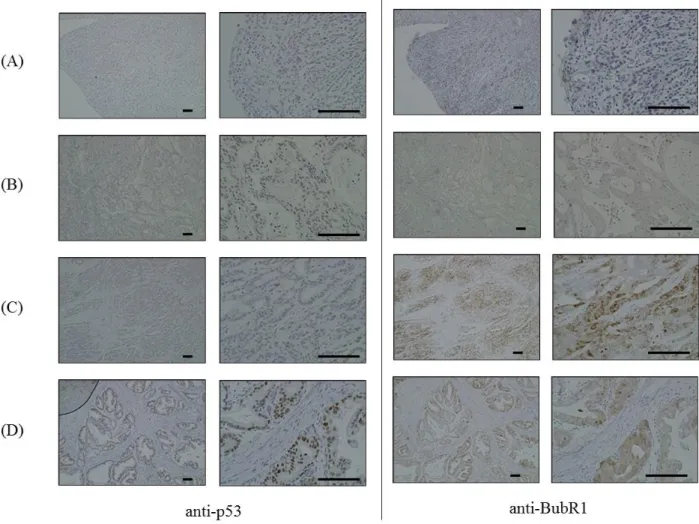
The p53 expression status was classified by examining immunostaining intensity as
previously described (Kakeji et al. 1993, Elledge et al. 1994). A distinct nuclear immunoreactivity for p53 was recorded as positive, and the nuclear staining pattern was usually diffuse. For tumors that showed heterogeneous staining, the predominant pattern was used for scoring. Cases with less than 10% of positively stained cancer cell nuclei were defined as negative, and the rest as positive (Fig.7).
The BubR1 expression status was analyzed by examining immunostaining intensity as previously described (Ando et al. 2010). BubR1 expression level in lymph follicles, which were equally stained in all samples, was assigned an expression score of 1. Weaker staining was assigned score of 0, and samples with stronger staining than that seen in the follicles were given score of 2 (Fig.7).
Analysis of DNA ploidy by Laser scanning cytometry
Nuclear DNA content of gastric cancer samples was measured using laser scanning cytometry (CompuCyte, Westwood, MA, USA) as described previously (Kamada et al. 1997). The samples came from the same paraffin-embedded blocks as those used for immunohistochemical staining. A DNA content histogram was generated and DNA ploidy was determined. DNA index (DI) was calculated according to previously published principles (Furuya et al. 2000). The nuclei were examined after each scan to exclude debris and attached nuclei from the analysis. The DI of G0/G1-phase of lymphocytes or fibroblasts was used as a reference DI = 1.0. Tumors with a DI <1.2 were defined as diploid; DI ≥1.2 or multi-indexed samples were defined as aneuploid.
43
Statistical analysis was performed using the JMP 8.0 statistical software package (SAS Institute, Cary, NC, USA). The Student’s t-test and Pearson's chi-square test were used wherever appropriate.
44
Results
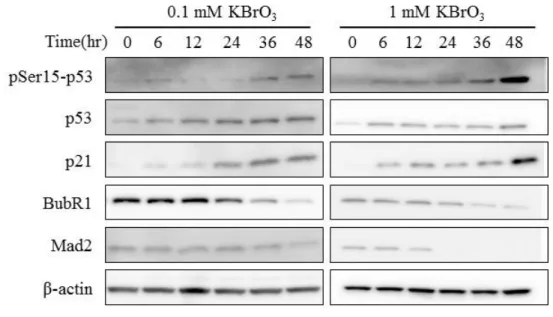
OS activated p53 signaling pathway and suppressed the expression of BubR1 and Mad2 Previous studies indicate that p53 could regulate BubR1 expression (Oikawa et al. 2005, Schvartzman et al. 2011). To examine the relationship of OS-activated p53 signaling pathway and BubR1 expression, I cultured human diploid fibroblast MRC5 cells in the presence of oxidant agent KBrO3 for as long as 48 h and analyzed the p53 signaling pathway and BubR1 expression by Western blot. As reported previously (Zhang et al. 2010), both low concentration (0.1 mM) and high
concentration (1 mM) of KBrO3 induced phosphorylation of p53 Ser15 and accumulation of p53 and p21 proteins (Fig. 8A). Concomitantly, KBrO3 suppressed BubR1 expression (Fig. 8A). To examine whether reactive oxygen species (ROS) was responsible for these events or not, I added ROS scavenger N-acetylcysteine (NAC) before MRC5 cells were exposed to 0.1 mM KBrO3. Neither KBrO3-induced accumulation of p53 and p21 protein nor decrease of BubR1 protein was observed in the presence of NAC (Fig. 8B). The expression of Mad2, another mitotic checkpoint protein, was also downregulated by KBrO3, (Fig. 8A) and the Mad2 downregulation was also cancelled by NAC (Fig. 8B). These observations indicate that OS activated p53 signaling pathway and suppressed the expression of BubR1 and Mad2 through the action of ROS.
OS-induced downregulation of BubR1 and Mad2 expression was p53 dependent
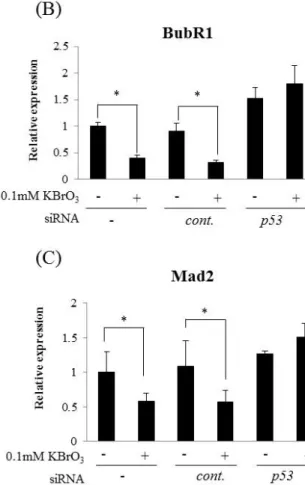
To examine the relevance of p53 signaling pathway for the decrease of BubR1 and Mad2 expression under OS, I used MRC5 cells in which p53 had been knocked down by its specific siRNA before exposure to KBrO3. Knockdown of p53 inhibited p21 protein expression (Fig. 9A). In this condition, the decrease of BubR1 and Mad2 protein under OS was not observed (Fig. 9A). OS-induced downregulation of BubR1 and Mad2 was detected also at mRNA level and p53 knockdown abrogated BubR1 and Mad2 mRNA downregulation (Fig. 9B and 9C). I also observed downregulation of BubR1 by KBrO3 in p53-proficient gastric cancer cell lines (MKN45 cell and SNU-1 cell), but not in p53-mutant or p53-null gastric cancer cell lines (MKN28 cell and KATOⅢ cell) (Fig.10). These