防災科学技術研究所
National Research Institute for Earth Science and Disaster Prevention
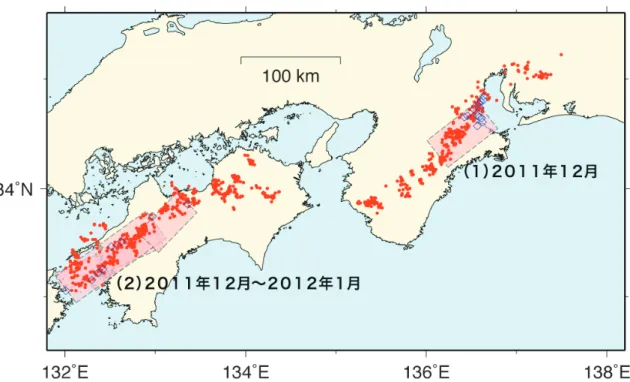
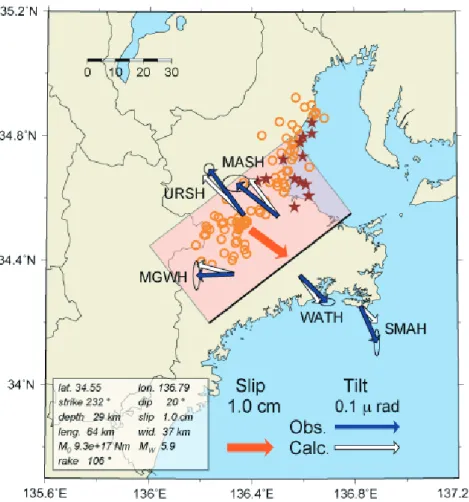
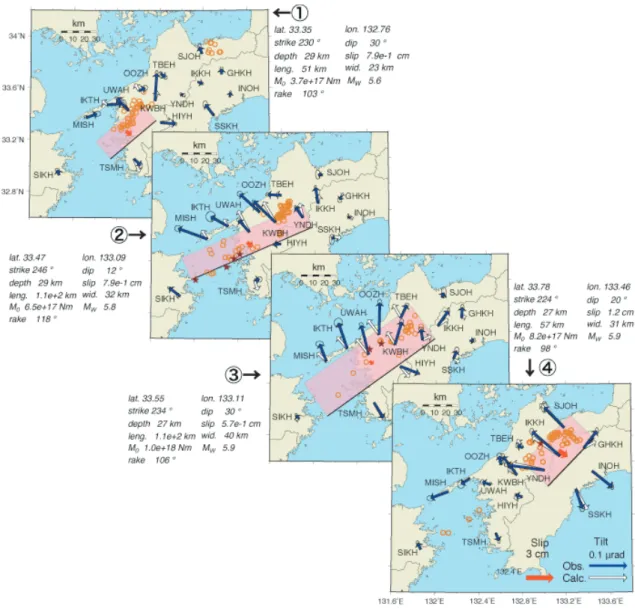
2011 年 11 月から 2012 年 4 月にかけて西南日本の深部低周波微動 1) に同期して発生した短期的ス ロースリップイベント2, 3) (SSE) について報告する. 第 1 図に今回報告する SSE をまとめた. これま でのイベントの履歴については,連絡会報1) を参照されたい. (1) 2011 年 12 月 紀伊半島北部 12 月 17 日から 22 日にかけて,三重県中部の観測点において,深部低周波微動と同期した SSE に よる傾斜変化がとらえられた (第 2 図). この 6 日間の傾斜変化ベクトル,そのデータから推定され た SSE の矩形断層モデル,およびそのモデルから計算される傾斜変化ベクトルを第 3 図に示した. この SSE は志摩半島北西部を中心とする領域に推定され,同期間に発生した微動および超低周波地 震5) (VLFE) の震央位置とよく一致する. 2011 年 6 月にほぼ同じ領域で Mw 5.7 の短期的 SSE が発生 しており6) ,その再来と考えられる. (2) 2011 年 12 月〜2012 年 1 月 四国西部 2011 年 12 月 24 日〜27 日に愛媛県西部で,2011 年 12 月 31 日〜2012 年 1 月 10 日に愛媛県西部〜中 部,高知県の観測点で,微動と同期した短期的 SSE による傾斜変化がとらえられた (第 4 図).微動 活動は2011 年 12 月 24 日頃から宇和付近で活発化した.28 日頃にいったん活動は低調になり,31 日 頃から河辺付近で再活発化した.さらに2012 年 1 月 3 日頃から豊後水道域でも活発化し,この活動 域は東に移動し西条付近まで達した.このような微動活動に対応し,傾斜記録にも時間的な変化が 捉えられている.そこで,第 4 図に示すように①〜④の 4 つの期間に分けて断層モデルを推定した. 第 5 図に推定結果を示す.期間①では愛媛県西部,期間②③では豊後水道から愛媛県西部,期間④ では愛媛県中部にすべり領域が推定され,いずれも微動および VLFE の震央位置とおおむね一致す る.また,これらは2011 年 7 月(Mw 5.6),2011 年 8 月(Mw 5.9)に発生した2つの SSE の領域を 含み6),期間①〜④の全体の規模はMw 6.2 となった. 謝辞 気象庁のホームページで公開されている気象台等の気象観測データを使用させていただきました. 記して感謝いたします. (木村武志・木村尚紀) Takeshi Kimura and Hisanori Kimura
9-2 西南日本における短期的スロースリップイベント (2011 年 11 月~2012 年 4 月)
Short-term slow slip events with non-volcanic tremor in southwest Japan
参考文献
1) 防災科学技術研究所, 西南日本における深部低周波微動活動 (2011 年 11 月~2012 年 4 月), 本連絡会 報, 本号.
2) Obara, K., H. Hirose, F. Yamamizu, and K. Kasahara, Episodic slow slip events accompanied by non-volcanic tremors in southwest Japan subduction zone, Geophys. Res. Lett., 31 (23), doi:10.1029/2004GL020848, 2004. 3) Hirose, H. and K. Obara, Repeating short- and long-term slow slip events with deep tremor activity around the
Bungo channel region, southwest Japan, Earth Planets Space, 57 (10), 961-972, 2005.
4) Tamura, Y., T. Sato, M. Ooe, M. Ishiguro, A procedure for tidal analysis with a Bayesian information criterion, Geophys. J. Int., 104, 507-516, 1991.
5) Ito, Y., K. Obara, K. Shiomi, S. Sekine, and H. Hirose, Slow Earthquakes Coincident with Episodic Tremors and Slow Slip Events, Science, 315, 503-506, 2007.
6) 防災科学技術研究所, 西南日本における短期的スロースリップイベント (2011 年 6 月~2011 年 10 月), 連絡会報, 87, 2012.
第1図 2011年11月~2012年4月の期間に検知された短期的SSE (ピンク矩形).同期間に発生した深部低周波微 動 (赤点) 及び VLFE の震央 (青菱形) を重ねて表示した.
Fig. 1 Distribution of SSEs detected from November, 2011 to April, 2012. Red dots and blue diamonds show epicenters of tremors and VLFEs, respectively.
第2図 2011年12月5日から28日までの傾斜時系 列. 観測点位置は第3図に示した. 記録は 上方向への変化が北・東下がりの傾斜 変動を表す. 気圧応答・潮汐成分を BAYTAP-G4) により除去し,直線トレ ンドを補正した後の記録を示した. 点線 で示した期間の傾斜変化量をSSEによ るものと仮定した. 同地域での微動活動 度・津での気圧変化および雨量をあわ せて表示した.
Fig. 2 Time series of tiltmeter records, daily tremor counts, atmospheric pressure change and daily precipitation in the northern Kii peninsula from December 5 to 28, 2011. `N' and `E' that follow a four-character station code denote the northward and eastward ground down tilt components, respectively. The tilt changes for the time window indicated by broken lines are assumed to be caused by an SSE. The atmospheric pressure and precipitation were observed at the JMA Tsu meteorological observatory. The displayed tilt records are detided and their atmospheric pressure responses are corrected
第3図 2011年12月紀伊半島北部SSEの断層モデル. 12月17日から22日の期
間に観測された傾斜変化ベクトル (青矢印)・このデータから推定
されたSSEの断層モデル (赤矩形・矢印)・モデルから計算される
傾斜変化ベクトル (白抜き矢印) を示す. 同じ期間の微動の震央を
橙円で, また VLFE の震央を星印で示した.
Fig. 3 Observed tilt change vectors for six days from December 17, 2011 (blue
arrows), the estimated fault slip (red arrow) and rectangular fault location and geometry (pink rectangle) based on the tilt change vectors, and the calculated tilt changes due to the fault model (open arrows) for the December 2011 SSE in the northern Kii peninsula. Orange circles and stars show epicenters of the tremor activity and VLFEs occurred in this time period, respectively.
第4図 2011年12月1日から2012年1月16日までの傾斜時系列. 図の見方
は第2図と同様. 観測点位置は第5図に示した. 四国西部における
微動活動度・宇和島での気圧変化および雨量をあわせて表示し た.
Fig. 4 Same as Fig. 2 but for the records observed around western Shikoku from December 1, 2011 to January 16, 2012. The atmospheric pressure and the precipitation were observed at the JMA Uwajima meteorological observa-tory. The station locations and the tilt changes during the time window indicated by broken lines are shown in Fig. 5.
第5 図 2011 年 12 月〜2012 年 1 月四国西部 SSE の断層モデル. 図の見方は第 3 図と同じ. 期間①: 2011 年 12 月 24 日から 27 日,期間②:2011 年 12 月 31 日から 2012 年 1 月 3 日,期間③2012
年1 月 4 日から 5 日,期間④1 月 6 日から 10 日のそれぞれの期間の傾斜変化に基づくモデ
ルを示す.