Kinetic study of anti-viral ribavirin uptake mediated
by hCNT3 and hENT1 in Xenopus laevis oocytes
Takashi Yamamoto
1, Mitsuru Sugawara
1Takashi Kikukawa
2, Seiji Miyauchi
3Masahiro Yamaguchi
4, Atsushi Tero
5Seiji Takagi
6, Toshiyuki Nakagaki
6,71
Graduate School For Pharmaceutical Science,
Hokkaido University, Sapporo, Japan
2
Creative Research Initiative ”Sosei”,
Hokkaido University, Sapporo, Japan
3
College of Pharmaceutical Sciences,
Matsuyama University, Ehime, Japan
4
Faculty of Science, Hokkaido University, Sapporo, Japan
5
Presto JST, Sakigake, Kawaguchi, Japan
6
Research Institute for Electronic Science,
Hokkaido University, Sapporo, Japan
7
JST, CREST, 5, Sanbancho, Chiyoda-ku,
Tokyo, 102-0075, Japan
Corresponding author: Toshiyuki Nakagaki, Research Institute for Electronic
Sci-ence, Hokkaido University, N21W10, Sapporo, 001-0021, Japan Tel. +81 11 706 9432, Fax. +81 11 706 9431
email: [email protected]
Keywords: diffusion, mathematical model, nucleoside transporter
Abstract
Transport across the cell membrane is crucial in drug delivery. However, the process is complicated because nucleoside derivatives that are commonly used as anti-viral drugs are transported through two different types of specific transporter: concentrative transporters and equilibrative transporters. Cross-disciplinary ap-proaches involving both biological experiments and theoretical considerations are therefore necessary to study the transport of nucleoside analogues such as ribavirin. Here we constructed an experimental model system using the Xenopus laevis oocyte that expressed examples of both types of transporter: human concentrative nucle-oside transporter 3 and human equilibrative transporter 1. We also performed a kinetic study. Experimental results showed that the transport of ribavirin could be reduced by inhibiting one of the two types of transporter, which seems to be coun-terintuitive. We therefore designed a simple mathematical model of the dynamics of ribavirin uptake and analyzed the model behaviors using a numerical simula-tion. The theoretical results reproduced the experimentally observed phenomena and suggested a possible mechanism for the process. Based on this mechanism, we predicted some potential methods for the effective uptake of ribavirin from a dynamics point of view.
1
Introduction
Nucleoside analogues are commonly used as anti-cancer and anti-viral drugs. The adeno-sine analogue 1-β-D-ribofuranosyl-1H-1,2,4-triazole-3-carboxamide (ribavirin) is one such example. This broad-spectrum anti-viral drug has recently been used for the treatment of patients infected with the hepatitis C virus[1, 2]. The delivery of a drug across the cell membrane needs to be well understood in order to clarify the mechanism underlying its ef-fects. Additionally, from a physiological point of view, the transport of nucleosides across the cell membrane is important as, along with their analogues, they play crucial roles in living systems and have various physiological regulatory functions in different organs. For instance, the adenosine nucleoside regulates coronary vasodilation, renal vasoconstriction, neurotransmission, platelet aggregation, and lipolysis[3, 4].
The uptake of nucleoside analogues into the cell is mediated by two different types of specific transporter: concentrative transporters and equilibrative transporters[5, 6]. Concentrative nucleoside transporters (CNTs) are symporters that simultaneously carry a nucleoside molecule and sodium ions. As the concentration of sodium ions is much lower inside the cell than outside, CNTs can function as active transporters according to the sodium concentration gradient. So far, three subtypes of CNTs have been identified
in humans: hCNT1, which is pyrimidine nucleoside-selective; hCNT2, which is purine nucleoside-selective; and hCNT3, which is broadly selective for both pyrimidine and purine nucleosides[7, 8, 9, 10]. Generally, CNTs have a higher affinity for nucleosides than that of equilibrative nucleoside transporters (ENTs)[5]. ENTs are passive transporters, for which the motive force of transport is the difference in nucleoside concentration across a membrane[11, 12]. The uptake of nucleosides is a complex process due to the involvement of these two different types of transporter.
Our comprehension of nucleoside transport across cell membranes has been further complicated by reports of seemingly counterintuitive phenomena [13]. This might be because of the different types of transporter involved[14], and the complex coupling of the processes of metabolism and signal transduction of nucleosides [15]. To clarify the effects of these factors on nucleoside transport, it could be useful to design and analyze a simplified artificially reconstructed experimental system.
Here, we shed light on the kinetics of combination of both types of transporter. We constructed an experimental model cell system using the Xenopus laevis oocyte, in which both types of transporter, hCNT and hENT, were coexpressed. It is important to note that the expressed transporters were not rodent but human. Using this model cell system, we performed a kinetic study of ribavirin uptake and tested the effects of the specific inhibition of each type of transporter.
Our results revealed that the uptake of ribavirin was facilitated by the inhibition of an ENT, even though the ribavirin concentration was comparatively high outside of the cell. This phenomenon involved both the complexity of the coupled dynamics of the two transporters and spatial diffusion. We further investigated this effect by constructing and numerically analyzing a simple mathematical model for the dynamics of ribavirin transport.
The insights into the interactive effects of CNTs and ENTs revealed by our simplified model system of the oocyte led us to propose some possible methods for the effective uptake of ribavirin in intrinsic human cell systems. One such method was the organ-selective delivery of ribavirin depending on differences in the CNT/ENT ratio, which was based on the dynamic characteristics of the behaviors shown by the model. The cross-disciplinary approach involving biological and mathematical sciences proved to be a powerful tool in the current study.
2
Experimental study of kinetics of ribavirin
trans-port
2.1
Materials and methods
2.1.1 Materials
[3H]-ribavirin was purchased from Moravek Biochemicals (Brea, CA) and ribavirin was purchased from ICN Biomedicals (Aurora, OH). Nitrobenzeylmercaptopurine ribonucle-oside (NBMPR), which inhibits ENTs but not CNTs, was purchased from Sigma (St. Louis, MO). All other compounds were of reagent grade.
2.1.2 Expression of recombinant hCNT3 and hENT1 in Xenopus oocytes
The molecular cloning of hCNT3 and hENT1 was as previously described[16]. hCNT3 and hENT1 complementary RNAs (cRNAs) were synthesized from a linearized plasmid using mMESSAGE mMACHINE and a poly(a) tailing kit (Ambion, Austin, TX). Mature oocytes from Xenopus laevis were isolated by treatment with 2 mg/ml collagenase (Wako, Okasa, Japan), manually defolliculated, and maintained at 16oC in modified BarthÅ?fs solution (88 mM NaCl, 1 mM KCl, 0.41 mM CaCl2, 0.3 mM Ca(NO3)2, 0.82 mM MgSO4,
2.4 mM NaHCO3, 15 mM Tris, and 0.05 mg/mL gentamicin; pH adjusted to 7.4 by HCl).
On the following day, the oocytes were microinjected with either 50 nL water containing cRNA or 50 nL water alone. The injected oocytes were incubated in modified BarthÅ?fs solution (which was changed daily) for either 3 days (radioisotope-transport studies) or 3-4 days (electrophysiological studies) at 16oC.
2.1.3 Radioisotope-transport studies
Uptake experiments were performed at room temperature[16]. The transport buffer used in this study was ND96 solution (96 mM NaCl, 2 mM KCl, 1.8 mM CaCl2, 1 mM MgCl2,
and 5 mM HEPES; pH adjusted to 7.4 by Tris). Sodium-free buffer was used in which Na+ was replaced by N-methyl-D-glucamine (NMDG). As NBMPR has low solubility in the buffer, it was first dissolved in dimethyl sulfoxide (DMSO) and then further diluted in the transport buffer (0.1% v/v). DMSO alone was added to the buffer without NBMPR (control). The oocytes were incubated in 100 µL transport buffer containing ribavirin. At the end of the incubation, the oocytes were washed five times with ice-cold ND96 solution. Then, the oocytes were dissolved in 10% sodium dodecyl sulfate (SDS) solution, and the
radioactivity was measured by a liquid scintillation counter. The uptake of ribavirin was calculated by subtracting the rate of uptake by water-injected oocytes from the rate of uptake by cRNA-injected oocytes.
2.1.4 Electrophysiological studies
The electrophysiological studies were performed using the two-microelectrode voltage clamp (TEVC) technique[17, 18]. The microelectrode was prepared from glass capil-laries (Hirschmann Laborgerate, Eberstadt, Germany) with the PC-10 Puller (Narishige, Tokyo, Japan), which had a resistance of 1.0-1.5 MΩ and was filled with 3 M KCl. The oocytes were penetrated with the microelectrodes and perfused with the same buffer used for radioisotope-transport studies at 20oC. The membrane potential of the oocytes was generally held at -50 mV, and the substrate-induced membrane current was measured us-ing the two-electrode voltage clamp amplifier CEZ-1250 (Nihon Kohden Industry, Tokyo, Japan). For the current-voltage relationship study, the membrane potential was changed from +50 mV to -150 mV (in 20 mV decrements) using a personal computer (PC) via the analog-to-digital/digital-to-analog (AD/DA) converter PCI-360216 (Interface, Hiroshima, Japan).
2.2
Ribavirin uptake by Xenopus oocytes coexpressing hCNT3
and hENT1
2.2.1 Effect of Na+ and NBMPR on uptake of ribavirin
We examined the effects of transporter inhibition on the uptake rate of ribavirin, as shown in Fig. 1a. The uptake was 0.02 pmol/oocyte/min when both types of transporter were not inhibited (’NaCl’ in Fig. 1a), whereas the inhibition of hENT (’Na+ and NBMPR’) increased the uptake by four times to 0.08 pmol/oocyte/min. This implied the presence of an underlying interaction between the two types of transporter. By contrast, the inhibition of hCNT (’NMDG Cl’) decreased the uptake by half to 0.01 pmol/oocyte/min compared to that with no inhibition. This finding was understandable. When both types of transporter were inhibited (’NMDG + NBMPR’), the uptake was negligible (less than 0.001 pmol/oocyte/min). Figure 1b shows the time courses of uptake under the different conditions. For all of the conditions involving inhibition, the uptake was proportional to the time for the first 5 to 30 min. This linearity of uptake indicates that both types of transporter work effectively in the oocyte.
2.2.2 Concentration-dependent uptake of ribavirin
To characterize the kinetics of the ribavirin uptake under the conditions involving inhi-bition, we examined the concentration dependency. During the time course of uptake, we found that the uptake of ribavirin increased linearly for at least 30 min (Fig. 1b). However, after ribavirin has been transported into the oocyte, it is expected to be metab-olized; this might significantly decrease the amount of non-metabolized ribavirin in the oocyte, and affect the transport of ribavirin. Therefore, to avoid any effect of metabolism, we shortened the incubation time as much as possible (to 10 min) and examined the concentration-dependent uptake. [3H]-ribavirin was added to the buffer with Na+ at 0.2
µCi/100 µL/oocyte and to the buffer without Na+ at 1 µCi/100 µL/oocyte.
In the buffer with Na+ and without NBMPR (no inhibition), the uptake of ribavirin showed a biphasic time course, as indicated by the Eadie-Hofstee plot (Fig. 2c). This suggested that both types of transporter still worked as the phases observed at low and high concentrations might have been due to hCNT3 and hENT1, respectively.
The uptake of ribavirin in the buffer with Na+ and NBMPRÅ?(hENT inhibition alone), and without Na+ and NBMPRÅ?(hCNT inhibition alone), followed Michaelis-Menten-type kinetics. The kinetic parameters were Km=17.7± 3.72 µM and Vmax=95.9
± 3.85 pmol/oocyte/10 min with hENT inhibition (Fig. 2a), and Km=4.05 ± 0.951 mM
and Vmax=892 ± 70.2 pmol/oocyte/10 min with hCNT inhibition (Fig. 2b). These values were comparable to those that were previously reported in the oocytes expressing hCNT3 alone and hENT1 alone.Each type of transporter worked effectively in the oocytes coexpressing hCNT3 and hENT1. This result shows that hCNT3 and hENT1 did not interact in a direct way like a molecular interaction.
2.2.3 Ribavirin-induced current
We examined the transport activity of hCNT3 by monitoring the sodium current under the inhibitory condition for hENT1. As shown in Fig. 3a, the ribavirin-induced current in oocytes coexpressing hCNT3 and hENT1 showed voltage dependency and was unaffected by adding NBMPR. Furthermore, the concentration dependency of the ribavirin-induced current showed saturability (Fig. 3b). The Km and Imax values were 28.2 ± 3.27 µM and -157.0 ± 7.12 nA for the uptake in the buffer with Na+ and without NBMPRÅ?f (no inhibition), and 36.5 ± 5.03 µM and -161.9 ± 9.50 nA for the uptake in the buffer with Na+ and NBMPRÅ?(hENT1 inhibition). No significant difference was observed in
these two conditions. This result confirmed that the transport through hCNT3 was not inhibited by NBMPR and was similar to that without NBMPR.
2.2.4 Effect of hENT1 expression level on uptake of ribavirin
The abovementioned results suggest that ribavirin transport activity of hCNT3 is altered by neither addition of NBMPR nor co-expression of hENT1. We therefore assumed that hENT1 transports ribavirin from inside to outside of the cells. It is opposite direction against hCNT3 does. To examine this hypothesis, we changed the quantity of hENT1 cRNA injected into the oocytes from 0 ng to 50 ng in 12.5 ng increments, while the quantity of hCNT3 cRNA was held constant at 50 ng (the total volume injected into the oocytes was held constant at 50 nL). As shown in Fig. 4, according to the decrease in the quantity of hENT1 cRNA, the uptake of ribavirin in the buffer with Na+and without NBMPR (no inhibition) increased up to a level similar to that with Na+ and NBMPR (hENT1 inhibition). The uptake seen with the hCNT3 inhibition increased as the quantity of hENT1 cDNA increased, while the uptake remained constant in the presence of hENT inhibition. These results suggest that hENT plays a key role in the process.
2.3
Summary of results and concluding remarks
The uptake of ribavirin by the oocytes was not merely the sum of the transport rates through the two types of transporter, hCNT and hENT. It was strongly reduced by the presence of hENT1. This suggests that an interaction mechanism might be involved in the co-transport process between hCNT and hENT. We excluded the possibility that NBMPR directly inhibited the transport activity of hCNT, by measuring the ribavirin-induced sodium current. After examining the effect of the expression level of hENT1 on the ribavirin uptake, we concluded that hENT alone played a critical role in the facilitated transport that resulted from hENT inhibition.
This finding is interesting from the point of view not only of drug delivery but also of basic biology. One possible explanation is that ribavirin might be released through hENT, although the concentration of ribavirin is still much lower inside the oocyte than outside according to the estimated volume of the oocyte (0.9 µL). If the ribavirin concentration is not homogeneous in the oocyte due to slow diffusion and/or other reasons, such as trapping by large proteins, this phenomenon might occur. Nonetheless, quantitative analysis is necessary to test the hypothesis and to discover other possibilities. We therefore focused
on the kinetics of this co-transport process, and considered a possible kinetic mechanism by means of mathematical modeling of the transport.
3
Quantitative analysis of ribavirin transport
In this section, we describe a simplified version of the mathematical model [19]. Let us begin with the assumption that the cell is a sphere and that ribavirin simply diffuses inside and outside the cell. We therefore solve the diffusion equations using three-dimensional polar coordinates. Transport across the membrane is mediated only by the transporters, and other forms of transport such as leak are not included. The transporters mediate both inward and outward flows, the dynamics of which obey Michaelis-Menten kinetics. Although the Km and VM AX generally differ for the two directions of transport, here we
assume that they are the same for simplicity. We consider spatial variations only along the radius, assuming that the spatial distribution of the ribavirin concentration always shows spherical symmetry. The model equations are
∂c(r, t)
∂t =
{
Din∇2c, (cell inside, 0≤ r < rm)
Dout∇2c, (cell outside, rm < r≤ re),
(1)
where c(r, t) is the ribavirin concentration, r is the coordinate of the radius (0 ≤
r ≤ re, r ̸= rm), t is time, and Din and Dout are the respective diffusion constants inside
and outside the cell. The Laplacian operator in the polar coordinate is given by ∇2 =
∂2/∂r2+ (2/r)(∂/∂r), where the derivatives along the angle in the polar coordinate is zero because of the assumption of spherical symmetry in the spatial distribution of ribavirin. Transport across the membrane is given as the boundary conditions as Jmembrane = JCN Tin −
JCN Tout + JEN Tin − JEN Tout for the inward flow and −Jmembrane for the outward flow. No flux
boundary conditions are assumed at r0 and re.
JCN Tin , JCN Tout , JEN Tin , andJEN Tout are the flux due to the action of the transporter. The
suffixes CNT and ENT indicate transporters of the CN T and EN T type, respectively. The suffixes in and out express the inward and outward flow, respectively. These fluxes
are given by JCN Tin = VCN Tin ( coutn2out coutn2out+ KCN Tin ) JCN Tout = VCN Tout ( cinn2in cinn2in+ KCN Tout ) JEN Tin = VEN Tin ( cout cout+ KEN Tin ) JEN Tout = VEN Tout ( cin cin+ KEN Tout ) , (2)
where Cin and Cout are the respective ribavirin concentrations directly inside and outside
the membrane, nin and nout are the respective sodium concentrations inside and outside
the membrane, and V and K are the maximum rate and Michaelis constant, respectively. Exponent 2 in the sodium concentration comes from the fact that hCNT3 transports one molecule of ribavirin and two molecules of sodium ion simultaneously.
Here we simplify the situations based on some physiological considerations. As the amount of ribavirin in the extracellular medium is much larger than that which needs to be transported across the membrane, we can neglect the small change in Cout. During the
physiological experiment the extracellular medium is stirred well, so the concentration of ribavirin is homogenous in the extracellular space. It can therefore be assumed that
C = Cout in the extracellular medium. Based on similar considerations for sodium ions,
n = nout in the extracellular medium. For n in the intracellular space, we assume that n
is constant at nin because homeostasis is maintained quickly enough. Figure 5 shows a
schematic illustration of the mathematical modeling.
The details of the numerical calculation are described here. The cell is assumed to be a sphere. The volume of the sphere is 0.9 µl, which is obtained from the experimental measurement (rm = 0.6). The center of the sphere is defined as the origin of the polar
coordinate. The extracellular space also follows the coordinate system. re is the boundary
of the extracellular space and re = 3mm. For the numerical simulation, the space is
discretized by a spherical shell with a thickness of 0.005 mm (= ∆). The spherical shell is numbered from the origin outward (shell number j). Then, rm = 120×∆r, re = 600×∆r.
The space and time are discretized as rj = ∆r× j mm and ti = ∆t× i, and the model
equations are solved by the explicit difference scheme.
The parameters used are as follows, unless otherwise specified as follows: Dout =
5.4× 10²µ m2 /sec (diffusion constant in extracellular space) , Din = 1.2× 101µ m2 /sec
to 3× 10³µ m2/sec), nout = 96× 10−3M (extracellular sodium ion), nin = 5 × 10⁻³M
(intracellular sodium ion) , VM AXEN T = VEN Tin = VEN Tout = 3.95× 10⁻³ nmol/sec (equivalent 2370 pmol/10min, and ˆVM AXEN T = 892 pmol/10min), KmEN T = KEN Tin = KEN Tout = 2.58×10⁻⁴ M (0.26 mM, and ˆKmEN T = 4.1 mM), VM AXCN T = VCN Tin = VCN Tout = 1.65× 10⁻⁴ nmol/sec (equivalent to 99 pmol/10min, and ˆVM AXCN T = 96 pmol/10min), KmCN T = KCN Tin = KCN Tout = 1.63× 10⁻⁷ M3 (0.16 µM, and ˆKmCN T = 18µ M). We will describe how these parameter values are determined in the next section.
4
Numerical calculation and results
4.1
Parameter search for V
M AXand K
min CNT and ENT
The experiment measured the relationship between the extracellular ribavirin concentra-tion and the total uptake when one type of transporter was blocked. From the exper-iments, we have calculated the ˆVM AX and ˆKm, which is of phenomenological effective
process for ribavirin uptake. Actually, however, this effective process consists of not only uptake process but also release process by the transporter and intracellular diffusion pro-cess. This means that the VM AX and Km for each process of uptake and release should be
determined so as to fit to the experimentally obtained ˆVM AX and ˆKm for the effective
up-take process. This is the important point to be emphasized because one may often confuse ˆ
VM AX and ˆKm for the effective process with that for the elementary uptake process.
We therefore searched for the appropriate values of VM AX and Km for each process
of uptake and release by means of our mathematical model introduced in the previous section, at the fixed value of Din = 12.0µm2/sec. Here we assume that VM AX and Km
for uptake process are the same as that of release process in order to reduce the degree of freedom in parameter search, but there are still some degree of freedom. Figure 6 shows the error of fitting caused by changing VM AX and Km when one of transporters
was blocked. The error was defined as the difference between cins of the experimentally
obtained and the theoretically simulated, which was summed up over a range of cout. We
determined VM AXCN T = 1.65× 10⁻⁴ nmol/sec, KmCN T = 1.63× 10⁻⁷M3, VM AXEN T = 3.95× 10⁻³ nmol/sec, KmEN T = 2.58× 10⁻⁴ M.
For the sake of comparison to ˆVM AX and ˆKm, we show the values in the parenthesis
in the same unit. It is clear that there can be big difference. So it is very risky to confuse them.
Using these values of VM AX and Km, we simulated the ribavirin uptake with and
without inhibition of each transporter. Although we assumed Din = 12.0µm2/sec, we
tested various values through the wide range of Din from 1× 100 to 3× 10³µ m2/sec in
order to evaluate reliability of the model, as shown in Fig. 7.
Ribavirin uptake increased by inhibition of hENT as it was observed in the experiment all through the wide range of Din. Quantitatively speaking, the increase of uptake was
very similar in the model simulation and the experiment. This means that the model is very robust.
So we don’t have to be nervous about the Din value. The results described in the
next section are similar in the tested values of Din. We use 12.0µm2/sec as the best
value of fitting hereafter, although the value is, roughly speaking, 100 times smaller than the typical value for molecule with the similar molecular weight (for instance, 3.2 ×
102µ m2/sec[20]).
Since nucleoside analogues like ribavirin are highly bioactive and potentially inter-active with some protein, it is plausible that diffusion velocity of ribavirin is to be 10 times slower (equivalently 100 times smaller in diffusion constant) in space of protein-rich protoplasm.
4.2
Uptake of ribavirin through transporters in the oocyte
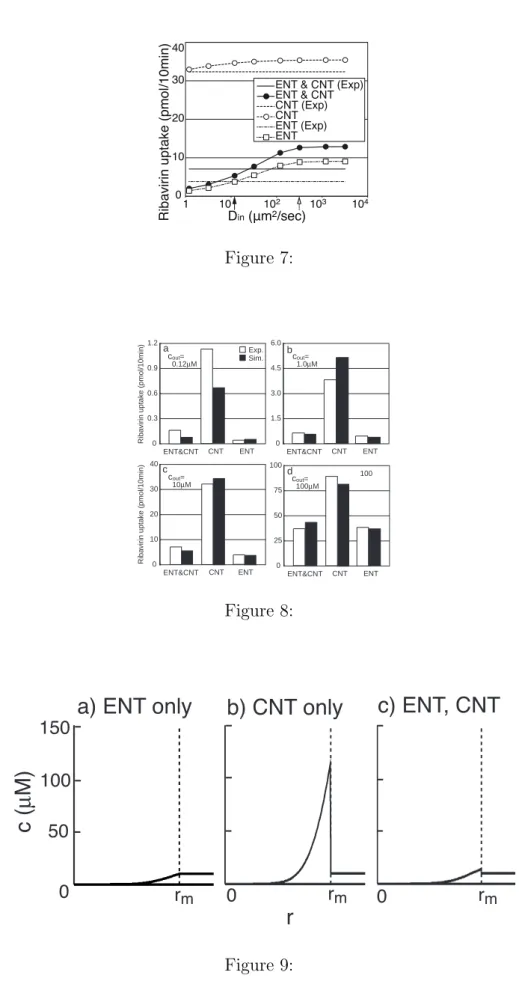
Figure 8 shows the simulation results. There is a good agreement in all cases for the CNT only, the ENT only, and both. As observed in the experiment, ribavirin uptake is promoted by the inhibition of the ENT. The mathematical model essentially explains the transport dynamics observed in the experiment over a wide range of Cout (0.12 µM
≤ Cout ≤ 100µM).
How does this increase occur when the ENT is blocked? Figure 9 sheds light on this phenomenon. The ribavirin concentration increased directly inside the membrane when the CNT transported the drug, as the diffusion of ribavirin in the cell was much slower than the time scale of uptake by the CNT. Under these conditions, the ENT transported the drug from inside the cell to outside. Therefore, ribavirin leaked through the ENT. This explains why the uptake of ribavirin was promoted by the inhibition of the ENT. This can be inferred from the mathematical model proposed here.
In the model proposed here, we assumed that the VM AXs and Kms for both directions
assumptions, we sought the appropriate range of VM AX, Km values. Figure 8 shows an
example of the values. However, we predicted that the kinetic parameters would not always be the same, because the transporter changed its molecular structure in different ways between the two directions of transport. As experimental evidence of the kinetic difference between the two directions of transport is limited, model prediction can be generally useful.
4.3
Inhibition of uptake by stirring the extracellular medium
In the simulation described above, we assumed that c(r, t) = cout in the extracellular
space. However, when the extracellular medium was not stirred and ribavirin diffused through it, the model simulation showed that the uptake of ribavirin was 20% less than that in the case with stirring, as shown in Fig. 10a. Figure 10b indicates the mechanism of inhibition. The ribavirin concentration was low directly outside the membrane because the uptake by the CNT was much faster that the time scale of diffusion in the extracellular medium. The uptake by the CNT then slowed down, as predicted by the model.
4.4
Effects of CNT/ENT ratio on the ribavirin uptake
The CNT/ENT ratio is reported to vary in different organs. According to the model analysis described here, ribavirin uptake is promoted more strongly as the ratio of the ENT is reduced relative to the CNT. In the simulation, a 20 — 30% difference in the ratio leads to a large difference in the uptake, as shown in Fig. 11. This implies that organ-selective drug delivery to ENT-poor organs can be achieved by controlling the drug concentration in the circulating blood.
5
Conclusion
We found that hENT1 reduced the ribavirin uptake via hCNT3 transport through a kinetic interaction of hENT1 and hCNT3 in Xenopus oocytes in which hENT1 and hCNT3 were simultaneously expressed. Quantitative analysis of the kinetics of ribavirin uptake was performed. In the predicted mechanism, the ribavirin pumped inward by hCNT3 was highly concentrated directly inside the membrane due to slow diffusion, and was released outward through hENT1. Based on this mechanism, we proposed that organ-selective drug delivery to ENT-poor organs was feasible by controlling the drug concentration in
the circulating blood.
6
Acknowledgement
This work was supported by JSPS KAKENHI No. 20300105.
References
[1] R.W. Sidwell, J. H. Huffman, G. P. Khare, L. B. Allen, J. T. Witkowski, et al., Broad-spectrum antiviral activity of Virazole: 1-beta-D-ribofuranosyl-1,2,4-triazole-3-carboxamide, Science 177 (1972) 705-706.
[2] J.J. Feld, and J. H. Hoofnagle, Mechanism of action of interferon and ribavirin in treatment of hepatitis C, Nature 436 (2005) 967-972.
[3] J.J. Ohisalo, Regulatory functions of adenosine. Med. Biol. 65 (1987) 181-191.
[4] D. Boison, Adenosine and epilepsy: from therapeutic rationale to new therapeutic strategies, Neuroscientist 11 (2005) 25-36.
[5] W. Kong, K. Engel and J. Wang, Mammalian nucleoside transporters. Curr. Drug Metab. 5 (2005) 63-84.
[6] M. Podgorska, K. Kocbuch and T. Pawelczyk, Recent advances in studies on bio-chemical and structural properties of equilibrative and concentrative nucleoside trans-porters, Acta. Biochim. Pol. 52 (2005) 749-758.
[7] M.W. Ritzel, S. Y. Yao, M. Y. Huang, J. F. Elliott, C. E. Cass, et al., Molecu-lar cloning and functional expression of cDNAs encoding a human Na+-nucleoside cotransporter (hCNT1), Am. J. Physiol. 272 (1997) 707-714.
[8] J. Wang, S. F. Su, M. J. Dresser, M. E. Schaner, C. B. Washington, et al., Na+ -dependent purine nucleoside transporter from human kidney: cloning and functional characterization. Am. J. Physiol. 273 (1997) 1058-1065.
[9] M.W. Ritzel, S. Y. Yao, A. M. Ng, J. R. Mackey, C. E. Cass, et al., Molecular cloning, functional expression and chromosomal localization of a cDNA encoding a human Na+/nucleoside cotransporter (hCNT2) selective for purine nucleosides and uridine, Mol. Membr. Biol. 15 (1998) 203-211.
[10] M.W. Ritzel, A. M. Ng, S. Y. Yao, K. Graham, S. K. Loewen, et al. Cass, and J. D. Young, Molecular identification and characterization of novel human and mouse concentrative Na+-nucleoside cotransporter proteins (hCNT3 and mCNT3) broadly selective for purine and pyrimidine nucleosides (system cib), J. Biol. Chem. 276 (2001) 2914-2927.
[11] M. Griffiths, N. Beaumont, S. Y. Yao, M. Sundaram, C. E. Boumah, et al., Cloning of a human nucleoside transporter implicated in the cellular uptake of adenosine and chemotherapeutic drugs, Nat. Med. 3 (1997) 89-93.
[12] C.R. Crawford, D. H. Patel, C. Naeve and J. A. Belt, Cloning of the human equili-brative, nitrobenzylmercaptopurine riboside (NBMPR)-insensitive nucleoside trans-porter ei by functional expression in a transport-deficient cell line, J. Biol. Chem. 273 (1998) 5288-5293.
[13] A. Deussen, M. Stappert, S. Schafer and M. Kelm, Quantification of extracellular and intracellular adenosine production -Understanding the transmembranous con-centration gradient-. Circulation 99 (1999) 2041-2047.
[14] M. Podgorska, K. Kocbuch and T. Pawelczyk, Recent advances in studies on bio-chemical and structural properties of equilibrative and concentrative nucleoside trans-porters, Acta Biochimica Polonica 52 (2005) 749-758.
[15] J. Centelles, M. Cascante, E. I. Canela and R. Franco, A model for adenosine trans-port and metabolism, Biochem. J. 287 (1992) 461-472.
[16] T. Yamamoto, K. Kuniki, Y. Takekuma, T. Hirano, K. Iseki, et al., Ribavirin up-take by cultured human choriocarcinoma (BeWo) cells and Xenopus laevis oocytes expressing recombinant plasma membrane human nucleoside transporters, Eur. J. Pharmacol. 557 (2007) 1-8.
[17] Y-J. Fei, M. Sugawara, J-C. Liu, H. W. Li, V. Ganapathy, et al., cDNA structure, genomic organization, and promoter analysis of the mouse intestinal peptide trans-porter PEPT1, Biochimica Biophysica Acta 1492 (2000)145-154.
[18] A. Seki, S. Miyauchi, S. Hayashi, T. Kikukawa, M. Kubo, et al., Heterologous expres-sion of Pharaonis Halorhodopsin in Xenopus laevis oocyte and electrophysiological
characterization of its light-driven Cl− pump activity, Biophys. J. 92 (2007) 2559-2569.
[19] J.P. Keener, and J. Sneyd, Mathematical Biology (Springer-Verlag, New York, 1999)
[20] Jonathan V. Shey, Joseph J. H. Ackerman andJeffrey J. Neil, Apparent diffusion of water, ion, andsmall analogues in the Xenopus Oocyte is consistent with Brownian displacement, Magnetic resonance in medicine 48 (2002) 42-51.
Figure Captions
Figure 1:
Effects of Na+ and NBMPR on ribavirin uptake in Xenopus oocytes coexpressing hCNT3 and hENT1. The oocytes were incubated at room temperature with 123 nM ribavirin (0.1
µCi/100 µL/oocyte) in buffer consisting of 96 mM NaCl with or without 10 µM NBMPR,
and NMDG Cl with or without 10 µM NBMPR. Panel (a) shows the uptake for 1 min (⋆P < 0.05,⋆⋆P < 0.01,⋆⋆⋆P < 0.001, significantly different) and panel (b) shows the time course of the uptake. Each value is the mean ± SE of six measurements.
Figure 2:
Concentration dependency of ribavirin uptake by Xenopus oocytes coexpressing hCNT3 and hENT1. (a) In the buffer with Na+ and NBMPR (hENT1 inhibition alone). (b) In the buffer without Na+ and NBMPR (hCNT3 inhibition alone). (c) In the buffer with Na+ and without NBMPR (no inhibition). Oocytes were incubated for 10 min at room temperature in the buffer consisting of 96 mM NaCl and NMDG Cl with or without NBMPR, and the uptake was determined based on the influx into the RNA-injected oocytes minus the influx into the H2O-injected oocytes over a ribavirin concentration
range of 1µM-500 µM (a) or 1 µM-20 mM (b, c). Each value is the mean ± SE of six measurements. Inset, Eadie-Hofstee plot.
Figure 3:
Ribavirin-induced currents in Xenopus oocytes coexpressing hCNT3 and hENT1. The oocytes were perfused with ribavirin in the buffer with (open circles) or without (closed circles) 10 µM NBMPR, and the ribavirin-induced currents were monitored using the TEVC technique. (a) Dependence of ribavirin-induced currents on ribavirin concentration (2.5-100 µM) and membrane potential (+50 to -150 mV). (b) Concentration dependence of ribavirin-induced currents (clamped at -50 mV). Each value is the mean of five mea-surements.
Figure 4:
Effect of hENT1 expression level on ribavirin uptake by Xenopus oocytes coexpressing hCNT3 and hENT1. The oocytes were injected with 50 ng hCNT3 cRNA and 0, 12.5,
25, 37.5, or 50 ng hENT1 cRNA. The concentration of ribavirin was 123 nM (labeled compound alone, 0.1 µCi/100 µL/oocyte), and the oocytes were incubated for 1 min at room temperature in buffer containing 96 mM NaCl and NMDG Cl with or without 10 µM NBMPR. To reduce the influence of the metabolism of ribavirin as much as possible, we shortened the incubation time by 1 min. Each value is the mean± SE of six measurements.
Figure 5:
Schematic illustration of model setup. Diffusion of ribavirin concentration c(r, t) was considered along the r axis of the three-dimensional polar coordinate. At the cell mem-brane r = rm, transport by the transporters was considered. The boundary condition at
r = 0, re was of the no-flux type. In some simulations, c was a constant (cout).
Figure 6:
Search for the kinetic parameters for the CNT (a) and the ENT (b). A darker shade indicates a smaller error in fitting the experimental data for the relationship between the extracellular concentration of ribavirin and the total ribavirin uptake when one of the transporters was blocked. The definition of the error is given in the main text of subsection 4.1.
Figure 7:
Effects of variations of Din value on ribavirin uptake with and without inhibitions of
each of transporter. As observed in the experiments, ribavirin uptake increased by ENT inhibition (see the difference between the open and the closed circles). This increase of ribavirin uptake was observed all through the wide range of Din from 1 × 100 to
3× 10³µ m2/sec in order to evaluate reliability of the model. The white arrow indicates
a typical value 3.2× 10²µ m2/sec, obtained from the literature[20], and the black one
indicates the value 12µ m2/sec, used in the simulation hereafter.
Figure 8:
Comparison of simulation results (black columns) with biological experiments (white columns) for ribavirin uptake. The total amount of ribavirin transported into the cell was measured 10 min after the addition of ribavirin to the extracellular medium. cout =0.12µM
ENT, ENT only; CNT, CNT only. The simulation reproduced the finding that the uptake was strongly inhibited by coexisting CNT and ENT in comparison to the CNT alone. All of parameter values are shown in the last paragraph of section 3.
Figure 9:
Kinetic mechanism for the promotion of ribavirin uptake by inhibition of ENT. Spatial distribution of ribavirin concentration 10 min after the addition of ribavirin to the ex-tracellular medium (cout = 10µM ). (a) ENT only. (b) CNT only. Ribavirin was highly
concentrated directly inside the membrane. (c) ENT and CNT. The ribavirin concen-tration was lower than that with the CNT only, because ribavirin leaked according to the concentration gradient across the membrane. rm indicates the position of the cell
membrane.
Figure 10:
Effects of stirring the extracellular medium on ribavirin uptake. (a) Total amount of rib-avirin uptake 10 min after the addition of ribrib-avirin to the extracellular medium (cout =
10µM ). The white columns indicate the experiment, and the black and dark columns indicate the respective simulation results with and without stirring. The update of rib-avirin was reduced by about 20% by not stirring. (b) Spatial distribution of ribrib-avirin. The ribavirin concentration was low directly outside the cell membrane because the diffusion of ribavirin was slow. The transport by the CNT was then slowed down.
Figure 11:
Dependency of uptake on the ratio of transporters. The ratio in the abscissa axis was given by CNT/(CNT+ENT). The uptake in the ordinate was calculated 10 min after the addition of ribavirin, and expressed the total amount normalized to that of ENT=0. The uptake was reduced as the ratio of the ENT became larger.
NaC l NaC l + NBMP R NM DG Cl NMD G C l +NBMPR R ib a vi ri n u p ta ke (p mo l/ o o cyt e /mi n ) 0.10 0.08 0.06 0.04 0.02 0.00 R ib a vi ri n u p ta ke (p mo l/ o o cyt e ) Time (min) 0 1 0 2 0 3 0 4 0 4.0 3.0 2.0 1.0 0.0 NaCl NaCl + NBMPR NMDG Cl NMDG Cl + NBMPR a * b ** *** * Figure 1:
R ib a vi ri n u p ta ke (p mo l/ o o cyt e /1 0 mi n ) Ribavirin (µM) 0 100 200 300 400 500 120 100 80 60 40 20 0 v/s 0 2 4 6 120 80 40 0 v R ib a vi ri n u p ta ke (n mo l/ o o cyt e /1 0 mi n ) Ribavirin (mM) 0 5 10 15 20 1.0 0.8 0.6 0.4 0.2 0.0 0.0 0.2v/s0.4 0.6 1.2 0.8 0.4 0.0 v R ib a vi ri n u p ta ke (n mo l/ o o cyt e /1 0 mi n ) Ribavirin (mM) 0 5 10 15 20 1.2 1.0 0.8 0.6 0.4 0.2 0.0 v/s 0.0 0.5 1.0 1.2 0.8 0.4 0.0 v a b c Figure 2: Membrane potential (mV) R ib a vi ri n -i n d u ce d cu rre n t (n A) -150 -100 -50 0 50 -400 -350 -300 -250 -200 -150 -100 -50 50 NaCl NaCl + NBMPR 2.5 µM 5.0 µM 10 µM 25 µM 50 µM 100 µM Ribavirin (µM) R ib a vi ri n -i n d u ce d cu rre n t (n A) NaCl NaCl + NBMPR 20 40 60 80 100 -160 -140 -120 -100 -80 -60 -40 -20 0 a b Figure 3:
R ib a vi ri n u p ta ke (p mo l/ o o cyt e /mi n ) hCNT3(50 ng) hENT1(0 ng) hCNT3(50 ng) hENT1(12.5 ng) hCNT3(50 ng) hENT1(25 ng) hCNT3(50 ng) hENT1(37.5 ng) hCNT3(50 ng) hENT1(50 ng) 0.16 0.14 0.12 0.10 0.08 0.06 0.04 0.02 0.00 NaCl NaCl +NBMPR NMDG Cl NMDG Cl + NBMPR Figure 4:
r=0
r=r
mr=r
e JinCNTJinENT JoutENT
JoutCNT no flux b.c. no flux b.c.
c = c
out
∂
c
/∂
t
=
D
in∂
2c
/∂
r
2 Figure 5: 4 0 8 6 4 2 0 10 5 VMAX (×10-3 nmol/sec) Km (×1 0 -4 M) 30 0 0 VMAX (×10-4 nmol/sec) 1 2 3 1 2 3 4 Km (×1 0 -7 M) 0 a b Figure 6:40 30 20 10 0 R ib a vi ri n u p ta ke (p mo l/ 1 0 mi n ) 104 103 102 10 1 Din (μm2/sec) ENT ENT (Exp) CNT CNT (Exp) ENT & CNT ENT & CNT (Exp)
Figure 7: 0 10 20 30 40 ENT&CNT CNT ENT
Ribavirin uptake (pmol/10min)
cout= 10µM 0 1.5 3.0 4.5 6.0 ENT&CNT CNT ENT 0 25 50 75 100 ENT&CNT CNT ENT 100 0 0.3 0.6 0.9 1.2 ENT&CNT CNT ENT
Ribavirin uptake (pmol/10min)
Exp. Sim. a b d c cout= 0.12µM c 1.0out=µM cout= 100µM Figure 8: 0 rm 0 rm 0 rm
c (
µ
M)
100 50 150r
a) ENT only
b) CNT only
c) ENT, CNT
0 10 20 30 40 ENT&CNT CNT ENT R ib a vi ri n u p ta ke (p mo l/ 1 0 mi n ) c out= 10μM