The Crustal Deformation and Fault Model of the 2011 off the Pacific Coast of Tohoku
Earthquake
Tetsuro Imakiire and Tomokazu Kobayashi
AbstractThis paper presents an overview of crustal deformation caused by the 2011 off the Pacific coast of Tohoku Earthquake, detected by GEONET (GPS Earth Observation Network), the GPS continuous observation system operated by the GSI, and by interferometric SAR (InSAR) analysis using ALOS/PALSAR data. We found that a very wide area of the Japanese Islands, from Hokakido to the Kinki district, was remarkably affected by the crustal deformation caused by the mainshock of the Tohoku Earthquake. We estimated the geometry of the seismogenic fault of the earthquake, as well as the slip model for the plate boundary between the Pacific plate and the North American plate, from the crustal deformation data obtained from GEONET. The fault is estimated to be longer than 400 km, stretching from off Iwate Prefecture in the north to off Ibaraki Prefecture in the south. The largest slip estimate for the plate boundary is more than 56 m in the off-Miyagi region near the Japan Trench. Postseismic crustal deformation is also observed by GEONET, indicating that slow postseismic slip is ongoing along the plate boundary around the main fault zone. Additionally, we detected clear coseismic signals associated with induced inland earthquakes in the Fukushima-Hamadori area from InSAR analysis. The InSAR results show obvious displacement discontinuities, suggesting that rather shallow ruptures occurred. In particular, for the Mj 7.0 event on April 11,
the observed displacement boundaries correspond to earthquake surface ruptures that appeared just along the Idosawa and Yunotake faults.
KEYWORDS: The 2011 off The Pacific Coast of Tohoku Earthquake, Crustal Deformation, Fault Model, GEONET, Slip distribution, InSAR, PALSAR
1. Overview of the earthquake
The 2011 off the Pacific coast of Tohoku Earthquake (hereafter referred as the Tohoku Earthquake) broke out at 14:46 on March 11, 2011. With a magnitude of 9.0 (according to the JMA), it is the largest earthquake recorded in the history of seismic observation in Japan. The highest intensity, VII (JMA scale), was recorded at Kurihara City, Miyagi Prefecture. The epicenter was located offshore near Miyagi Prefecture, where large plate boundary earthquakes (commonly with magnitude 7–8 and not larger than 8.5) have occurred repeatedly. The Tohoku Earthquake generated a disastrous tsunami, which hit wide areas of the Pacific coast from Hokkaido to Honshu causing great damage. The Meiji-Sanriku Earthquake (M 8 1/4), which occurred in 1896 in an area near the Tohoku Earthquake's source region, is known as a tsunami earthquake and caused more than 22,000 casualties. The Tohoku Earthquake caused almost as many casualties. 2. Coseismic Crustal Deformation
Significant crustal deformation caused by the
Tohoku Earthquake was detected by GEONET, the continuous GPS observation network operated by the GSI. Figure 1 shows the horizontal movement, and Figure 2 the vertical movement, of GEONET sites in northeastern Japan (GSI, 2011a). The maximum movement is recorded at the Oshika site in Ishinomaki City, Miyagi Prefecture, and comprises about 5.3 m horizontal movement toward the east to southeast and vertical subsidence of up to 1.2 m.
Figure 3 shows the contour map of horizontal movements (GSI, 2011b). It is notable that a very wide area around the Tohoku and Kanto districts was affected by crustal deformation related to the Tohoku Earthquake. The GEONET sites in Iwate Prefecture to the north, Yamagata Prefecture to the west, and Ibaraki Prefecture to the south, moved more than 1 m. Even in the Tokyo Metropolitan area, about 0.2 m horizontal movement was observed.
Figure 4 shows the contour map of vertical movement (GSI, 2011b). It is clear that all places along the Pacific coastline in the Tohoku and Kanto regions subsided coseismically. The Oshika Peninsula, the place
Fig. 1 Crustal deformation (horizontal) associated with the
2011 off the Pacific coast of Tohoku Earthquake that occurred on March 11, 2011.
Fig. 3 Contour map of crustal deformation (horizontal)
associated with the 2011 off the Pacific coast of Tohoku Earthquake.
Fig. 2 Crustal deformation (vertical) associated with the 2011
off the Pacific coast of Tohoku Earthquake that occurred on March 11, 2011.
Fig. 4 Contour map (vertical) of the crustal deformation
associated with the 2011 off the Pacific coast of Tohoku Earthquake.
nearest to the epicentric area, subsided more than 1 m. Several tens of centimeters of subsidence was recorded at many sites along the coastline from Miyagi Prefecture to Ibaraki Prefecture, which was affected by high tide after the earthquake.
3. Fault Models
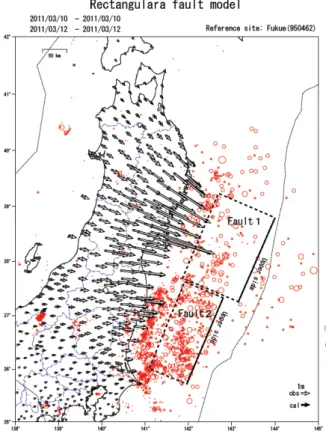
We constructed a fault model using coseismic surface displacement data observed by GEONET. A preliminary fault model, which consists of two rectangular faults with a uniform slip in an elastic half-space, is shown in Figure 5.
Fig. 5 The earthquake source fault model (rectangular fault
model) of the 2011 off the Pacific coast of Tohoku
Earthquake. Black arrows indicate the observed horizontal movement at GEONET stations. White arrows indicate the calculated movements determined on the basis of the model. Red dots indicate the epicenters from the JMA catalog for the period March 11–15. The mainshock is indicated by ☆. Parameters for two fault segments are shown below.
Northern segment: L = 186 km, W = 129 km, strike = 203°, dip = 16°, rake = 101°, slip = 24.7 m, Mw = 8.8
Southern segment: L = 194 km, W = 88 km, strike = 203°, dip = 15°, rake = 83°, slip = 6.1 m, Mw = 8.3
The parameters of these faults are estimated based on the formula introduced by Okada (1985). This figure shows that total major rupture length reaches about 380 km with a fault width of 90–130 km. A reverse fault motion is inferred. Slip amounts of the northern and southern segments are estimated to be ~25 m and ~6 m, respectively. The total moment magnitude (Mw) is 8.9.
Figure 6 shows a distributed slip model using coseismic surface displacement data observed by GEONET (GSI, 2011b). We assumed that the coseismic slip occurred along the plate interface between the Pacific plate, which is subducting from the east, and the North American plate, where the Tohoku region is located.
Fig. 6 The slip distribution model of the 2011 off the Pacific
coast of Tohoku Earthquake, based on GEONET observations (a slip distribution model of the plate interface).
Slip is estimated by geodetic inversion based on the method of Yabuki and Matsu'ura (1992). The slip area, where estimated slip is more than 4 m, extends more than 400 km from north to south, or nearly 450 km in the major axis along the Japan Trench, with a width of about 200 km from west to east. The largest slip, estimated near the epicenter, is about 27 m (Ozawa et al., 2011). The total amount of energy released coseismically, or the seismic moment based on this slip model, is 3.90 × 10²² Nm, equivalent to a moment magnitude (M
w) of 9.0
assuming a rigidity of 40 GPa. This moment magnitude value is consistent with other estimations based on seismic wave inversion or tsunami inversion analysis.
Figure 7 shows an advanced slip distribution model using GEONET data and seafloor crustal deformation data observed by the Japan Coast Guard (GSI, 2011b). Horizontal movement observed at the Miyagi-1 seafloor site is as large as 24 m, with vertical uplift of about 3 m. It is notable that the center of the slip area is estimated to be nearer to the Japan Trench, or further east, compared to the previous model. Furthermore, the estimated maximum slip is more than 56 m, much larger than previous estimates. This extremely large slip suggests that the plate boundary around this area was very firmly stuck before the earthquake, and has been accumulating strain energy for a long time.
4. Postseismic Crustal Deformation
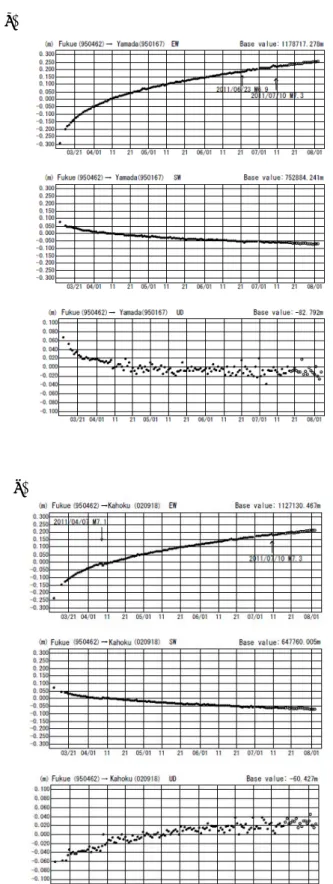
GEONET reveals remarkable crustal deformation that has been ongoing around the Tohoku and Kanto region since the Tohoku earthquake. Figure 8 shows the time series of the postseismic crustal deformation at GEONET sites (GSI, 2011c). Figure 8(a) shows the Yamada site, which is located on the coast of Iwate Prefecture. Horizontal movement toward the east to southeast after the mainshock exceeded 50 cm by the end of July 2011. The Yamada site has been subsiding during the time period described above. On the other hand, the time series of crustal deformation at the Kahoku site in Miyagi Prefecture (Fig. 8(b)) shows slight uplifting after the mainshock.
Figure 9 shows postseismic horizontal and
Fig. 7 The slip distribution model of the 2011 off the Pacific
coast of Tohoku Earthquake, based on GEONET observations on land and seafloor crustal deformation from GPS/acoustic observations by Japan Coast Guard (a slip distribution model of the plate interface).
vertical movement vectors around northeastern Japan (Nishimura, 2011). The pattern of the horizontal movement vectors toward the east to southeast means that the crustal block on the North American plate, where the Tohoku region is located, is moving eastward and overriding the Pacific plate, even after the Tohoku earthquake. However, a detailed investigation of the crustal movement pattern shows that there is a slight difference between the coseismic and postseismic movements.
Although all GEONET sites subsided coseismically, several sites in Miyagi Prefecture and certain sites around Choshi have been uplifting since the earthquake.
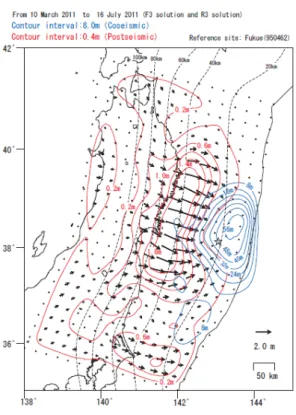
Figure 10 shows the slip distribution model for the postseismic crustal deformation (GSI, 2011c). The most significant feature of this slip model is that the center of the slipping area is located slightly westward of
Fig. 8 Crustal deformation after the 2011 off the Pacific coast
of Tohoku Earthquake; the time series at (a) Yamada site in Iwate Prefecture, and (b)Kahoku site in Miyagi Prefecture.
Fig. 9 Crustal deformation after the Tohoku earthquake in the
case of the Misumi site, showing (a) horizontal deformation as of September 18, 2011, and (b) vertical deformation as of September 18, 2011.
the center of coseismic slip area. This means that postseismic slip along the plate boundary occurs primarily in zones deeper than the coseismic rupture zone.
Geomorphological evidence, such as coastal terraces, shows that the coastal area of the Tohoku district has been uplifting for a long time. However, geodetic observations, including a leveling survey from one hundred years ago, tidal observations for several tens
(a)
(b) (a)
Fig. 10 Slip distribution model for postseismic crustal
deformation of the 2011 off the Pacific coast of Tohoku Earthquake, based on GEONET observations (blue lines), overlaying the coseismic slip distribution based on GEONET observations on land and seafloor crustal deformation from GPS/acoustic observations (red lines).
of years, and GPS observations, show that the Pacific coast of the Tohoku region has been subsiding since before the Tohoku earthquake. There was a hypothesis that coseismic uplift caused by a great interplate earthquake would exceed inter-seismic subsidence. However, the area concerned has undergone subsidence related to the Tohoku earthquake. According to another hypothesis, after a great earthquake, the postseismic slip can penetrate the deeper zone of the plate boundary, and thus act as the main cause of inter-seismic uplift. Studying crustal deformation observations for several years would allow us to decide whether this explanation is appropriate.
5. InSAR Analysis
Satellite synthetic aperture radar (SAR) data can
provide detailed and spatially comprehensive ground information and interferometric SAR (InSAR) enables us to measure ground deformation with high precision. One of the advantages of InSAR observation is that it can map vast ground displacements with a wide observation range of several dozen km, which is helpful in grasping the spatial extent of crustal deformation. An additional advantage is that local crustal deformation can be detected. Although GPS sites (GEONET) are densely deployed at intervals of ~20–30 km nationwide, it remains difficult to obtain high quality displacement data for small- to moderate-sized earthquakes. Alternatively, owing to the high ground resolution of SAR data (PALSAR), ~10 m, InSAR observation works well to detect small- to moderate-sized ground deformation anomalies over a large area. In this section, we focus on an extremely wide-range crustal deformation caused by the Mw 9.0 mainshock and local change associated with
induced inland earthquakes in the Fukushima-Hamadori area, derived from InSAR analysis.
To study crustal deformation due to the Tohoku earthquake, we collected ALOS/PALSAR images acquired before and after the Mw 9.0 event. The Japan
Aerospace Exploration Agency (JAXA) made urgent observations of the great earthquake on March 15 (path 401), March 20 (path 404), March 21 (path 55), April 1 (path 402), April 6 (path 405), April 7 (path 56), April 11 (path 408), April 12 (path 59), April 13 (path 400), and April 18 (path 403) in fine beam mode, and on March 14 (path 60) and March 31 (path 61) in ScanSAR mode. One ALOS/PALSAR image of fine beam observation, which is a normal operational mode, covers an area approximately 70 × 70 km. On the other hand, the ScanSAR mode can observe a wide width range of ~350 km, which is capable of monitoring the entirety of the extremely vast crustal deformation field at once. However, the interferometric coherence of the obtained images was too low to detect ground displacements, which may have resulted from large perpendicular baselines (~2 km and ~5 km). Thus, we used the fine-beam-mode data for the interferometric analysis. Resultantly, seven ascending orbit data and three descending orbit data were available for the InSAR
Fig. 11. Compilation of GPS-corrected interferograms derived
from ALOS/PALSAR images for (a) ascending and (b) descending orbits. The red star indicates the epicenter of the 2011 off the Pacific coast of Tohoku Earthquake. Blue lines indicate prefectural boundaries. Precise orbit data are used for all the interferograms.
analysis. Six to fifteen scenes were concatenated for each path to cover the crustal deformation area. ALOS had completed its mission on May 12 due to a power generation anomaly that occurred on April 22. Thus, no images were acquired for paths 406 and 407; consequently, the InSAR observations were not able to cover the whole ground deformation area.
5.1. Crustal Deformation of the Mw 9.0 Event
Figures 11(a) and (b) show all the wrapped interferograms analyzed for each path using ascending and descending orbit data, respectively. Interferograms with high coherence are obtained although there exist low coherence areas in and around mountainous areas, perhaps reflecting the effects of snow.
We can identify many concentric roundish fringes
around the epicenter of the Mw 9.0 event all over eastern
Japan. The round pattern can be identified at the northern and western margins of the interferograms. The significant displacement is distributed over a range of at least ~700 km in the north-south direction and ~350 km in the east-west direction. There has been no event that has produced such a vast InSAR-derived crustal deformation map, extending over a range of more than 500 km, except for the 2010 Maule Earthquake (Mw 8.8)
(Tong et al., 2010). All data in the ascending orbit images confirm a lengthening of the slant range, while those for the descending orbit show a shortening of the slant range. This deformation pattern can be accounted for by crustal deformation where eastward movement is dominant. Approximately 34 fringes are counted from the northernmost part of Honshu Island to the tip of the
Oshika peninsula, equivalent to a relative slant range lengthening of ~4.0 m. The observed length change in the radar line of sight direction (ΔLOS) is the largest displacement ever observed in Japan using InSAR. At the corresponding location, a maximum displacement is observed in GEONET with a nearly eastward motion of ~5.4 m (EW: 5.1 m / NS: −1.7 m) and a subsidence of ~1.1 m (a mobile continuous observation site: 059071). The relative ΔLOS with respect to the northernmost part of Honshu (we use 020897 as the reference site) is ~3.8 m. The InSAR result agrees well with the GPS observations. It is presumed that the difference in displacement between InSAR and GPS measurements results mainly from an effect of postseismic deformation (Kobayashi et al., 2011).
The Geospatial Information Authority of Japan (GSI) released and updated the InSAR-derived crustal deformation of the Mw 9.0 event whenever SAR data
were newly acquired (http://vldb.gsi.go.jp/ sokuchi/ sar/result/sar_data/urgent/20110311_tohoku_taiheiyo.ht ml). To promptly release the results of this analysis, we used not precise orbit information but RARR (Range And Range Rate) information. The former is most accurate but is available within a few days latency, while the latter is less accurate but is more rapidly distributed within a few hours latency. The interferograms obtained using RARR, however, suffered from non-negligible long-wavelength phase change noise due to incorrect satellite position information. Thus, we made a correction to the “quick” interferograms using GEONET data to suppress the long-wavelength noise (Tobita et al., 2005). Because the InSAR analysis incorporating GEONET data effectively reduces the noise, we were able to release the prompt and accurate mapping of the ground displacement (see Kobayashi et al. (2011) for more details).
5.2. Inland Earthquakes in the Fukushima-Hamadori Area
Following the Mw 9.0 event, many inland crustal
earthquakes occurred in addition to aftershocks on the plate boundary. The Fukushima-Hamadori area and surroundings is one of the regions where the seismicity
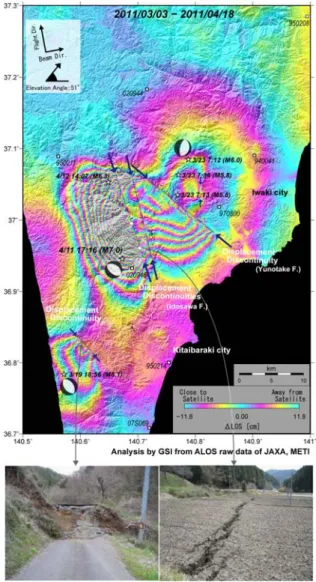
changed drastically from a quiescent stage to an active stage. In the seismically active region, we can find several clear coseismic deformations in the interferograms due to the inland earthquakes: Mj 6.1
(March 19), Mj 6.0 (March 23), and Mj 7.0 (April 11)
events (Fig. 12). To pick up ground displacement corresponding to the inland earthquakes, we removed the long-wavelength ground displacement due to the Mw 9.0
earthquake by applying a bilinear correction for flattening. The most concentrated crustal deformation is located ~20 km west of the city of Iwaki. The crustal deformation depicted in the figure is caused mainly by the Mj 7.0 event. It is distributed over a range of ~40–50
km. The maximum displacement observed, away from the satellite, is ~2.2 m. We stress that we succeeded in obtaining the phase change map with high coherence in the whole source region. In the case of the 2008 Iwate-Miyagi Nairiku earthquake, which was almost the same magnitude (Mj 7.2) as this event, the
interferometric coherence was significantly lower near the hypocentral area. The high coherence implies that the large ground displacement occurred with no serious change in ground scattering conditions and no high displacement gradient near the hypocentral area.
It is striking that we can identify clearly major and minor displacement discontinuities in the InSAR map. The maximum discrepancy in displacement across the discontinuity is approximately 1.6 m. Three main displacement boundaries can be recognized in the source region of the Mj 7.0 event, indicated by blue arrows. The
discontinuity lines run just on the Idosawa and Yunotake fault traces, which are known to be active faults (Research Group for Active Faults of Japan, 1991). These suggest that multiple, not single, fault ruptures occurred. Field surveys demonstrate that earthquake surface faults, which are normal faults, appeared with more than 2 m maximum displacement (bottom in Fig. 12), and the discontinuity in the interferogram does correspond to the surface rupture locations. The photographs show that the hanging wall block drops down relative to the footwall block with no serious ground deformation on each block. This is why high coherence is preserved even in the proximity to the fault.
Displacement discontinuities can be recognized in not only the deformation field of the Mj 7.0 event but
also in those of the Mj 6.1 and the Mj 6.0 events (blue
arrows in Fig. 12). This suggests that the fault ruptures occurred at shallow depths, although there are no reports of appearances of earthquake surface faults. According to the fault modeling result for the Mj 6.1 event, a rather
shallow slip with 0.1 km depth (fault top position) is estimated (Kobayashi et al., 2011). These features cannot be extracted from the GPS observation network, whose sites are sparsely deployed (white squares in Fig. 12). The analysis result shows the advantage of InSAR
Fig. 12. An interferogram showing crustal deformation
associated with the 3/19 (Mj 6.1) event, the 3/23 (Mj 6.0) event, and the 4/11 (Mj 7.0) event. The blue arrows indicate the location of the displacement discontinuities.
observations for inland earthquakes, which is that detailed information regarding ground surface change and source properties are provided.
Photographs showing earthquake surface faults identified along the Idosawa fault, which is investigated by the geographic information analysis research division (http://www.gsi.go.jp/chirijoho/chirijoho40028.ht ml), are shown at the bottom.
6. Summary
The 2011 Tohoku earthquake is the largest earthquake in the history of seismic observation in Japan. Detected coseismic crustal deformation is remarkably large. Maximum horizontal movement of 5.3 m and subsidence of 1.2 m were recorded at Ishinomaki City. The slip distribution model derived from crustal deformation data shows that extremely large slip, larger than 56 m, exists at the shallow plate boundary zone near the Japan Trench. Remarkable postseismic crustal deformation has been ongoing since the mainshock. Even though slight uplift is observed in part of the subsided area, the rate of uplifting there is not as high as expected.
InSAR analysis using ALOS/PALSAR data reveals significant displacement distributed over a range of at least ~700 km in the north-south direction and ~350 km in the east-west direction by the mainshock. Detailed crustal deformation by earthquakes triggered by the mainshock is also detected. An interferogram of the Fukushima-Hamadori area shows the rupture of the Idosawa and Yunotake faults by the earthquake occurred on April 11.
References
Geospatial Information Authority of Japan (2011a), Crustal deformation associated with the 2011 off the Pacific coast of Tohoku Earthquake on March 11, 2011,
http://www.gsi.go.jp/chibankansi/chikakukansi40005. html, (in Japanese) (accessed 6 Dec.,2011)
Geospatial Information Authority of Japan (2011b), Crustal Movements in the Tohoku District, Rep.
Geospatial Information Authority of Japan (2011c), Crustal Movements in the Tohoku District, Rep.
CCEP, Vol.87,(submitted), (in Japanese)
Nishimura, T. (2011), Coseismic and postseismic deformation of the 2011 Off the Pacific coast of Tohoku Earthquake and slip distribution estimated from the observed deformation , News Letter of SSJ, Vol.23-4, 12-16, http://www.zisin.jp/newsletter/ NL23-4.pdf, (in Japanese) (accessed 6 Dec.,2011) Okada, Y. (1985), Surface deformation due to shear and
tensile faults in a half-space,Bull. Seism. Soc. Am.,75,
1135-1154.
Yabuki, T. and Matsu'ura M. (1992),, Geodetic data inversion using Baysian information criterion for spatial distribution of fault slip. Geophys. J. Int. 109,
363-375.
Ozawa, S., T. Nishimura, H. Suito, T. Kobayashi, M. Tobita and T. Imakiire (2011), Coseismic and postseismic slip of the 2011 magnitude-9 Tohoku-Oki earthquake, Nature, 475, 373-376, doi:10.1038/
nature10227
Kobayashi, T., M. Tobita, T. Nishimura, A. Suzuki, Y. Noguchi, and M. Yamanaka (2011): Crustal
deformation map for the 2011 off the Pacific coast of Tohoku Earthquake, detected by InSAR analysis combined with GEONET data, Earth Planets Space, 63, 621-625.
Research Group for Active Faults of Japan (1991): Active faults in Japan: Sheet maps and inventories (revised edition), University of Tokyo Press (in Japanese with English summary).
Tobita, M., H. Munekane, S. Matsuzaka, M. Kato, H. Yarai, M. Murakami, S. Fujiwara, H. Nakagawa, and T. Ozawa (2005): Studies on InSAR data processing technique, Bull. GSI., 106, 37-49 (in Japanese). Tong, X., D. Sandwell, K. Luttrell, B. Brooks, M. Bevis,
M. Shimada, J. Foster, R. Jr. Smalley, H. Parra, J. C. Báez Soto, M. Blanco, E. Kendrick, J. Genrich, and D. Caccamise (2010): The 2010 Maule, Chile earthquake: Downdip rupture limit revealed by space geodesy, Geophys. Res. Lett., 37, doi: 10.1029/2010 GL045805.