Historical Trend of the Anthropogenic Heavy Metal Pollution in the Estuary Sediment of
Osaka Bay, Japan
Hideo Yamazaki,
Sizuka Yamamoto and Kouji Kawabata
Department of Life Science, School of Science and Engineering,
Kinki University
Higashiosaka, Osaka 577-8502, Japan
(Received December 24, 2007)
Abstract
The concentration of heavy metals such as chromium, nickel, copper, zinc, arsenic and lead were determined in the dated core sediment in order to evaluate the historical trend of the anthropogenic heavy metal pollution in Osaka Bay. The time trends of the pollution profile of the heavy metals were clarified in the core. The pollution of anthropogenic heavy metals began around the Meiji restoration 1860's. The contamination increased by 1960's and decreased from 1970's to the present. The dramatic decrease of the metal concentration in the sediment after 1970's has shown the result of the legal regulation in Japan. The concentration of these pollutant elements showed the mutually high correlation in the sediment. It is shown that the pollution of Osaka Bay by the heavy metals originated from the industrial activity of the urban district in the coastal area. The correlations of the metal concentrations and the total sulfur (TS) concentration were also very high, and it is indicated that the contaminated heavy metals were being fixed in the sediment as a sulfide.
Keywords: Heavy metal pollution, Osaka Bay, Sediment, Historical trend
1. Introduction
Sediment in an aquatic environment accumulated many pollutants such as heavy metal are partly of natural origin, but large amounts are discharged by human activities. It means to record the historical trend of the anthropogenic pollution in the core sediment.
Osaka Bay is a Iarge enclosed bay in Japan. The surrounding area of Osaka Bay has thriven as an economy center of Japan since the old age.
Especially, the industrial and residential activities of this district are very high after the Meiji restoration 1868. Osaka City, Kobe City and Sakai City, one of the largest metropolitan areas in Japan, are at the north corner of Osaka Bay. The pollutants discharged from these cities becomes a main pollution source of Osaka Bay, because it produces
great amounts of pollutants, released as domestic and industrial wastewaters to Osaka Bay. In particular, Osaka City, the second largest urban area in Japan, is a main source of anthropogenic impact of the pollution. The pollutants are mainly transported through the Yodo River to the inner part of Osaka Bay. The contamination levels of the pollutant such as heavy metals in the surface sediment are extremely high.
Therefore, the quality of aquatic environment in this marine ecosystem has been profoundly influenced by the economic development of Japan after the Meiji restoration''3). In this study, sediment core sample collected from the Yodo River estuary in Osaka Bay. The vertical distributions of heavy metals, sulfur and phosphorus in the core were
--- 35 —
analyzed to assess the history of anthropogenic pollution from the urban area around Osaka Bay.
The behavior of contaminated heavy metals in the sediment was also evaluated.
2. Sample Collection and Methods 2.1. Sample Collection
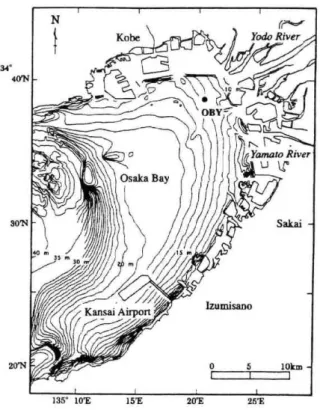
Figure 1 shows a map of the study area and sampling site. Sediment core was collected by scuba divers using an acrylic corer (120cm length, 10cm inner diameter) in the Yodo River estuary of Osaka Bay (Site OBY) in September 2001.
The core sample of the 86 cm length was collected. Sediment is composed of homogeneous mud, indicating deposition in a relatively low-energy and stable environment. Although no laminations were visible, both 210Pb and 137Cs profiles suggest minimal bioturbation. Core OBY was continuously subsampled at 2cm intervals. The subsamples were dried at 105°C and homogenized using an agate mortar for analyses.
2.2.Determination of the Sedimentation Rate and the Age of Sediment Core
The activity of 21°Pb and 137Cs in each section was determined by gamma counting 20 g of sample for up to 2 X 10⁵ seconds using an ORTEC HPGe Detector (LO-AX/30P) coupled to a 4096 channel multichannel analyzer. An activity standard, having essentially the same geometry and density, was prepared from NIST Standard Material 4350B (River sediment), 4354 (Freshwater Lake Sediment), and 4357 (Ocean Sediment). The detection limits for 21°Pb (E y :46keV) and 137Cs(E y :662keV) by this spectrophotometric method are 6 and 0.5 Bq/kg, respectively.
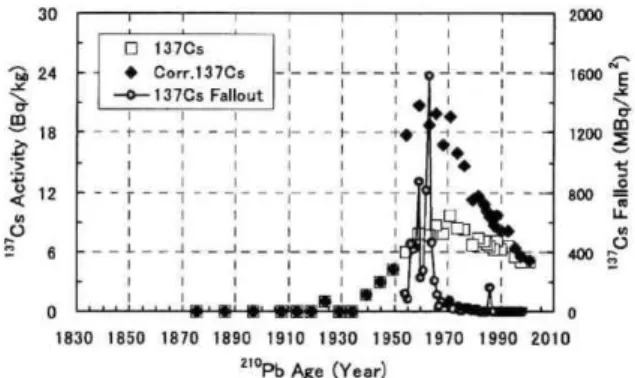
The 21°Pb chronology was applied to the determination of core age4' 5) which core depth is corrected for the compaction of core sediment6). It also employed a geochronology based upon the fallout profile of fission product 137Cs from the stratosphere where it was introduced by nuclear testing7). The 137Cs profile was corrected for decay during the time between the measurement and the sediment deposition, only for the period after ca.1950 because the 137Cs should theoretically not be detected before then. As shown in Figure 4, the 137Cs profile in the core sediment corroborated the time profile of global fallout of 137Cs, it is suggested that the estimated sedimentation age by this 21°Pb method is reliable.
2.3.Analysis of the Concentrations of Heavy Metals, Total Sulfur (TS) and Total Phosphorus (TP)
The concentrations of chromium, nickel, copper, zinc, arsenic, lead, total sulfur (TS) and total phosphorus (TP) in sediment were determined by XRF analysis using a RIGAKU XRF Analyzer (RIX-2000). A calibration standard was prepared from NIST Standard Material 1646 and I646a (Estuarine Sediment)8. The analytical errors of heavy metal analysis by this method were within
±5% for SRM1646. The precisions of TS and TP analysis were also same value of the heavy metals.
3. Results and Discussion
3.1.Sedimentation Rate and Age of the OBY Core by the 21 °Pb Method
Figure 1. Site description coring position (OBY)
of Osaka Bay and The sedimentation rate changes with the age are because the sedimentary environment changes in Osaka Bay. The sedimentation rate was determined by using the 21°Pb method, and the age of
36 —
sedimentation was estimated for each depth of the core. Results were shown in Figure 2. The sedimentation rate of the depth that corrected the compaction were 0.99cm/yr from the surface to 10cm depth, 2.20cm/yr from 10cm to 20cm, 1.02cm/yr from 20cm to 36cm, and 0.62cm/yr under 36cm. The age of sedimentation at 85 cm depth was estimated with 1830 which the deepest layer of the core. Therefore, this core will be recorded the historical trends of anthropogenic impact of pollutants from the Kansai district after the Meiji restoration.
the depth in 45cm of this core (see Figure 3). As shown in Figure 4, the concentration maximum of 137Cs in the core existed at 1960-1970 . The vertical distribution of 137Cs in the core agreed well with the historical profile of global fallout of 137Cs"). It could be verified to be right the 210Pb age. It is shown that the age of sedimentation estimated with 210Pb method in this study is the high reliability values.
0 10 20 30 40 50 60 70 80 90 100 Depth in Core (cm)
Figure 2. Relationship between the 210Pb age and the core depth of OBY
U IU LU OU 41U OU bU /U bSU yU lUU
Depth in Core (cm)
Figure 3. Depth profiles of water content and the decay corrected concentration of 137Cs
Figure 3 shows the vertical distributions of water content and 137Cs concentration. The water content decreased with the depth, and it showed the anomaly at the depth in 10-20cm. It was considered that the layer also showed the large sedimentation rate, and this anomaly is the evidence in which the sedimentary environment a major changes in this age.
The 137Cs was detected in the upper layer from
-'b Age yYear)
Figure 4. Comparison of the historical trend of the global fallout 137Cs and the vertical profile of
137Cs concentration in the OBY core
3.2. Sedimentary Environment of the OBY Core The relation between historical trends and human activities in Osaka Bay are described in detail'-3' 9'
10). The vertical distribution of manganese, TS and TP were shown in Figure 5. These elements are discharged to the environment by the human activity, but it is easy to receive the diagenesis in the sediment.
The concentration of manganese was relatively high in the surface layer of the sediment. The seawater well mixed because Osaka Bay is shallow, and it is shown that the surface layer of sediment is oxidative environment. However, the sedimentary environment reductively changes, because the decomposition of the organic substance advances in the sediment with the depth. Therefore, the concentration of TS rises with the depth, because it is fixed as a sulfide in the sediment, by reducing the sulfate ion. The increase of the anthropogenic inflow from the coastal area of Osaka Bay is a cause on the increase of the concentration of TP with the depth.
The vertical distributions of major elements of the sediment core were shown in Figure 6. The concentration of the elements also slightly increased with the depth. Probably, this is because
the organic substances in the sediment decomposec with the progress in the time after precipitation. A!
the result, the relative concentration of the elemerr will increase with the depth, because the organic substance concentration decreases with the depth Therefore, the major component of the sedimeni seemed to not change during the sedimentatior period in this study.
historical trend of the load by the human activity from the coastal area of Osaka Bay. Nickel is difficult to be precipitated in the sediment, because it is easy to exist as a water-soluble ionic species in an aquatic environment.
0 10 20 30 40 50 60 70 80 90 100 Depth in Core (cm)
Figure 5. Vertical distributions of Mn, TP and TS in the OBY core
Depth in Core (cm)
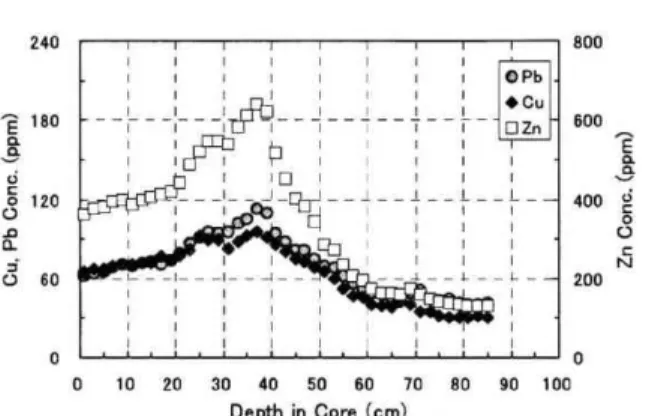
Figure 7. Vertical distributions of Cu, Zn and Pb in the OBY core
0 ---... 0.0
0 10 20 30 40 50 60 70 80 90 100 Depth in Core (cm)
Figure 6. Vertical distributions of Al, Fe and Ti in the OBY
3.3. Vertical Distribution of Heavy Metal in the OBY Core
Figures 7 and 8 show the vertical distribution of heavy metals in the OBY core. The concentration of these elements in the deepest layer is almost equal to sediment without anthropogenic contamination.
Except for nickel, the concentration of the heavy metals increased from bottom layer to upper layer, and the maximum values were shown at the depth of 35-40cm. In the upper layer, the concentrations decreased for the surface. It is considered that the vertical profiles of the heavy metals reflect the
Depth in Core (cm)
Figure 8. Vertical distributions of Cr, Ni and As in the OBY core
3.4.Historical Trend of the Heavy Metal Pollution in the OBY Core
Figures 9 and 10 show the historical profiles of the concentration of heavy metals in the OBY core.
In these figures, the horizontal axis was expressed in the estimated age of sediment by the 210Pb method. The age in the sediment surface was 2001, and the age in the bottom layer (85cm depth) was 1830. The layer of 35-40cm where the highest concentration of heavy metals showed was 1955-1965.
The relationship between the historical trend of the heavy metal pollution in Osaka Bay and human activities around the coastal area was analyzed in the following. The contamination of heavy metals
in the Osaka Bay sediment began after the Meiji restoration 1968. The history of the heavy metal pollution in Osaka Bay agreed with the time trend of the economic growth of Japan after the Meiji restoration, and the pollution of Osaka Bay rapidly increased from Russo-Japanese War (1904-1905).
The increasing trend of the heavy metal pollution continued by the high economic growth period after the World War If . The peak of the contamination of the heavy metals was recognized from 1960's to 1970's, and it agreed with the profile of an output of these elements in Japan12). According to the effect of legal restrictions and the improvement on the processing technology of a waste including the heavy metals, the concentration of heavy metals in the sediment has tended to decrease recently. It was also shown in Figures 9 and 10, that the situation of the today's heavy metal pollution of Osaka Bay is equal to before the World War II.
recognized large fluctuation, the flux of lead to the sediment showed the remarkable peak9° 10) This shows that the concentration of suspended particles in the seawater of Osaka Bay increased during in the period of the large reclamation construction.
3.5.Behavior of the Contaminated Heavy Metal in the Osaka Bay Sediment
The correlation between the concentrations of heavy metals in the core sediment was examined.
The concentrations of chromium, copper and lead for the concentration of zinc in the sediment were shown in Figure 11. The correlation coefficient was respectively over 0.98, and the correlation between these elements might be extremely high. This result
shows that the origin of heavy metals, which has contaminated the sediment of Osaka Bay was discharged by the industrial activity of the coastal area.
21°Pb A ge (Year)
Figure 9. Historical trends of the concentrations of Cu, Zn and Pb in the OBY core
0 I 1I
0 200400
Zn Conc.(ppm) Figure 11. Correlation between the OBY core
600
heavy
800
metals in
200 40
0 0
1830 1850 1870 1890 1910 1930 1950 1970 1990 2010 210PbAge(Year)
Figure 10. Historical trends of the concentrations of Cr, Ni and As in the OBY core
0 I _I. IlI . I ..I . I 0 0.4 0.5 0.6 0.7 0.8 0.9 1.0 1.1 1.2
TS Conc. (%)
Figure 12. Correlation between heavy metal and TS in the OBY core
The anomaly of water content in the core depth of 10-20cm coincided with the period during which the Kansai Airport was constructed. Though concentration of heavy metals in this period not
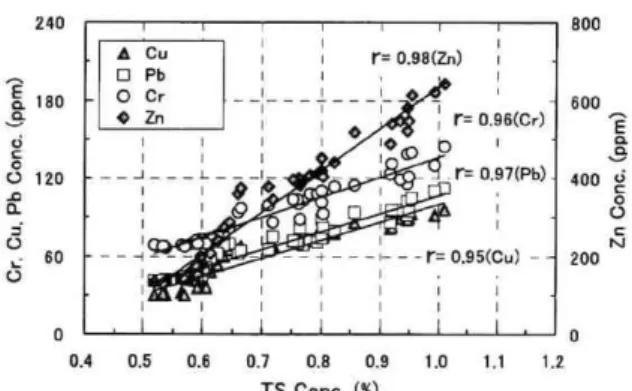
The relationship between the heavy metal concentration and TS concentration in the sediment was shown in Figure 12. The quite high values over
0.95 of the correlation coefficients were also shown.
It was indicated that the contaminated heavy metals were being fixed in the sediment as a sulfide.
4. Conclusions
The historical trend of the heavy metal pollution in the sediment of Osaka Bay was analyzed. The contamination of heavy metals in Osaka Bay increased from after the Meiji restoration by high economic growth period after the World War II.
However, the heavy metal pollution of the Osaka Bay sediment rapidly decreased after 1970's by legal restrictions and improvement on the processing technology of the industrial wastes. The heavy metal pollution in Osaka Bay was greatly affected from human activity of coastal area clarified. The correlations of the concentration of heavy metals and TS were very high, and it was estimated that the contaminated heavy metals were being fixed in the sediment as a sulfide.
Acknowledgments
I thank Professor S. Sakai of Kyoto University for sampling of core sediment. This work was partially supported by a Grant-in-Aid for Waste Treatment Research from the Ministry of the Environment and a Grant-in-Aid for Scientific
Research Science.
from Japan Society of the
References
Promotion of
1) Yasuhara, M., and H. Yamazaki, Mar.
Micropaleontol., 55, 63-74 (2005).
2) Tsujimoto, A., R. Nomura, M. Yasuhara, H.
Yamazaki and S. Yoshikawa, Mar. Micropaleonto.,
60, 258-268 (2006).
3) Yasuhara, M., H. Yamazaki, A. Tsujimoto and K.
Hirose, Limnol. Oceanogr., 52,1633-1644 (2007).
4) Goldberg, E. D. and M. Koide, Geochim.
Cosmochim. Acta, 26, 417-450 (1962).
5) Goldberg, E. D., Radioactive Dating, IAEA, 121-131 (1963).
6) Matsumoto, E., Geochem. J., 9, 167-172 (1975).
7) Robbins, J. A. and D. N. Edgington, Geochim.
Cosmochim. Acta, 39, 285-304 (1975).
8) Gohda, S., H. Yamazaki, M. Hirata and T.
Nagasawa, Bunsekikagaku, 36, 199- 203 (1986).
9) Yamazaki, H., Sci. Tech., Res. Inst. Sci. Tech., Kinki Univ., 19, 31-34 (2007).
10) Yamazaki, H., S. Yoshikawa and S. Inano, Proceed. China-Japan Joint Sympo. Environ.
Chem., 156-157 (2004).
11) Radioactivity Survey Data in Japan, NIRS, Chiba (1963 eds. — 1990 eds.).
12) The Trend of Mining and Manufacturing
Industries in Japan, The Ministry of International
Trade and Industry, Japan, (Each year editions).