SUMMARY The arrival of the era of the Internet of Things (IoT) has ensured the ubiquity of human-sensing technologies. Cameras have become inexpensive instruments for human sensing and have been increasingly used for this purpose. Because cameras produce large quantities of information, they are powerful tools for sensing; however, because camera images con- tain information allowing individuals to be personally identified, their use poses risks of personal privacy violations. In addition, because IoT-ready home appliances are connected to the Internet, camera-captured images of individual users may be unintentionally leaked. In developing our human- detection method[33],[34], we proposed techniques for detecting humans from unclear images in which individuals cannot be identified; however, a drawback of this method was its inability to detect moving humans. Thus, to enable tracking of humans even through the images are blurred to protect privacy, we introduce a particle-filter framework and propose a human- tracking method based on motion detection and heart-rate detection. We also show how the use of integral images[32]can accelerate the execu- tion of our algorithms. In performance tests involving unclear images, the proposed method yields results superior to those obtained with the existing mean-shift method or with a face-detection method based on Haar-like fea- tures. We confirm the acceleration afforded by the use of integral images and show that the speed of our method is sufficient to enable real-time operation. Moreover, we demonstrate that the proposed method allows suc- cessful tracking even in cases where the posture of the individual changes, such as when the person lies down, a situation that arises in real-world usage environments. We discuss the reasons behind the superior behavior of our method in performance tests compared to those of other methods.
key words: camera, heart rate, human detection, IoT, privacy
1. Introduction
Recent years have witnessed the dawning of the era of the Internet of Things (IoT)[1],[2], in which a wide variety of machines and devices—from transportation vehicles such as automobiles, trains, and airplanes, to home appliances such as televisions and refrigerators, to medical instruments and more—connect to the Internet for automated transmission and reception of myriad types of data with no need for human intervention. The electric appliances that we use at home ev- ery day are now equipped with various types of sensors and the capacity to send and receive data for the purpose of offer- ing improved services[3]–[6]. For household appliances, in order to offer services customized to suit each user’s status,
Manuscript received May 11, 2018.
Manuscript revised August 10, 2018.
Manuscript publicized October 15, 2018.
†The authors are with Samsung R&D Institute Japan, Minoh- shi, 562-0036 Japan.
††The authors are with Graduate School of Engineering Science, Osaka University, Toyonaka-shi, 560-8531 Japan.
a) E-mail: [email protected] DOI: 10.1587/transcom.2018SEP0006
Fig. 1 Leakage of user privacy via the Internet and a camera.
it is necessary to perform various types of sensing operations in the household. Because cameras have become inexpen- sive, they have become used as human-sensing devices in an increasing number of cases. The ability of cameras to gen- erate large quantities of information makes them valuable tools as sensing instruments; however, cameras as sensors also capture images of the faces, clothing, meals, and other aspects of the private lives of people, raising concerns of in- vasion of personal privacy. The arrival of the IoT era, as well as the increasing Internet connectivity of home appliances, thus creates risks of unintended leaks of user images cap- tured for sensing purposes (Fig. 1). Some users concerned about such risks have even begun to restrict their purchases of Internet-connected, camera-equipped appliances. Thus, it is desirable to develop devices capable of conducting sensing operations while protecting users’ privacy.
Methods exist for detecting humans with existing sen- sors alone, without using camera images. These methods use pyroelectric sensors known ashuman-proximity sensors[7]–
[10]or temperature sensors[11]–[13]to detect human be- havior. These sensors are capable of detecting whether peo- ple are present within the range of the sensors but cannot detect the positions or orientations of any people that are present. Human-detection methods based on thermal imag- ing also exist[14]–[17], but these suffer from the drawback that capturing thermal images requires specialized elements and lenses, increasing system cost. Other methods use elec- tromagnetic waves to detect humans[18], but these are ca- pable only of determining whether people are present and cannot measure their positions. Methods do exist for mea- suring the positions of individuals using arrays of multiple Copyright © 2019 The Institute of Electronics, Information and Communication Engineers
antennas[19], but the need for multiple antennas increases both cost and sensor size.
The objective of this paper is to use cameras to not only determine whether humans are present but also mea- sure their positions and orientations, all while protecting individual privacy. Previously reported methods for pro- tecting privacy include the use of software to blur facial features in captured images[20],[21]and the use of com- puter graphics to interchange regions in which individuals are present[22]. One proposed method uses a framework in which images cannot be reviewed without an authentica- tion key[23]. However, in view of the risk that the original camera-captured images could be hacked, in order to ensure security, it is necessary that privacy protections be in place already at the image-acquisition stage.
There also exist many human-detection methods based on existing techniques for processing camera images. Com- monly used methods of this sort include face-detection meth- ods that make use of Haar-like features and AdaBoost[24]
and human-detection methods based on histogram of ori- ented gradients (HOG) features [25]. These methods are effective when applied to clear images, but they cannot iden- tify light/dark contrasts or contour features in images of in- sufficient clarity, whereupon they do not work as human- detection methods. A tracking method known as themean- shiftmethod, which does not require clear images, has been proposed[48]–[50], but this requires that a target image be specified at the beginning of the tracking process, thus ne- cessitating manual human intervention.
In developing our human-detection method[33],[34], we proposed techniques for detecting humans from unclear images in which individuals cannot be identified; however, a drawback of this method was its inability to detect mov- ing humans. In this paper, we remedy this shortcoming by proposing a tracking method based on a particle-filter frame- work using motion detection and heart-rate detection. The heart-rate-detection method uses the same method used in our previous work[33],[34]. In other words, we add the tracking function to our human-detection method. Because this method entails large numbers of repeated calculations, we use integral images[32]to accelerate the process. To as- sess the performance of our method, we characterize its abil- ity to perform tracking on unclear images in comparison with two existing methods: the mean-shift method and a face- detection method using Haar-like features. We also measure processing time and confirm the acceleration afforded by the use of integral images. Finally, we conduct tracking experiments in cases involving individuals lying down—a phenomenon that arises in actual usage environments—and assess the effectiveness of the proposed method.
2. Methods
Conventional human-detection methods based on camera images make heavy use of information on the appearance of the detected individuals and thus require clear, sharp im- ages. However, to protect the privacy of users, one cannot
capture clear images in which individuals could be identi- fied; thus, we use methods that do not utilize appearance information. In previous work[33],[34], we reported the development of a human-detection method in which heart rates were measured from camera images. This method was applicable only to humans at rest; however, practical daily- life environments include humans in motion, and so we pro- pose a tracking method adapted to human motion. In this section, we discuss the two core elements of our detection method—heart-rate-detection method and motion-detection method—then discuss the particle filter that forms our track- ing framework.
There are several reports on the method of measur- ing the heart-rate from camera images[35]–[39]. In these methods, a face region is detected, and heart-rate measure- ment is performed for that region. Processing is performed using three intensities of RGB in the face region as three signals. Independent component analysis or principal com- ponent analysis is applied to these three signals in order to estimate heart-rate. We reported a method to accurately estimate heart-rate from one signal without using three sig- nals[40],[41]. The use of a single signal is distinctive in that heart-rate can be estimated in the same method using both a visible-light camera and a near-infrared camera. Fur- thermore, because of the small amount of calculation, it is suitable for repetitive processing. Based on these advan- tages, we will use our heart-rate detection method in this study.
2.1 Heart-Rate-Detection Method
In this section, we discuss our framework for measuring heart rates from human skin. The heart rate measures the rate at which blood flows through arteries; arterial blood contains large quantities of oxygenated hemoglobin. Figure 2 shows the absorption spectrum of oxygenated hemoglobin [42];
as the figure shows, oxygenated hemoglobin is strongly ab- sorbed at wavelengths in the range 500 to 580 nm. Fig- ure 3 shows the correspondence between wavelength and color[43]; we see that the 500 to 580 nm range corresponds to green and yellow light. More specifically, 560 to 580 nm corresponds to yellow and 490 to 560 nm corresponds to green; thus, the range of wavelengths corresponding to green is broader than that for yellow, allowing more absorption for oxygenated hemoglobin. Commonly sold heart-rate sensors that target the finger[45], the arm[46], or other body parts take advantage of the green-light-absorbing properties of oxygenated hemoglobin in the blood to measure heart rate.
Figure 4 illustrates the measurement principles of green- light-based heart-rate sensors[44]. The sensor is equipped with a green LED and a photodetector. The LED is used to shine green light on the skin of the participant and the reflected light is collected by the photodetector. As the ca- pacity of the blood vessels changes with the heart rate of the participant, the intensity of the light received by the photode- tector reading varies, yielding waveforms like those shown in the graph on the right side of Fig. 4. The participant’s heart
Fig. 2 Absorption spectrum of oxygenated hemoglobin[42].
Fig. 3 Correspondence between wavelength and color[43].
Fig. 4 Measurement principles of heart-rate sensor[44].
rate may be detected from these waveforms. In this paper, we apply this basic operating framework to facial images.
We apply the heart-rate-measurement procedure to various regions of camera-captured images and assume that a human face is present in any region for which the measured value is close to that of a human heart rate.
First, before capturing camera images, we reduce the clarity of the image, for example, by placing a frosted glass screen in front of the camera or moving the position of the lens focus, until individual faces can no longer be identified.
Figure 5 shows an ordinary camera-captured image, and Fig. 6 shows a blurred image obtained by moving the focus of the lens.
Regions A and B in Fig. 7 are respectively a background region and a region corresponding to a participant (human region). Because indoor illumination and sunlight contain green light, we identify only the intensity of green (G) light acquired by the RGB camera. The intensity of green light represents the pixel value of G componet. Figures 8 and 9 show plots of the intensity of green light averaged over the pixels of each of Regions A and B, respectively, for a 30 s interval. Figure 8 shows that the background region exhibits minimal variation in green-light intensity, whereas the wave- form of Fig. 9 for the human region shows oscillations at a fixed frequency, corresponding to a human heart rate.
We next compute the fast Fourier transform (FFT) of
Fig. 5 Image captured with an ordinary camera. (Facial features have been blurred to protect the privacy of the participants.)
Fig. 6 Image blurred by shifting the position of the lens focus.
Fig. 7 Regions of the Fig. 6 image for analysis: Region A: background region. Region B: human region.
the average green-light intensity for each region. For this purpose, we use a rectangular temporal window function whose range extends backward from the time of the present data sample. The temporal window is advanced sequentially with overlap with the preceding interval. This yields the frequency-domain power spectra shown in Figs. 10 and 11 for the background region and human region. We next as- sess whether a human heart rate can be detected from these
Fig. 8 Green light intensity averaged over the pixels of Region A.
Fig. 9 Green light intensity averaged over the pixels of Region B.
power-spectrum results. We establish a range of heart rates to ensure that measured values not corresponding to human heart rates are identified as lying outside the target region.
For this method, we assume that possible human heart rates lie in the range 50 to 120 bpm. This range corresponds to typical indoor activities of daily life, versus vigorous ex- ercise or illness. The shaded regions in Figs. 10 and 11 correspond to heart rates of less than 50 bpm; thus, these regions lie outside our target search range. In addition, be- cause small values of the power spectral density arise with high probability from sources other than human heartbeats, we assume that no humans are present in regions with power values lying below a certain fixed threshold. The thresh- old value was determined from a rule of thumb. Generally, there is nothing that periodically moves in the background, so the power spectrum of human heartbeats is the highest.
We chose the threshold to separate human heart-rate from background noise (See Sect. 4.2). If there are multiple power values exceeding the threshold, we take the frequency corre- sponding to the largest power value as our heart-rate value.
When the camera captures multiple people, it is mostly that people exist in different areas. However, if there are mul- tiple people in the same region, this method can estimate the heart-rate of only one people. But it does not affect the judgment of whether there are people. In other words, if one heart-rate can be measured, the existence of people can be detected. Applying these decision criteria to the power spectrum of Fig. 10, we find no power values exceeding the threshold (red dashed line), whereupon we conclude that
Fig. 10 FFT calculation of the signal in Region A.
Fig. 11 FFT calculation of the signal in Region B.
no human is present in this region. On the other hand, in Fig. 11, the power rises above the threshold at frequencies near 0.95 Hz; this frequency corresponds to a heart rate of 60×0.95=57 bpm, whereupon we conclude that a human is present in this region.
2.2 Motion-Detection Method
We use a frame-differencing method to detect humans in motion. LetIt−1andItdenote images captured at timest−1 andt, which are separated by a time step∆. Then we take the difference between two images to be the quantitys(It,z) defined by
s(It,z)=|p(It,z)−p(It−1,z)| (1) where z denotes the pixels in It, and p(It,z) denotes the pixel values of imageIt, for which are used grayscale values converted from the three RGB values. Based on these image- difference values, the pixelszcan be divided into two classes.
Figure 12 shows a difference image obtained for a case in which a person is moving from left to right; the quantity plotted here iss(It,z)as defined by (1). White pixels corre- spond to large values of s(It,z), indicating the presence of motion.
Based on the results of the differencing operation, we perform binary quantization in the region of motion, as fol- lows:
d(It,z)=
( 1 i f s(It,z)>Ta
0 ot herwise (2)
Fig. 12 Difference between two consecutive images.
whereTadenotes the threshold value andd(It,z)denotes the binary-quantized pixel values. Ifd(It,z)takes the value 1 at large numbers of pixels in a given region, then we conclude that human motion was present in that region.
2.3 Particle Filter
To reduce processing time and ensure robust tracking, we introduce a particle filter (also known as a Monte Carlo method) for tracking[26]–[29]. A particle filter is a method of state estimation in which large numbers of particles in a state space are used to approximate the distribution of states, with temporal updates of the state distribution determined by numerical computation of particle values. This method is well known as a technique for tracking targets in images, where it is used in cases requiring robust tracking[30],[31].
Here we consider particle-filter-based state estimation as ap- plied to a state-space model.
To track a target object through multiple image frames, the particle-filter method repeatedly performs a computation that are divided into the following steps.
1. Initialization
Create particles at the initial position of the target.
2. Prediction
Evolve the particles in accordance with a state-transition model.
3. Observation
Compute the likelihood for each particle.
4. Resampling
Resample particles in proportion to likelihood values and go to step 2,Prediction.
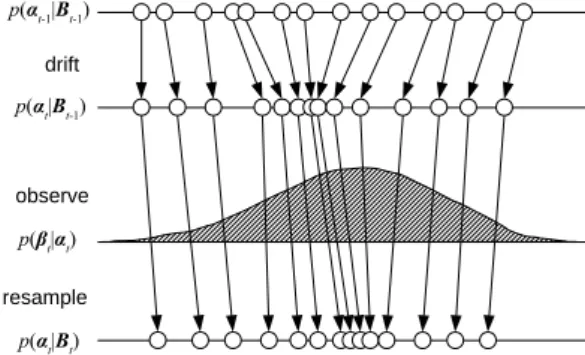
Figure 13 shows a schematic depiction of the procedural flow of this algorithm. The white circles in this figure denote the positions of particles. Here,αtandβtare respectively a state vector comprising state parameters for a target object and an observation vector comprising observed features.
At time stept, each particle in the posterior distribu- tion p(αt−1|Bt−1) for the previous time step is evolved us- ing the state-transition model (see Sect. 2.3.1) to yield the prior distribution p(αt|Bt−1). Next, the likelihood values
Fig. 13 Schematic overview of the particle-filter algorithm.
p(βt|αt) for state αt at that time are computed using the likelihood function (see Sect. 2.3.2). From the prior distri- bution p(αt|Bt−1)and the likelihood values p(βt|αt)thus obtained, we compute the posterior distribution p(αt|Bt).
Then we resample each particle in accordance with the pos- terior distribution p(αt|Bt) and proceed to the next time step.
2.3.1 State-Transition Model
The elements of the state vectorαtare determined as follows:
αt={xt, yt,ut, vt, wt} (3)
ξt∼N(0,Σ5) (4)
ξt={ξ1t, ξ2t, ξ3t, ξ4t, ξ5t} (5)
xt+1 =xt+ut∆+ξ1t (6)
yt+1=yt+vt∆+ξ2t (7)
ut+1 =ut+ξ3t (8)
vt+1=vt+ξ4t (9)
wt+1=wt+ξ5t (10)
where αt consists of five elements, as shown in (3); xt and yt indicate the two-dimensional position of the target object at time stept;∆denotes the time difference between successive time steps; ut and vt indicate respectively the horizontal and vertical velocities of the target (note that xt andytare assumed to follow straight-line motion at constant velocities); and wt indicates the size of the image region taken as the search region. In (4), ξt is chosen randomly from a five-dimensional normal distribution with mean 0 and covariance Σ5. The quantityξt is then added to each element in (6) through (10). This is known as arandom walk, and is an effective method for cases involving complicated evolution in the presence of randomness.
Figure 14 is a visualization of the state vectorαtof the prior distributionp(αt|Bt−1). The center of each rectangular region in this figure corresponds to the xt, yt coordinates of the position of a particle, and the size of the rectangles indicate the size wt of the search region. Becauseut and vtdenote particle velocities, they are not shown in this plot.
The centers of the rectangles in Fig. 14 are scattered about a single central point; from this, and the fact that rectangles of various sizes are present, we see the randomness present in
Fig. 14 Sample image depicting the ranges of the search regions for each particle.
the quantitiesxt,yt, andwt. 2.3.2 Likelihood Function
The likelihood function, which determines the likelihood of observations, consists of two elements, corresponding to human motion and human heart rate. We design the system such that, in cases where human motion is present, the likelihood is higher when there are more pixels indicating motion within a fixed region. If no human motion is present, we design the system to ensure that the likelihood increases as the heart-rate count within a region approaches a preset heart-rate value. The fraction of pixels indicating motion is expressed as follows:
rt= Dt
At ×100 (11)
HereDtis the number of pixels in the target region for which d(It,z) =1 [(2)], where “target region” refers to one of the rectangular regions in Fig. 14;Atdenotes the total number of pixels in the target region; andrtdenotes the fractional area of the target region occupied by pixels indicating motion.
Based on the presence of human motion, we vary the quantity tused for likelihood calculations.
t=
p(100−rt)2 i f (rt >Tb)
p(r H R−H Rt)2 ot herwise (12)
In (12), if the quantity rt computed by (11) exceeds the threshold Tb, then we input a value for t to ensure that the likelihood increases in proportion to the image area occupied by pixels at which motion is present. Ifrt falls below the thresholdTb, then we use heart-rate information.
In the equation,H Rtdenotes the heart-rate value computed for the target region, andr H Rdenotes the preset heart-rate value. We input values fort to ensure that the likelihood increases asH Rtapproachesr H R. The likelihood function determined bytis given as follows:
L(t)= 1
√2πσexp − 2t 2σ2
!
(13)
Fig. 15 Integral image.
where here we have defined the likelihood function to be a normal distribution with mean 0 and varianceσ, and each particle is tracked in accordance with this likelihood.
2.3.3 Integral Images
The use of the particle filter for tracking involves performing heart-rate detection in multiple regions, as shown in Fig. 14.
If the number of heart-rate-detection steps to be performed were to grow with the number of particles, the computational cost would be enormous, making real-time processing dif- ficult. To address this issue, we use an integral image[32]
to accelerate computations. The pixel values of the integral image are defined as follows:
ii(x, y)= X
x0≤x, y0≤y
i(x0, y0) (14)
whereii(x, y)is the integral image andi(x, y)is the original image. The pixel value of the integral image at position(x, y) is the sum of all pixel values in the rectangle with one vertex at(x, y)and the opposite vertex at the lower-left corner of the image. The sum of the intensity values within region SDin Fig. 15, that is, within the rectangle whose corners are (x−W, y−H)and(x, y), can be computed as follows:
SD=ii(x, y)−ii(x−W, y)−ii(x, y−H)+ii(x−W, y−H) (15) By precomputing the integral image, we ensure that the total pixel values within any arbitrary rectangular region can be computed with just a few arithmetic operations. For heart- rate detection, we precompute an integral image containing just the G portion of the RGB values to allow accelerated computation of mean values in a region.
2.3.4 Process Flow
The flow of processing in one particle is shown in Fig. 16.
The position and size of one region are determined by drift- ing. Motion detection is performed in that region (see Sect. 2.2). If it is determined that there is motion in that
Fig. 16 Process flow.
region, the motion information is used as the likelihood (see Sect. 2.3.2). If there is no motion in that region, the haert-rate information (see Sect. 2.1) is used as the likelihood. This cal- culation of heart-rate is speeded up by integral images (see Sect. 2.3.3). As described above, observation is performed by changing the calculation method of likelihood depending on the presence or absence of motion.
3. Performance Evaluations
3.1 Test Environment
We next report tests conduct to assess the performance of the human-tracking capabilities of the proposed method. The camera we use, shown in Fig. 17, is equipped with a motor to allow the position of the lens to be manipulated by soft- ware[47]. The lens offers 1000 steps of position adjustment.
Using this camera, we capture images at VGA resolution and a frame rate of 30 frames per second (fps); the camera is con- nected to a PC via USB 2.0 for image acquisition. The spec- ifications of the camera used in our experiment and the PC used for processing are listed in Tables 1 and 2, respectively.
We consider the problem of a camera tracking a human participant watching television in a living room, and we conduct tests involving this scenario. The participant sits at a distance of 1 m from the camera and is instructed to change seating position every 30 s, in order to ensure that tracking performance is tested for a person in both states of rest and states of motion. To ensure that our images are privacy- conscious, we displace the lens position 0.3 mm to the front, in order to blur the captured images to such an extent as to prevent personal identification of individual participants.
Figure 18 shows the experimental setup. The only source of indoor illumination is the fluorescent light mounted on the ceiling; we captured images in the indoor environment with sunlight entering from the window. We performed tests on a group of 10 participants who voluntarily cooperated in the experiment. The experiment was approved by the Ethical Committee of the Graduate School of Engineering Science (27-5), Osaka University, Japan.
Fig. 17 Manual focus camera[47].
Table 1 Manual focus camera specifications.
Type RGB
Resolution (pixels) 640×480
Frame Rate (fps) 30
Gradation (bits) 8 (1ch)
Focus control resolution (levels) 1000
Table 2 PC specifications.
Model Dell OptiPlex 9010
CPU Intel(R) Core(TM) i7-3770 3.40 GHz
Memory 32.0 GB
OS Windows 7 64-bit
Fig. 18 Experimental environment for performance tests.
We set the number of particles in the proposed method to 200 and the minimum and maximum sizes of rectangular search regions to 40 × 40 pixels and 160 × 160 pixels, respectively. For the preset heart rater H Rin (12), we choose a value of 70 bpm and set the width of the FFT time window to 8 s. For each participant, we capture images for 90 s, yielding a total of 27,000 images.
As alternative methods to use for comparison, we chose our proposed method without heart-rate-detection, the mean- shift method[48]–[50]and a face-detection method based on Haar-like features [24]. The proposed method without heart-rate-detection uses only motion-detection method. we chose this method to confirm the contribution of heart-rate- detection method in human tracking. The mean-shift method is a tracking framework that is frequently used in image pro-
cessing as a method for tracking a target color histogram;
it is also commonly used for facial tracking. Because this method does not require image gradients or contour infor- mation, it may be expected to function even in cases involv- ing unclear images. However, the mean-shift method is a technique for tracking a specified region; it does not have human-detection capability, and thus the position of the par- ticipant’s face in the initial frame must be configured manu- ally. Because the method proposed in this paper offers both human-detection capability and tracking capability, compar- isons with the mean-shift method are somewhat incomplete, but we may use the mean-shift method for comparison of the tracking functionality alone. Our second method for compar- ison, the face-detection method based on Haar-like features, uses differences in image brightness to detect faces and is among the most well-known techniques for face detection.
We take the entire image as the target region for face detec- tion and track faces by comparing the position of the face detected in the current frame to the position of the face de- tected in the previous frame. For both the mean-shift method and the Haar-like feature-based face-detection method, we use the methods implemented in OpenCV (version 2.3.4).
Next we discuss the decision criteria used in our detec- tion process. First, within captured images, we determine by eye the region that may be considered the reference data of the participant. If the human-region rectangle computed by our human-tracking method overlaps at all with this refer- ence region, then we consider the human-tracking algorithm to have succeeded. If the two regions do not overlap, then we consider the algorithm to have failed. The images used here never include more than one participant, so each frame corresponds to a single trial. To characterize errors in iden- tified positions, we manually enter the center point of the participant’s face as the true value. Then we measure the error between the true value and the facial position com- puted by our human-tracking method. The detected regions and detected position predicted by our proposed method are obtained from the mean positions of the 20 particles with the highest likelihood values.
3.2 Results
Table 3 lists results of human tracking using our proposed method and those of the methods for comparison. The suc- cess rate is defined as the fraction of frames for which track- ing succeeded. As shown, the proposed method has the highest success rate of the four methods. The face-detection method based on Haar-like features is unable to extract fa- cial features from blurry, unclear images, and so this method fails to detect faces in a large number of frames, yielding a low success rate. In contrast, the mean-shift method is able to track the motion of participants and yields a high success rate. The proposed method without heart-rate-detection is lower in the tracking success rate than our proposed method.
We can confirm the advantage of heart-rate-detection in hu- man tracking.
Figure 19 shows the errors in tracked positions. The
Table 3 Human-tracking success rate.
Success Rate
Proposed method 90.1%
Proposed method without heart-rate-detection 61.7%
Mean-shift method 84.8%
Haar-like method 10.0%
Fig. 19 Average errors and standard deviations of position accuracies.
center of the detected face is output as the position of a pixel in the image; the error is first output in the form of a number of pixels, but for generality, we use the relationship between image angle and resolution to convert this to an an- gle. In Fig. 19, the vertical axis is the error compared with the true value; the error bars indicate standard deviations.
The face-detection method using Haar-like features mistak- enly identifies the wall in the background as a face, yielding large average errors in both the vertical and horizontal direc- tions. The average error in the horizontal direction incurred by the proposed method and by the mean-shift method are nearly equal, but the standard deviation is smaller for the pro- posed method. In the vertical direction, the proposed method yields an average error smaller by 2.6 degrees than that of the mean-shift error, with a smaller standard deviation as well.
The mean-shift method starts its tracking process with hand- specified values of the initial position and region size; de- spite these more favorable conditions, the proposed method achieves greater accuracy. There are differences between proposed method and proposed method without heart-rate- detection in the average error and standard deviation. Also from this result, the effectiveness of heart-rate-detection can be confirmed.
3.3 Measuring Processing Times
We used the integral-image technique discussed in Sect. 2.3.3 to accelerate the proposed method. To assess the effect of this technique, we measured processing time per frame. For these measurements, we used a set of 2700 images, each showing a single participant, taken from the image set cap- tured as described in Sect. 3.1. Table 4 shows the mean and standard deviation of the measured processing time. For the proposed method, the processing time per frame is 32.1 and 474.7 ms respectively with and without the use of integral images. This shows that the use of integral images signif- icantly accelerates the proposed method to yield reduced
Proposed heart-rate-detection 2.7 1.0
processing time. Note that the standard deviation of the pro- cessing time is large for the case in which integral images are not used. We attribute this to the fact that processing times increase in proportion to the size of the rectangular target region. In contrast, the standard deviation of the pro- cessing time is small when integral images are used because the processing time does not change from frame to frame.
We note that a processing time of 32.1 ms is less than the 33.3 ms time between frames being captured by a camera at 30 fps, and thus our proposed method is sufficiently fast to allow real-time processing.
3.4 Accuracy Evaluation of Heart-Rate-Detection Method The proposed method uses heart-rate-detection method as an element (See Sect. 2.1). Since it is judged whether or not there are people in the region by the detected heart-rate, the accuracy of heart-rate measurement affects human tracking performance. Therefore, heat-rate measurement accuracy is evaluated. The experimental environment is similar to Sect. 3.1, and 10 subjects sat at a distance of 1 m from the camera and were stationary. The measurement was done for 1 minute. The lens position of the camera is 0.3 mm forward and the blurred images were used. When a certain rectangular region is set for heart-rate-detection, the heart- rate within that region is output. In this evaluation, the rectangular area of the face was set manually. A belt-type heart-rate monitor[51]was used as reference data of heart- rate. Average errors and standard deviation of measured heart-rate and reference heart-rate are shown in Table 5.
In our method, if the measured heart-rate is 50 to 120 bpm, it is judged that there are people in the region.
In other words, the accuracy in the range of 70 bpm is re- quired, at least. According to the measurement result, the average error of heart-rate measurement is 2.7 bpm and it can be said that it has sufficient accuracy for discriminating the presence or absence of people.
3.5 Properly Accounting for Posture Changes
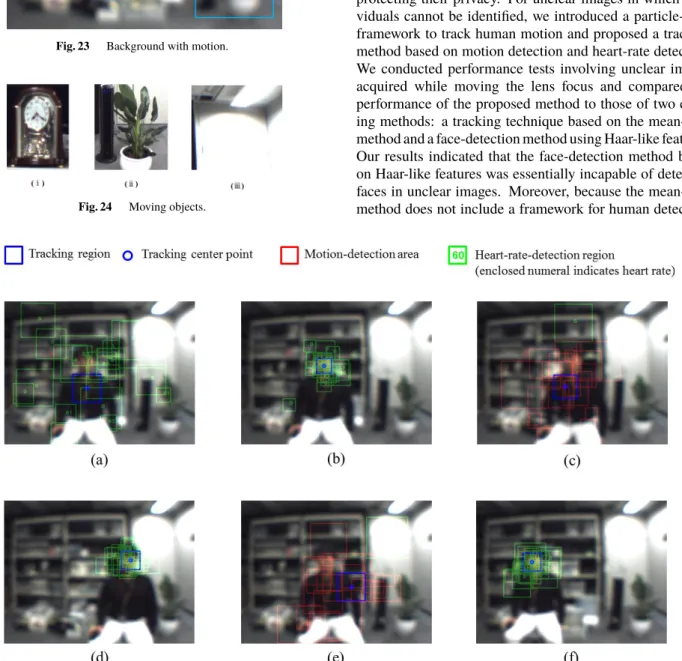
When tracking a person watching television in a living room, we must envision not only cases in which the person is seated, but also cases in which the person lies down to relax on a sofa. We tested the ability of the proposed method to al- low successful tracking in such cases. Figures 20(a)–(i) are images produced by the proposed tracking method. In these
react to motion. In Fig. 20(c), the participant sits on the sofa;
immediately after the participant sits, the particles disperse, indicating that a wide area is being searched. In Fig. 20(d), a heart rate is detected and particles collect in the vicinity of the participant’s face. In Figs. 20(e) and (f) the participant lies on the sofa; this motion is detected and the position of the participant’s face is then tracked via heart-rate detection. In Figs. 20(g) and (h), we see that the method correctly detects that the participant has left the room, indicating successful tracking of the participant’s position. Based on these results, we conclude that the proposed method successfully allows tracking even in cases involving posture changes, such as a person lying down.
4. Discussion
4.1 Difference Between Proposed Method and Mean-Shift Method
In this subsection, we discuss the difference in accuracy ob- served in Sect. 3.2 between the proposed method and the mean-shift method used for comparison. Figures 21 and 22 show respectively the temporal evolution of the horizontal and vertical errors for data on a single participant. In these figures, the position at which the participant is seated shifts at approximately 200, 500, and 800 s. For both the proposed method and the mean-shift method, the errors increase at the instant of the participant’s motion and then decrease at subse- quent time steps. This is because, although the tracking fails at the instant of the motion, it gradually returns to the posi- tion of the target body. However, for the mean-shift method the error increases at approximately 800 s and thereafter re- mains constant. This indicates that the tracking fails for the mean-shift method and does not subsequently recover. Be- cause the mean-shift method does not offer human-detection capability, it cannot recover in cases where the target body deviates significantly from the tracking region. In contrast, the method proposed in this paper uses motion and heart rate information to detect humans, allowing the method to recover even in cases where the trajectory deviates signif- icantly. In both Figs. 21 and 22, the error incurred by the proposed method increases after 800 s, following the mo- tion of the participant; the error remains large for some time thereafter but gradually decreases as the tracking recovers the position of the target body. That the proposed method but not the mean-shift method can recover in cases such as this amounts to a significant performance gap between the two methods.
Fig. 20 Tracking results for a scene involving a participant lying on a sofa.
Fig. 21 Time variation of horizontal error.
4.2 Various Backgrounds
We discuss the robustness in various backgrounds. The background shown in Fig. 23 was used. Figure 23 shows cluttered items on the shelf, which is a complicated back- ground. Also, in Fig. 23(i)–(iii), objects with movement that are in the living room are arranged. Figure 24 shows objects with motion. (i) is a table clock, the object under the dial always rotates. (ii) are fans and plants. Fans are constantly
Fig. 22 Time variation of vertical error.
swinging and the leaves of plants are constantly shaking by the wind of the fan. (iii) are the fluorescent light and the light reflected on the wall. It is thought that the flicker of the fluorescent light becomes a movement.
Human tracking was done using the background in Fig. 23. Figs. 25(a)–(f) shows the tracking results. In Fig. 25(a), the search is performed including the background with motion. In Fig. 25(b), particles are gathered at the posi- tion of the face, and human detection is performed correctly.
In Figs. 25(c)–(d), it is confirmed that people is moving close
Fig. 23 Background with motion.
Fig. 24 Moving objects.
Fig. 25 Tracking results in background with motion.
to the human heart-rate, and there was no value exceeding the threshold value. From these results, it can be confirmed that human tracking was executed correctly without being influenced by the background.
5. Conclusion
In this paper, we proposed and evaluated the performance of a method for detecting and tracking humans in images while protecting their privacy. For unclear images in which indi- viduals cannot be identified, we introduced a particle-filter framework to track human motion and proposed a tracking method based on motion detection and heart-rate detection.
We conducted performance tests involving unclear images acquired while moving the lens focus and compared the performance of the proposed method to those of two exist- ing methods: a tracking technique based on the mean-shift method and a face-detection method using Haar-like features.
Our results indicated that the face-detection method based on Haar-like features was essentially incapable of detecting faces in unclear images. Moreover, because the mean-shift method does not include a framework for human detection,
Fig. 26 Power spectrum in Fig. 23(i) region.
Fig. 27 Power spectrum in Fig. 23(ii) region.
Fig. 28 Power spectrum in Fig. 23(iii) region.
it requires manual configuration of initial positions; our per- formance tests indicated that the proposed method yields a performance superior to that of the mean-shift method in terms of both the tracking success rate and the accuracy of tracked positions. We noted that the proposed method can be accelerated through the use of an integral image; mea- surements of processing time confirmed the effectiveness of this acceleration and demonstrated that the speed of our method is sufficient to allow real-time operation. Moreover, we showed that the proposed method allows successful track- ing even in cases where the posture of the targeted human changes, such as when the person lies down on a sofa. The results of our performance tests indicate that the proposed method is an effective technique for tracking humans through images that protect user privacy. Since only one person can be detected in the current system, it is necessary to deal with multiple people in the future. In that case, it is necessary to prepare a plurality of trackers and take countermeasures for overlap of people.
References
[1] K. Ashton, “That ‘Internet of Things’ thing,” RFiD J., June 2009.
[2] H. Sundmaeker, P. Guillemin, P. Friess, and S. Woelffl, Vision and Challenges for Realising the Internet of Things, CERP IoT, March 2010.
[3] C. Cheng and D. Lee, “Smart sensors enable smart air conditioning control,” Sensors, vol.14, no.6, pp.11179–11203, June 2014.
[4] A. Elmoudi, O. Asad, M. Kantarci, and H. Mouftah, “Energy con- sumption control of an air conditioner using Web services,” Smart Grid and Renewable Energy, vol.2, no.3, pp.255–260, Feb. 2011.
[5] H. Grindvoll, O. Vermesan, T. Crosbie, R. Bahr, N. Dawood, and G. Revel, “A wireless sensor network for intelligent building en- ergy management based on multi communication standards - A case study,” J. Information Technology in Construction, pp.43–62, May 2012.
[6] A. Delgado, R. Picking, and V. Grout, “Remote-controlled home automation systems with different network technologies,” IEEE Em- bedded Computing, 2008.
[7] J. Yun and S. Lee, “Human movement detection and identification using pyroelectric infrared Sensors,” Sensors, vol.14, no.5, pp.8057–
8081, May 2014.
[8] J. Xiong, F. Li, and J. Zhang, “Human tracking system based on PIR sensor network and video,” Advanced Technologies in Ad Hoc and Sensor Networks, vol.295, pp.13–25, Jan. 2014.
[9] K. Saravana, P. Priscilla, J. Germiya, and G. Balagopal, “Human de- tection robot using PIR sensors,” IJSETR, vol.4, pp.492–496, March 2015.
[10] S. Qiao, Y. Wei, and Z. WenDong, “A new pyroelectric sensor sys- tem for target detection and recognition,” Applied Mathematics and Information Sciences, vol.9, pp.2621–2626, Sept. 2015.
[11] M. Kim and T. Oh, “Thermoelectric characteristics of the thermopile sensors with variations of the width and the thickness of the electrode- posited bismuth-telluride and antimony-telluride thin films,” Mater.
Trans., vol.51, no.10, pp.1909–1913, Sept. 2010.
[12] R. Wotiz, “Infrared thermal detectors,” Circuit Cellar, no.260, pp.54–
58, March 2012.
[13] H. Wu, A. Emadi, G. Graaf, and F. Wolffenbuttel, “Thin film en- capsulated 1D thermoelectric detector in an IR microspectrometer,”
Proc. SPIE, June 2010.
[14] M. Correa, G. Hermosilla, R. Verschae, and J. Ruiz-del-Solar, “Hu- man detection and identification by robots using thermal and visual information in domestic environments,” J. Intell. Robot. Syst., vol.66, no.1-2, pp.223–243, April 2012.
[15] F. Lee, F. Chen, and J. Liu, “Infrared thermal imaging system on a mobile phone,” Sensors, vol.15, no.5, pp.10166–10179, April 2015.
[16] P. Christiansen, K. Steen, R. Jorgensen, and H. Karstof, “Automated detection and recognition of wildlife using thermal cameras,” Sen- sors, vol.14, no.8, pp.13778–13793, July 2014.
[17] Y. Zhang, Y. Lu, H. Nagahara, and R. Taniguchi, “Anonymous cam- era for privacy protection,” 22nd International Conference on Pattern Recognition, Aug. 2014.
[18] C. Wu, Z. Yang, Z Zhou, X. Liu, and J. Cao, “Non-invasive detection of moving and stationary human with WiFi,” IEEE J. Sel. Areas Commun., vol.33, no.11, pp.2329–2342, Nov. 2015.
[19] K. Konno, M. Nango, N. Honma, K. Nishimori, N. Takemura, and T. Mitsui, “Experimental evaluation of estimating living-body direc- tion using array antenna for multipath environment,” IEEE Antennas Wireless Propag. Lett., vol.13, pp.718–721, April 2014.
[20] F. Dufaux and T. Ebrahimi, “Scrambling for video surveillance with privacy,” Proc. IEEE Computer Vision and Pattern Recogni- tion Workshop on Privacy Research in Vision, June 2006.
[21] X. Yu and N. Babaguchi, “Privacy preserving: Hiding a face in a face,” Proc. 8th Asian Conference on Computer Vision, pp.651–661, Nov. 2007.
[22] I. Mitsugami, M. Mukunoki, Y. Kawanishi, H. Hattori, and M. Mi-
[25] N. Dalal and B. Triggs, “Histograms of oriented gradients for hu- man detection,” IEEE Conference on Computer Vision and Pattern Recognition, pp.886–893, June 2005.
[26] G. Kitagawa, “Monte carlo filter and smoother for non-Gaussian nonlinear state space models,” J. Comput. Graph. Stat., vol.5, no.1, pp.1–25, March 1996.
[27] N. Gordon and D. Salmond, “Bayesian state estimation for tracking and guidance using the bootstrap filter,” J. Guidance, Control, and Dynamics, vol.18, no.6, pp.1434–1443, Nov. 1995.
[28] J. Carpenter, P. Clifford, and P. Fearnhead, “An improved particle fil- ter for non-linear problems,” IEE Proc. Radar Sonar Navig., vol.146, no.1, pp.2–7, Feb. 1999.
[29] M. Isard and A. Blake, “CONDENSATION-Conditional density propagation for visual tracking,” Int. J. Comput. Vision, vol.29, no.1, pp.5–28, Aug. 1998.
[30] M. Isard and A. Blake, “ICondensation: Unifying low-level and high- level tracking in a stochastic framework,” 5th European Conference Computer Vision, pp.893–908, June 1998.
[31] N. Ukita, T. Kitajima, and M. Kidode, “Estimating the positions and postures of non-rigid objects lacking sufficient features based on the stick and ellipse model,” Proc. IEEE Workshop on Articlated and Nonrigid Motion, in conjunction with CVPR2004, June 2004.
[32] P. Viola and M.J. Jones, “Robust real-time face detection,” Int. J.
Comput. Vision, vol.57, no.2, pp.137–154, May 2004.
[33] T. Kitajima, E. Murakami, S. Yoshimoto, Y. Kuroda, and O. Oshiro,
“Human detection using biological signals in camera images with privacy aware,” 16th International Conference on Intelligent Systems Design and Applications, Dec. 2016.
[34] T. Kitajima, E. Murakami, S. Yoshimoto, Y. Kuroda, and O. Oshiro,
“Privacy-aware face detection using biological signals in camera images,” Electron. Commun. Jpn., vol.101, no.6, pp.67–79, June 2018.
[35] M.Z. Poh, D.J. McDuff, and R.W. Picard, “Advancements in noncon- tact, multiparameter physiologicalmeasurements using a Webcam,”
IEEE Trans. Biomed. Eng., vol.58, no.1, pp.7–11, Jan. 2011.
[36] H.Y. Wu, M. Rubinstein, E. Shin, J. Guttag, F. Durand, and W.
Freeman, “Eulerian video magnification for revealing subtle changes in the world,” ACM Trans. Graph., vol.31, no.4, July 2012.
[37] G. Okada, T. Yonezawa, K. Kurita, and N. Tsumura, “Monitoring emotion by remote measurement of physiological signals using an RGB camera,” ITE Trans. MTA, vol.6, no.1, pp.131–137, 2018.
[38] T. Pursche and J. Krajewski, “Video-based heart rate measurement from human faces,” IEEE International Conference on Consumer Electronics, Jan. 2012.
[39] H. Rahman, M.U. Ahmed, S. Begum, and P. Funk, “Real time heart rate monitoring from facial RGB color video using Webcam,” The 29th Annual Workshop of the Swedish Artificial Intelligence Society, June 2016.
[40] T. Kitajima, S. Choi, and E. Murakami, “Non-contact Heart Rate Measurement based on camera image,” J. Information Assurance and Security, vol.10, no.3, pp.120–129, July 2015.
[41] T. Kitajima, S. Choi, E. Murakami, S. Yoshimoto, and O. Oshiro,
“Contactless measurement of heart rate using single channel camera images,” 12th International Conference on Ubiquitous Healthcare, Oct. 2015.
[42] Absorption spectrum of main substances in living tissue. [On- line]. Available: http://www.hamamatsu.com/jp/en/technology/
innovation/trs/index.html
https://www.theimagingsource.com/products/autofocus-cameras/usb -2.0-color/dfk72auc02f/
[48] K. Fukunaga, Introduction to Statistical Pattern Recognition, Aca- demic Press, Boston, 1990.
[49] Y. Cheng, “Mean shift, mode seeking, and clustering,” IEEE Trans.
Pattern Anal. Mach. Intell., vol.17, no.8, pp.790–799, Aug. 1995.
[50] G. Bradski, “Real time face and object tracking as a component of a perceptual user interface,” Applications of Computer Vision, Oct.
1998.
[51] Zephyr BioHarness 3 Wireless Professional Heart Rate Monitor.
[Online]. Available: https://www.zephyranywhere.com/
Toshihiro Kitajima received the M.E. de- gree from the Nara Institute of Science and Tech- nology, Nara, Japan in 2004, and the Ph.D.
degree in engineering from Osaka University, Osaka, Japan, in 2018. He joined the Fundamen- tal Technology Research Center, Honda R&D Co., Ltd., Japan in 2004. He was engaged in vision system development of humanoid robots and autonomous driving systems. He joined Samsung R&D Institute Japan in 2013. His re- search interests are in computer vision, human interaction, 3D image processing, and sensor application.
Edwardo Arata Yamamoto Murakami re- ceived the M.E. and Ph.D. degrees in computa- tional intelligence and systems science from the Tokyo Institute of Technology in 2000 and 2012, respectively. He worked at the Digital Human Research Center (AIST) on human control and sports biomechanics from 2005 to 2011. He has been working for Samsung R&D Institute Japan since 2011. His research interests are in human vital signs sensing, human motor control, and sensor fusion technology.
Shunsuke Yoshimoto received the Ph.D.
degree in engineering from Osaka University, Osaka, Japan, in 2012. Since 2012, he is an Assistant Professor of Graduate School of En- gineering Science at Osaka University. His re- search interests include haptic interaction tech- nologies and biomedical instrumentation.
Yoshihiro Kuroda received the Ph.D. degree in informatics from Kyoto University, Kyoto, Japan, in 2005. He was an Assistant Profes- sor of Graduate School of Engineering Science at Osaka University from 2006 to 2013 and he was an Associate Professor of Cybermedia Cen- ter at Osaka University from 2013 to 2016. From 2016, he is an Associate Professor of Graduate School of Engineering Science at Osaka Univer- sity. His research interests include haptic inter- action technologies and biomedical engineering.
Osamu Oshiro received the Ph.D. degree in engineering from Osaka University, Osaka, Japan, in 1990. He was a research engineer of Sumitomo Metal Industries from 1990 to 1993 and he was an Assistant/Associate Professor of Nara Institute of Science and Technology from 1993 to 2003. From 2003, he has been a Profes- sor of Graduate School of Engineering Science, Osaka University. His research interests focus PBR, facing technology, modeling of distributed human system, and so on.


![Fig. 17 Manual focus camera [47].](https://thumb-ap.123doks.com/thumbv2/123deta/10098539.1498832/7.892.493.790.345.801/fig-manual-focus-camera.webp)