Measurement of Soot Particle Size Distribution in a Laminar Diffusion Flame
Using Multiwavelength Polarization Ratio Method
Jun, 2020
Chief Examiner: Professor Tsuneaki ISHIMA Sub-Chief Examiner: Professor Tomohiko FURUHATA
Professor Kenji AMAGAI (Subadvisor) Associate Professor Yoshio ZAMA Professor Mikiya ARAKI (Supervisor)
Long Cheng
Division of Mechanical Science and Technology Graduate School of Science and Technology
Gunma University
Abstract
The major source of particulate matters in atmosphere is soot particles generated in fossil fuel flames. With the development of scientific research and diagnostic technology, the control of particulate matter in the flame has been attracting more attention. Developing soot particle diagnostic techniques is necessary for reduction of soot particle emission. In this study, a development soot particle measurement method which is multi-wavelength polarization ratio (MPR) method based on Mie scattering theory is introduced, improved and validated.
In Chapter 1, the background and progress of research is introduced. The various definitions of particle diameter, common particle size distribution and widely use soot particle size measurement methods are introduced. Characteristics and measurement ranges of several measurement methods are discussed.
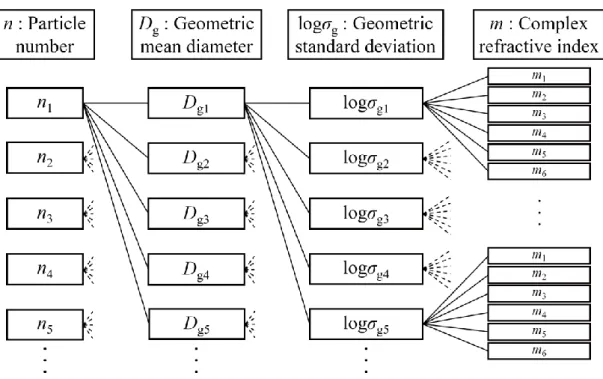
In Chapter 2, based on the Mie scattering theory, the multi-wavelength polarization ratio computation theory and the procedure for the estimation of the required parameters are also introduced. Previous study of MPR method, its limitations and development of present study are introduced. The measurement principles, experimental devices and experimental conditions are to be explained. The flame height is set at 30 mm in order to compare with other researchers’ data. The scattered light intensities were obtained by polarization charge coupled device (CCD) cameras set at a certain scattering angle. The determination process for known parameters which are particle number, geometric mean diameter, geometric mean standard deviation and complex refractive index are introduced in detail.
In Chapter 3, some famous and experienced methods such as light extinction method (LEM), portable aerosol mobility spectrometer (PAMS) and a transmission electron microscope (TEM) are used to validate the accuracy of MPR method. The measurement principles, experiment se-up and experimental conditions are introduced.
In Chapter 4, it is the results and discussion part. The geometric mean diameter Dg
and temperature distribution in the radial direction at z = 20 mm and z = 25 mm are introduced. The lower limit of measurement has been expanded to ten nm order through developing the calculation method. A comparison of the results for z = 20 mm and for z = 25 mm shows that the geometric mean diameter increases as moving downstream of the flame. Particle number distributions in the radial direction at z = 20 mm and z = 25 mm are introduced. A comparison of the results for z = 20 mm and for
z = 25 mm shows that the particle number decreases moving downstream of the flame.
The reason is considered to be the coagulation of soot particles and oxidation.
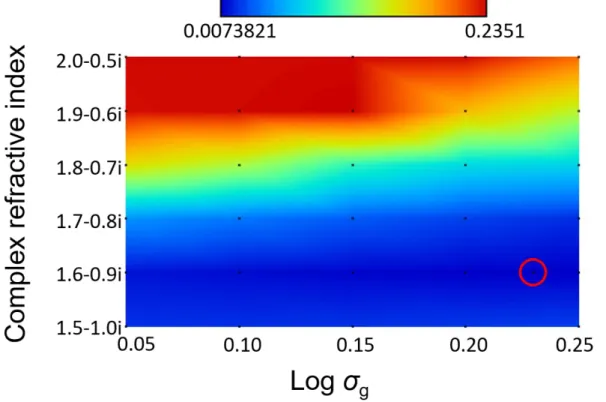
The measurement accuracy of the MPR method is discussed in detail. The soot volume fraction is calculated and compared with the data obtained using LEM. While the experimental results are consistent with previous researches, the discrepancy between these two methods increases with the downstream distance. The reason is considered to be value of fitting coefficient which is based on z = 20 mm data. The particle size distribution is compared with the result obtained by a PAMS. The data obtained from the MPR method is smaller as compared with PAMS. The reason considered is the effect of aggregations. Polystyrene standard particles of 46 nm and 269 nm in ultrapure water under five different number densities were used to validate the accuracy of the MPR method too. For both standard particles, the MPR method overestimates the diameter when compared with the TEM. This could be attributed to the leak of polarized light at polarizers on each pixel of CCD sensor.
In Chapter 5, the correction methods which are used to improve the accuracy of the measurement were introduced in details. Finally, the conclusions are presented in Chapter 6.
Keywords: Polarization, Mie scattering theory, Particle size distribution, Particle number, Refractive index, Soot volume fraction
CONTENTS
Nomenclature ... 6
Chapter 1 Introduction ... 9
1.1 Background ... 9
1.2 The purpose of research ... 12
1.3 The research process of polarization ratio method ... 13
1.4 A brief introduction to soot particle diameter ... 1
1.4.1 Geometrically equivalent diameter ... 1
1.4.2 Optical equivalent diameter ... 1
1.4.3 Electromigration diameter ... 2
1.4.4 Aerodynamic diameter ... 2
1.4.5 Application of particle diameters... 3
1.5 Particle size distribution ... 5
1.5.1 Normal distribution ... 5
1.5.2 Lognormal deviation distribution ... 5
1.5.3 Rosin-Rammler distribution ... 6
1.6 Soot particle measurement methods ... 6
1.6.1 Portable aerosol mobility spectrometer (PAMS) ... 8
1.6.2 Thermophoretic sampling particle diagnostics followed by electron microscopy analysis TSPD-TEM ... 9
1.6.3 Light diffraction (LD) method ... 10
1.6.4 Light extinction method (LEM) ... 11
1.6.5 Dynamic light scattering (DLS) method ... 11
1.6.6 Laser induced incandescence (LII) method ... 12
REFERENCES ... 15
Chapter 2 Measurement principle and experimental set-up ... 19
2.1 Measurement principle of the MPR method ... 19
2.1.1 Previous study-single wavelength polarization ratio method ... 20
2.1.2 Previous study - Multi-wavelength polarization ratio method based on polarization ratio ... 22
2.1.3 Present study - Multi-wavelength polarization ratio method based on scattered light intensities ... 24
2.1.4 Determination of unknown parameters ... 26
2.1.5 Determination of the optical constant ... 29
2.1.6 Calculation of the soot volume fraction in the radial direction ... 32
2.2 Experimental set-up of the multi-wavelength polarization ratio method ... 33
2.2.1 Butane burner system ... 33
2.2.2 Optical set-up ... 36
2.2.3 Temperature measurement ... 42
2.3 The experimental procedure ... 43
2.3.1 Scattered light images of soot particles ... 45
2.3.2 Function of fitting scattered light intensity ... 47
REFERENCES ... 49
Chapter 3 Principles and experimental set-ups of validation methods ... 50
3.1 Light extinction method for soot particle measurement ... 50
3.2 Portable Aerosol Mobility Spectrometer (PAMS) for soot particle measurement ... 52
3.3 Standard particles for validation ... 55
REFERENCES ... 57
Chapter 4 Soot particle size distribution and comparison results with validation methods ... 58
4.1 The geometric mean diameter and temperature distribution ... 58
4.2 Particle number distribution ... 61
4.3 Soot volume fraction distribution and comparison with LEM ... 62
4.4 Comparison of particle size distribution between PMR and PAMS 65 4.5 Comparison of mean particle size between MPR and TEM ... 68
REFERENCES ... 70
Chapter 5 Correction methods for improving measurement accuracy ... 71
5.1 Scattering angle correction ... 71
5.2 Correction by sensitivity curve ... 73
5.2.1 Experiments to obtain sensitive curve correction ... 73
5.2.2 Obtaining the intensity calibration curve ... 74
Chapter 6 Conclusions ... 79
Acknowledgments ... 80
Nomenclature
ε Sum of residuals τ Exposure time ρ Polarization ratio D Particle diameter C Optical constant n Particle number θ Scattering angle E Electric field intensity R Fuel nozzle radius
𝑒 Primitive charge (1.6E-19 C) α Particle size parameter m Complex refractive index λ Wavelength of the incident light z Flame height above the burner r Lateral measurement distance B Granular mechanical mobility 𝜇𝑔 Gas viscosity,
𝐷𝑓 Fractal dimension 𝑅𝑔 Turning radius
SVF Soot volume fraction
𝑛𝑒 Electrically charged particles number 𝐶𝑐 Slip correction coefficient
f(D) Function of lognormal distribution log σg Geometric standard deviation Dg Geometric mean diameter D10 Arithmetic mean diameter D10
LD Light diffraction method LEM Light extinction ratio method ELPI Electrical low pressure impactor TEM Transmission electron microscope
DLS Dynamic light scattering method PAMS Portable aerosol mobility spectrometer Qext Extinction coefficient of single particle Qabc Absorption coefficient of single particle Qs,agg Scattering cross section of aggregates 𝑄𝑠𝑐𝑎𝑡 Scattering cross section of single particle 𝑄𝑎,𝑎𝑔𝑔 Absorption cross section of aggregates 𝑄𝑎𝑏𝑠 Absorption cross section of single particle LII Laser induced incandescence method
MPR Multi-wavelength polarization ratio method TSPD Thermophoretic sampling particle diagnostics 𝑁𝑝 Particle numbers of constituent particle for aggregate
T The transmissivities of the two wavelength lights through the flame 𝑣𝑇𝐸 Velocity of charged particles relative to the current-carrying gas.
i1 Perpendicular component of scattered light intensity for single particle i2 Parallel component of scattered light intensity for single particle
I1,λ1 Perpendicular components of theoretical scattered light intensities having wavelength of λ1
I2, λ1 Parallel components of theoretical scattered light intensities having wavelength of λ1
I1, λ2 Perpendicular components of theoretical scattered light intensities having wavelength of λ2
I2, λ2 Parallel components of theoretical scattered light intensities having wavelength of λ2
IM1, λ1 Perpendicular components of measured scattered light intensities having wavelength of λ1
IM2, λ1 Parallel components of measured scattered light intensities having wavelength of λ1
IM1, λ2 Perpendicular components of measured scattered light intensities having wavelength of λ2
IM2, λ2 Parallel components of measured scattered light intensities having wavelength of λ2
𝜀𝐼1,𝜆1 Residual between measured value and theoretical value of
perpendicular components having wavelength of λ1
𝜀𝐼2,𝜆1 Residual between measured value and theoretical value of parallel components having wavelength of λ1
𝜀𝐼1,𝜆2 Residual between measured value and theoretical value of perpendicular components having wavelength of λ2
𝜀𝐼2,𝜆2 Residual between measured value and theoretical value of parallel components having wavelength of λ2
Chapter 1 Introduction
1.1 Background
Combustion converts the chemical energy contained in the fossil fuels into thermal energy [1]. Combustion of fossil fuels is the most important form of energy utilization in the present and supports the normal operation and development of human society [2]. However, fossil fuel combustion produces pollutant emissions such as carbon dioxide (CO2) Nitrogen oxides (NOx), sulfur oxides (SOx), carbon monoxide (CO), Polycyclic aromatic hydrocarbons (PAH) and particulate matter (PM), including soot particles [3-6].
Soot particles usually result from incomplete combustion. The particles with aerodynamic diameter lower than 10 µm are known as PM10. Soot particles emissed from the diesel engines can enter human body through nose and mouth. Likewise, the particles with aerodynamic diameter lower than 2.5 µm are known as PM 2.5, and they can enter the human lungs and the blood circulation system [4]. Soot particles show strong absorbability and are capable of carrying several toxic trace elements. Particles with diameters of 0.01 ~ 0.1 µm and primary particle aggregates can enter the alveoli [5-6]. Additionally, soot particles present in the atmosphere are long lasting, usually for around a month. The diffuse reflectivity of the soot particle surface makes the glacier capable of absorbing more sunlight, which could speed up its melting, as shown in Fig. 1.2 [7]. Moreover, soot particle optical properties contribute to the greenhouse effect [8].
Therefore, from the perspective of environmental protection and social development, the effective control of soot formation is essential. To understand the soot particle formation mechanism, information on the primary particles is necessary. Then, obtaining the information about particle size, particle size distribution and soot volume fraction is important to understand soot particle formation mechanism.
Figure 1.1 Soot particles are deposited in the alveoli [6].
Figure 1.2 Melting glaciers [7].
Several studies have been conducted on the mechanism of soot particle formation;
and its physical and chemical properties have been investigated [9-21]. Figure 1.3 shows the soot particles from the formation process of cyclic hydrocarbon to particle aggregates [16, 22].
Fuel pyrolysis results in the production of precursors for soot. At some point the PAH is large enough to develop into a nuclear soot particle [22]. Surface growth is the process of adding mass to the surface of a nucleated soot particle. Coagulation occurs when particles collide, thereby decreasing the particles number and holding the mass of soot particles constant. Agglomeration occurs when primary particles stick together [22].
Figure1.3 Soot formation process [16, 22].
Primary soot particle size appears to vary depending on the experimental conditions such as the flame type, temperature and concentration of oxygen. However, most primary particles sizes reported range from 10 to 30 nm in laminar diffusion flame [22].
To understand the soot particle formation mechanism is essential to reduce soot particle emission. Developing soot measurement techniques is important to understand soot formation and growth mechanism. Soot particle measurement technologies can be classified into intrusive measurement methods and non-intrusive methods.
By using of intrusive methods like portable aerosol mobility spectrometer (PAMS), transmission electron microscopy (TEM), thermophoretic sampling particles diagnostics (TSPD), it is possible to measure particle size on the order of tens nm.
Intrusive methods have several advantages and have been widely used until now.
However, sampling is necessary in the intrusive measurement. The sampling process can also affect the structure of the combustion field and soot particle formation.
For most of non-intrusive measurement methods, like light diffraction method (LD), light extinction method (LEM), the dynamic light scattering (DLS) method, laser- induced incandescence (LII) and other laser used methods, flame structure is not affected and in-situ measurement can be achieved. There are a lot of advantages like high accuracy and high resolution of space. However, it is difficult to determine the value of complex refractive index and cannot obtain the particle size distribution for these non-intrusive measurement methods.
As compared with intrusive measurement methods, the information of spatial distribution and time evolution can be obtained by using multi-wavelength polarization ratio (MPR) method. As compared with some famous non-intrusive measurement methods such as LII and LEM. MPR method can determine particle number, geometric mean diameter, determine standard deviation and complex refractive index.
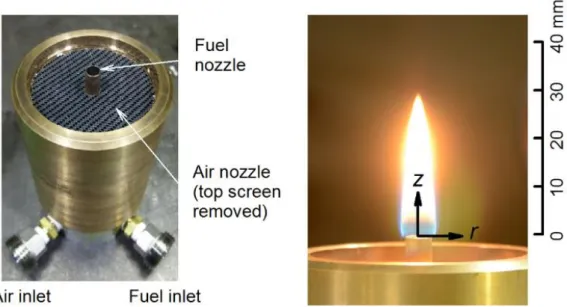
In the present study, a coflow laminar diffusion flame is used. It is very difficult to analyze the variation of soot particles in engine spray flame, due to the unstable high flow field and pressure variation. Therefore, the flame should have characteristics which are simple flame structure and easy to investigate soot particle formation, growth, oxidation and aggregation process. By using laminar diffusion flame, it is able to obtain time course of soot growth from primary soot particles to secondary soot particles and the measurement at each cross section of the flame can be produced.
Butane was selected as the fuel. According to butane is a simple hydrocarbon, it is also one of the most widely used fuels in hydrocarbon fuels.
1.2 The purpose of research
There are two proposes in the thesis. The first purpose is to make sure the smallest measurement limit. We want to knows to know how small soot particles can we measure by using MPR method. Can we measure the nuclide soot particles? That is the problem. MPR method can measure soot particles which are from 20 nm to some tens- nm order. However, it is difficult to measure soot particles which ranges around 10 nm order.
The second purpose is to make sure the largest measurement limit of MPR method.
By using MPR method, how large soot particles can we measure. Can we measure the aggregates? Is the aggregates affect on data measured by using MPR method? The author wants to ensure that.
1.3 The research process of polarization ratio method
Polarization ratio method is not a new method in soot particle measurement field.
Kunugi et al [23] used a photomultiplier tube to measure the intensities of scattered light from soot particles in diffusion flame of hydrocarbons in air. From a comparison of the measured ratio of the two light-scattering intensities for the perpendicular and parallel polarization components with the predictions from Mie's theory, the particle size and number density of soot particles were determined.
D’Alessio [24] summarized the results of polarization ratio measurements for smoke produced by a variety of fuel chemistries and burner types and found the results to be consistent with predictions based on Mie theory and based on Rayleigh theory both for a prolate spheroid and a linear chain agglomerate.
Nishida et al [25] examined the means for determining the particle size from the Mie scattered light theory, and measured the scattered light intensity ratio and the transmittance of the laser to determine the soot particle size and number density in a laminar diffusion flame. Measurements were made and presented in correspondence with measurements of temperature, soot weight concentration and various gas composition concentration distribution. Nevertheless, due the nature of the single wavelength of the laser source, the single wavelength polarization ratio method is incapable of distinguishing the width of the particle size distribution.
Dobbins et al. [26] modeled the agglomerate structure as a porous sphere and were able to obtain fair agreement between the measured and predicted polarization ratio at 90°. By measuring the polarization ratio, Presser et al [27] researched the effect of swirl on droplet transport processes, which is examined in a pressure-atomized, hollow-cone kerosene spray. Polarization ratio method provided spatially resolved measurements on the local values of droplet mean size and number density in dense regions of the nonburning spray. Iannone et al [28] has been developed a light scattered devise which is based on polarization ratio technique for the discrimination of coal and fly ash. The scattering angle is set at an angle in the forward direction (60°). The results reported showed the possibility to measure the carbon percentage within fly ash by exploiting the different scattering properties of the particles. Measurement result showed that it has been, indeed, demonstrated that there is a good correlation between the ratio of the scattered intensities and the carbon content. In particular, a clear
decrease of the polarization ratio is seen when the carbon percentage rises within the fly ash. In addition, the reproducibility of the proposed method is investigated and the carbon content can be measured with an uncertainty of about 1%.
However, single wavelength polarization ratio method [23-28] cannot distinguish the width of the particle size distribution due to the nature of the single wavelength of the laser source. In order to solve this problem, a new particle measurement method which can measure soot particles distribution and distinguish the width of particle size distribution has been proposed [29-32].
Araki et al [29] used three kinds of He-Ne lasers with wavelengths of 543.5, 594.1, and 632.8 nm to pass through the test particles in purified water. The scattered images were acquired with a digital CCD camera set in parallel and perpendicular directions to the polarization plane of the incident light. The measurement range of the particle size can be extended up to the order of 1 μm, and that the accuracy of the results lies between 0.1 % and 7.6 %, when compared with the results of a centrifugal sedimentation method.
However, the method proposed in [29] had two problems. The first one is the influence of finite collecting angles of the superimposing scattered lights, and in the preset study, the fourth wavelength is utilized to exclude the effect of the superposition.
The other problem is the effect of laser power stability, and by acquiring reference light intensity simultaneously, the effect of fluctuation of laser power is canceled. Inoue et al [30] used multi-wavelength polarization ratio to solve two problems of previous research [29]. Four different wavelength lasers whose wavelengths are 532.3, 543.5, 594.1 and 632.8 nm. The four wavelengths were utilized to exclude the effect of finite collecting angles of the superimposing scattered lights. By acquiring the reference light intensity simultaneously, the effect of the fluctuation of the laser power was canceled.
The measurement range in diameter was further extended up to 3 μm with an error of 7.6 % at maximum. Furthermore, the number density of particles was newly measured with a maximum error of 32%. How soot particles can absorb the light and the chemical structure of flame field is not clear. It is difficult to determine the value of the complex refractive index exactly. For most of optical measurement methods, including the single wavelength polarization ratio method, the complex refractive index was obtained from previous research. However, the values of complex refractive index are different under different experiment conditions; as it is the standard deviation.
Therefore, developing a method which can measure the soot particle size and determine the value of complex refractive index is necessary.
Compared with previous studies of multi-wavelength polarization ratio method [29- 30], Koizumi et al [31-32] improved the computational method of multiwavelength polarization ratio method. By using the scattered light intensities instead of polarization ratio as a function of geometric mean diameter. The geometric mean diameter, the geometric standard deviation, the particle number and the complex refractive index in a butane laminar coflow diffusion flame are determined simultaneously and the lower limit of measurement has been reduced to 1 nm order.
1.4 A brief introduction to soot particle diameter
Particle diameter is the most basic geometric characteristic of soot particles. Tapered particles are represented by their bottom diameter and height. Cubes are represented by their side lengths. However, in the actual measurement, most soot particles have irregular shapes. Therefore, it is difficult to describe their particle size accurately. The particle size of a spherical particle with a unit density can be expressed simply as a geometric diameter. The equivalent diameter is often used to represent the particle size for irregular particles [33-36]. There are several methods to define the particle diameter.
Each of method has its own application background and definition. In the following sub-section, detailed definitions of diameter according to the measurement principle are introduced for soot particle measurement.
1.4.1 Geometrically equivalent diameter
Regarding particle measurement, the geometrically equivalent diameter is frequently used to represent the particle diameter. It is a virtual value rather than a real diameter. The geometrically equivalent diameter can be equivalent to the projected area diameter, the equivalent surface diameter or the equivalent volume diameter [34-36].
As measuring instruments operate based on different principles, the geometrically equivalent diameters varies according with the measuring instrument.
For example, in the electron microscope measurement, the diameter of the particle is represented by the maximum width of particle projection. The soot particles are collected in a copper mesh and the two-dimensional image information of soot particles is obtained by the electron microscope. It is required to convert the projection area and the main projection parameters such as the length through empirical relationships into three-dimensional structure parameters of the real soot particles.
1.4.2 Optical equivalent diameter
Optical equivalent diameter is defined as the particle diameter of the standard particle with the same instrument detection response signal as the measured particle [35]. Optical instruments detect particles by their interaction with laser light. Optical equivalent diameter measurement is widely used in static light scattering method, laser
diffraction method, dynamic light scattering method, light extinction method, multi- wavelength polarization method and other optical measurement methods. In measurement methods that use laser, the existing commercial instruments usually rely on the standard particle methods to determine the optical equivalent diameter. However, these methods tend to be affected significantly by the morphology and complex refractive index of the measured particles. The measured value is converted to the particle size using a physical law, such as Mie theory, developed when assuming a specific particle shape, such as a sphere, and the specific physical conditions.
1.4.3 Electromigration diameter
The method of measuring the particle diameter distribution according to the electromobility of aerosol particles appeared in 1902 [37]. Until now, it has become an important mean to measure particle size. Electromobility is defined as the velocity of a particle with a charge of a unit element in a unit strength electric field.
𝑍𝑝 =𝑣𝑇𝐸
𝐸 = 𝑛𝑒𝑒𝐵 = 𝑛𝑒𝑒𝐶𝑐
3𝜋𝜇𝑔𝑑𝑚 (1-1) Here, 𝑣𝑇𝐸 is the velocity of charged particles relative to the current-carrying gas.
E is the electric field intensity, 𝑛𝑒 is electrically charged particles number, 𝑒 is the primitive charge (1.6E-19 C), 𝜇𝑔 is the gas viscosity, and 𝐶𝑐 is the slip correction coefficient. The parameter B is the granular mechanical mobility, which is with related to the size of the spherical particles in the air drag force. For spherical particles, B can be used to measure the relative ease of motion of the particles in the air flow. Therefore, the mobility of particle size 𝑑𝑚 can be determined according to B. For the non- spherical particles, 𝑑𝑚 is actually an equivalent diameter; in other words, a spherical particle with the diameter of 𝑑𝑚 and the measured non-spherical particles are subjected to the same drag force in the air flow. This diameter is widely used in the electric mobility method in devices such as SMPS, PAMS, SEMS [38].
1.4.4 Aerodynamic diameter
An electronic low-pressure impactor is usually employed to measure the aerodynamic particle size. The aerodynamic diameter is defined as the diameter of a sphere with standard density that settles at the same terminal velocity as the particle of interest [39]. The difference between the aerodynamic diameter and the
electromigration diameter is that although they both rely on charged particles measurement, the aerodynamic diameter is based on the principle of inertial deposition.
In other words, it is based on the relaxation time to differentiate particle diameters:
𝜏 = 𝑚𝐵 (1-2) In the equation, m represents the particle mass, while B refers to the mechanical mobility. The aerodynamic particle size of spherical particles with a density 𝜌0 of 1g/cm³ is expressed as follows:
𝜌0 = 𝑑𝑎2𝐶𝑐/18𝜇𝑔 (1-3) Spherical particles with this particle size have the same relaxation time as the measured particles. Nevertheless, electrostatic measurement is conducted only for obtaining the mass and quantity concentration of the particles.
1.4.5 Application of particle diameters
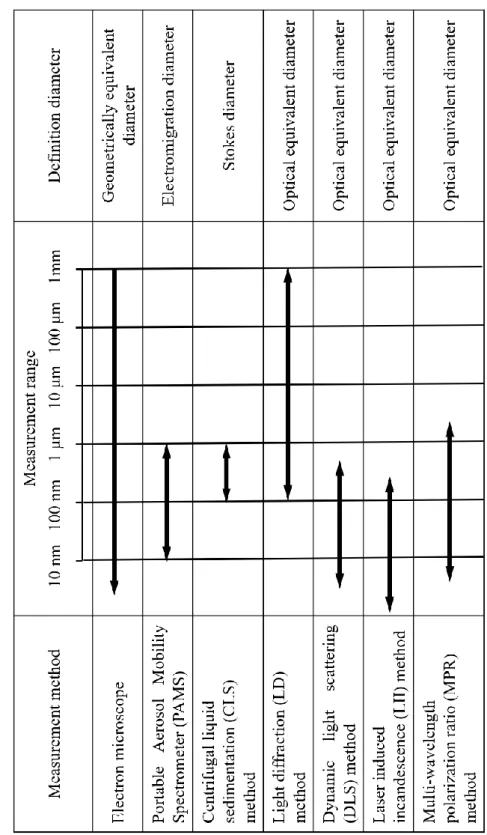
Table 1-1 summarizes the definitions of particle diameter and applications in several measurement methods. The principles of different methods will be introduced in the next part. The geometrically equivalent diameters are usually used in optical microscopes, electron microscopes, image analysis method and so on. The optical equivalent diameter is widely used in static light scattering method, laser diffraction method, dynamic light scattering method, light extinction method, multi-wavelength polarization method and other optical measurement methods. Electromigration diameter is widely used in the electric mobility method in devices such as SMPS, PAMS, SEMS. Aerodynamic diameter is used in electrical low-pressure impactor (ELPI). Stokes diameter is widely used in the sedimentation methods.
Table 1-1 Diameter according to different measurement methods.
1.5 Particle size distribution
Soot particles are distributed in groups in a discrete way. Nevertheless, there are a large number of particles that can be treated as continuous. The size distribution of polydisperse grain system consisting of particles of different size shows the form of a distribution with a single peak or multiple peaks.
In the actual measurement methods, the particle size is not completely consistent with a certain distribution function. In some cases, it is not clear in advance which distribution function it approximately conforms to. Therefore, in order to determine which distribution function is most appropriate for the measured particle system, the sum of the squares of the measured and calculated values is frequently used. Currently, most distribution functions of two-parameter type are adopted, one of which is the characteristic size parameter to represent the particle size, and the other is the distribution parameter to represent the particle size distribution of the particle group.
The commonly used particle size distribution functions are introduced below.
1.5.1 Normal distribution
The normal distribution, also known as Gaussian distribution, is expressed as follows [40]:
𝑓(𝐷) = 1
√2𝜋·𝜎𝑒𝑥𝑝 [−1
2(𝐷−𝐷̅
𝜎 )2] (1-4) Where, 𝐷 is the diameter of soot particle, 𝐷̅ represents the mean diameters of soot particles. The parameter σ refers to distribution parameter, it is the width of distribution.
As the standard normal distribution function is a symmetric function, the smaller the distribution parameter σ is, the narrower the distribution is. When σ <0.2, the particle swarm can be viewed as a monodisperse particle system.
1.5.2 Lognormal deviation distribution
The distribution of actual particles is barely symmetrical. Therefore, the normal distribution is not so common in practice. The logarithmic normal distribution function is more commonly used. The lognormal distribution function is derived by taking the logarithm of all the parameters in the normal distribution function, with the form shown
below [40]:
𝑓(𝐷) = 1
√2𝜋𝜎𝑔𝐷𝑒𝑥𝑝 [−1
2(𝑙𝑜𝑔10𝐷−𝑙𝑜𝑔10𝐷𝑔
𝑙𝑜𝑔10𝜎𝑔 )
2] (1-5) The probability distribution function, f(D), where σg indicates the geometric standard deviation and Dg denotes the geometric mean diameter.
1.5.3 Rosin-Rammler distribution
Known as the R-R distribution function [40], the Rosin-Rammler distribution function was first proposed by Rosin and Rammler in 1963 after a study on the particle size of pulverized coal. It is a particular case of Webster's probability distribution. Most coal mine dust is suitable for this distribution, expressed by the following equation:
𝑉(𝐷) = 1 − 𝑒𝑥𝑝[−(𝐷/𝐷̅)𝑘] (1-6) Where D represents particle diameter and V indicates the cumulative volume percentage of particles with diameter less than D in the particle swarm. D is referred to as the characteristic size parameter, indicating that the volume of particles less than this size accounts for 63.21% of the total volume of particles. The size of D value generally indicates the size of the entire particle system. k refers to the particle group size distribution parameter, which is dimensionless and indicates the dispersion degree of particle size. The smaller k is, the wider the dispersion degree is. Conversely, the larger k is, the more likely the particles are to be monodispersed.
1.6 Soot particle measurement methods
There are a lot of hypotheses about the reaction paths of the various stages in the formation of soot particles. However, there is no unified soot particle generation mechanism; and it is still needed to use different methods and techniques of soot particles generated test simulation and diagnosis. The detection of soot particles plays an important role in the exploration and verification of the physicochemical reaction mechanism during soot generation. Many methods for soot particle sizing have been proposed [41-56]. Currently, soot particles detection methods can be divided into two categories: intrusive and non-intrusive methods as shown in figure 1.4 [41].
In intrusive measurement methods, the measurement device makes direct contact with the particles, for example, the portable aerosol mobility spectrometer (PAMS)
method [42-43] involves a sampling measurement instrument for soot particles and usually supplemented by a dilution method. Soot particles have frequently been collected by sampling methods for subsequent observation and analysis with the assistance of electron microscope. Thermophoretic sampling particles diagnostics (TSPD) is one of the most commonly used sampling methods [44]; while the collected soot particles are usually examined by scanning electron microscope (SEM) [45] or transmission electron microscopy (TEM) [44]. Thermocouple particle densitometry (TPD) [46] is applied to measure flame temperature and soot volume fraction at the same time. Nevertheless, it is a challenge for intrusive measurements to achieve high temporal and spatial resolutions [41]. Moreover, they will cause disruption to the measured flame. Therefore, the non-intrusive optical method is most widely used for soot measurement [41].
Optical measurement techniques are divided into two categories [31]. One kind of measurement techniques are based on lasers which mainly includes light diffraction method (LD) [47], light extinction method (LEM) [48-50], the dynamic light scattering (DLS) method [51], laser-induced incandescence (LII) [52-53], multi-wavelength polarization ratio method [29-32] and other laser used methods.
Another kind of measurement technique is based on the flame emission spectrum. It directly detects integral values of soot emission and then calculates temperature and soot volume fraction from the flame emission spectrum. A typical emission technique is two-color method [56]. The principles of these soot measurement techniques will be described in the following sub-sections.
Figure 1.4 Soot particle measurement technologies [41].
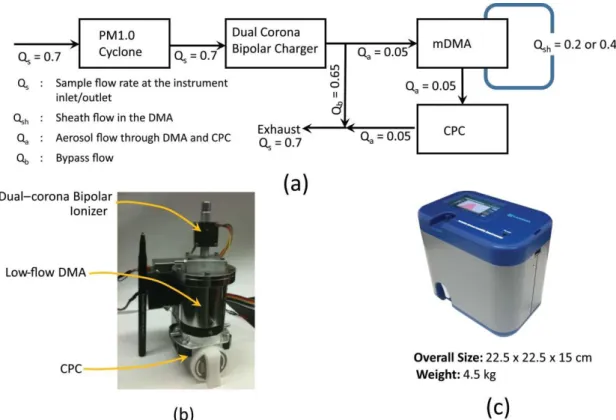
1.6.1 Portable aerosol mobility spectrometer (PAMS)
The layout of the various components of the prototype instrument and the flow scheme is shown in Figure 1.5 [43]. The key components include a miniature dual- corona bipolar charger, a differential mobility electrical classifier, and a condensation particle counter [42]. A bipolar charger is used for establishing a known equilibrium charge distribution. After being charged, the particles are transferred into a differential mobility analyzer (DMA), where they are categorized on the basis of their electrical mobility. With different voltages applied, different electrical mobilities are obtained in a DMA. A condensation particle counter (CPC) is used to count the mobility-classified particles downstream of the DMA [42-43].
PAMS method is applied to obtain each soot particle size and particle number. PAMS merits are high system integration, high industrialization degree and easily portable.
Nevertheless, the main drawback is the dilution of collected sample. It is ineffective in restoring real morphology of particles within the flame, which is a challenge to all dilution sampling method. There are no effective technological or theoretical measures to address this issue. The PAMS measurement range goes from 10 to 1μm order [43].
Figure 1.5 (a) Flow scheme and layout of different components of PAMS; (b) assembly of charger, DMA, and CPC units; (c) prototype PAMS instrument. Flow rates shown are in L/min
[43].
1.6.2 Thermophoretic sampling particle diagnostics followed by electron microscopy analysis TSPD-TEM
Figure 1.6 shows the soot particles and aggregates obtained from a flame using a thermophoretic sampling particle diagnostics (TSPD) [44]. The sample is observed using a transmission electron microscope (TEM), and the morphology and size of the soot particles are analyzed [44].
The TSPD-TEM method [44] is capable of obtaining the morphology, aggregation and particle size regardless of the position and time in the flame. The direct and instantaneous sampling enables researchers to observe instantaneously the morphology of soot particles and aggregates. Besides, the particle morphology will be maintained in the flame throughout the process of sampling and the. Similar to the laser induced incandescence method, TSPD-TEM is applied in the calibration of non-intrusive methods that only provide relative soot volume fractions [44]. However, this method is limited to a single point measurement; and therefore, it cannot be used to obtain spatially and temporally resolved results for unstable flames. By using TSPD-TEM, the lower limit of measurement can reach 0.1~ 0.2 nm [56].
Figure 1.6 TEM image of soot particles [44].
The gradients in temperature and velocity impose restrictions on the accuracy of TSPD, limiting the accuracy for the calculation of the Nusselt number.
1.6.3 Light diffraction (LD) method
The laser diffraction method [47] is used to analyze light diffraction phenomena in a parallel laser beam in a particle dispersion liquid. The diffraction pattern can be observed on the focal plane of the lens when the light diffracted by the particles dispersed in the liquid is condensed by the lens. The smaller the particle size, the larger the diffraction angle of light, and vice versa. Therefore, the light intensity distribution on the focal plane of the lens is mixed with diffracted light from particles of various sizes.
The particle size distribution and average particle size are calculated using Fraunhofer's diffraction theory from the diffracted light intensity distribution by taking
advantage of the fact that the change in the diffraction pattern concerning the angle decreases as the particle size decreases. Based on the Mie scattering theory, the scattered light also exhibits the scattering intensity pattern at each angle according to the particle size. Therefore, the light intensity pattern is observed as a mixed pattern of diffracted light and scattered light of particles. Besides, the average particle size and the particle size distribution can be obtained simultaneously by analyzing the angle- dependent light intensity pattern. Moreover, this method is the most widely used and most developed type of the various scattering particle measuring methods [56]. The upper limit of the light diffraction method can reach up to 3 mm, and the lower limit of measurement is 0.01 μm [56]. Thus, the diffraction method can measure only large particles and has limitations to measure particles with a mean diameter of less than 1 μm.
1.6.4 Light extinction method (LEM)
Rather than the scattered light intensity signal, the attenuation of the transmitted light intensity relative to the incident light intensity is the foundation for the development of the light extinction method (LEM) [48-50]. Not only can the technique measure the particle size, it can also measure the soot volume fraction.
The principle is that the scattering and absorption of the particles causes the intensity of the beam to be attenuated when the beam passes through a medium which is containing particles. The extent of attenuation is associated with the size and concentration of particles, thus providing a scale for particle measurement. Distinct from other methods of light scattering, the full scattering method measures the transmitted light instead of the scattered light of particles.
The principle is simple, the measurement is convenient and quick, the requirements for instrumental equipment are low, the data collection and processing process is simple. Its measurement range is relatively wide, with a lower limit of tens of nanometers and an upper limit of about 10 μm [48-50].
1.6.5 Dynamic light scattering (DLS) method
The application of DLS to flames has been reviewed briefly by Lamprecht in 1999 [51]. Rayleigh scattering occurs when the particles are much smaller than the incident wavelength. If the light source is a laser, the phenomenon which scattered light
intensities fluctuates with time can be obtained in a certain direction. This is because particles in the liquid or flame are follow the Brownian motion. The particle velocity of Brownian motion is related to particle size (Stokes - Einstein equation). Large particles move slowly and small particles move fast. If large particles are measured, the intensity of the scattered light will fluctuate slowly as they move slowly. Similarly, if the small particles will be measured, the intensity of the scattered light will fluctuate rapidly because they are moving fast. The particle size and its distribution can be calculated by the fluctuation of light intensity and the correlation function of light intensity.
The dynamic light scattering (DLS) method [51] has been applied for ultrafine particle measurement in various applications. As its measurements are based on the Brownian motion of particles, it is capable of measuring ultrafine particles as small as a few nanometers. The measurement range of DLS method is from 1 nm to 1 μm order [56].
The measurement results are highly accurate for monodisperse and narrow distribution grain systems. For wide distribution and multi-peak distribution grain systems, however, the measurement results are not as accurate. DLS measurements show high sensitivity to temperature and solvent viscosity. Therefore, it is necessary to keep the temperature constant and determine solvent viscosity for obtaining reliable results of DLS experiment. DLS is also restricted to transparent sample preparation.
1.6.6 Laser induced incandescence (LII) method
With regard to the measurements of soot volume fraction, laser-induced incandescence has been accepted as a primary technique [52-55]. LII method is considered most effective in measuring soot volume fraction for conducting internal combustion research. It is aimed at determining the two-dimensional (2-D) distributions of soot volume fraction and primary particle size.
According to the principle of LII method, soot particles are subject to heating through the absorption of laser radiation by raising the temperature to approximately 4000 K. The temperature radiation achieved in this process is known as LII signal.
After laser heating, the primary-particle sizes or primary particle size distributions with pulsed LII are determined on the basis of the particle-cooling rate, which contributes to a primary-particle-size dependent decay rate of the LII signal, as
measured by means of time-resolved detection (TiRe-LII).
This technique demonstrates its capability of spatial and temporal soot measurements; and therefore, it is applicable to practical combustion systems.
However, the cost of the equipment is relatively high. In addition, a theoretical model is required for particle sizing. Analysis of the data shows that for a stable measurement target, without flickering, a measurement error of less than 20 ppb can be achieved, resulting in a measurement range of tens of ppbs for soot volume fraction measurement [55]. Lower limit of measurement of LII method can reach 0.1 nm order [53].
Common particle size measurement methods were summarized. The evaluations of each measurement method are summarized in table1-2 [41-56].
Table 1-2 Particle size measurement method
REFERENCES
1. Law, C. K., Combustion physics, Cambridge university press, 2010.
2. Cai, W., Kaminski, C. F., Tomographic absorption spectroscopy for the study of gas dynamics and reactive flows, Process in Energy and Combustion Science 59: 1-31 (2017).
3. Zhang, Q., Thomson, M. J., Guo, H., Liu, F., Smallwood, G. J., A numerical study of soot aggregate formation in a laminar coflow diffusion flame, Combustion and Flame 156 (3): 697- 705 (2009).
4. Colbeck, I., Appleby, L., Hardman, E. J., and Harrison, R. M., The optical properties and morphology of cloud-processed carbonaceous smoke, Journal of Aerosol Science 21: 527-538 (1990).
5. Koshland, C.P., Impacts and control of air toxics from combustion, Symposium (International) on Combustion 26 (2): 2049-2065 (1996).
6. Joseph, C., Mizuo, K., Aerosol mixing state matters for particles deposition in human respiratory system, Scientific Reports 8 (1):1-11 (2018).
7. Li, Y., Kang, S. C., Chen, Z. Z., Hu, Z. F., Wang, K., Paudyal, R., Liu, J. S., Wang, X. X., Qin, X., Sillanpääc, M., Black carbon in a glacier and snow cover on the northeastern Tibetan Plateau: Concentrations, radiative forcing and potential source from local topsoil, Science of The Total Environment 686: 1030-1038 (2019).
8. Bergstrom, R. W., Russell, P. B., and Hignett, P., On the wavelength dependence of the absorption of black carbon particles: Predictions and results from the TARFOX experiment and implications for the single scattering albedo, Journal of Atmospheric Science 59 (3): 567- 577 (2002).
9. Roberts, V. J., Hayhurst, A. N., Knight, D. E., and Taylor, S. G., The origin of soot in flames:
Is the nucleus an ion? Combustion and Flame 120: 578-584 (2000).
10. Hayashida, K., Amagai, K., Satoh, K., Arai, M., Experimental analysis of soot formation in sooting diffusion flame by using laser-induced emissions, Journal of Engineering for Gas Turbines and Power 128(2): 241-246 (2006).
11. Richter, H., Granata, S., Green, W.H. and Howard, J.B., Proceedings of the Combustion Institute 30: 1397-1405 (2005).
12. Wang, H., Proceedings of the Combustion Institute 33: 41-67 (2011).
13. Saffaripour, M., Zabeti, P., Dworkin, S.B., Zhang, Q., Guo, H., Liu, F., Smallwood, G.J. and Thomson, M.J., Proceedings of the Combustion Institute 33: 601-608 (2011).
14. Öktem, B., Tolocka, M.P., Zhao, B., Wang, H., Chemical species associated with the early stage of soot growth in a laminar premixed ethylene–oxygen–argon flame, Combustion and Flame 142: 364–373 (2005).
15. Maricq, M.M., Physical and chemical comparison of soot in hydrocarbon and biodiesel fuel
diffusion flames: A study of model and commercial fuels, Combustion and Flame 158:105–
116 (2011).
16. Kobayashi, Y., Furuhata, T., Amagai, K., Arai, M., Soot precursor measurements in benzene and hexane diffusion flames, Combustion and Flame 154: 346–355 (2008).
17. Tree, D, R., Svensson, K. I., Soot processes in compression ignition engines, Progress in Energy and Combustion Science 33: 272–309 (2007).
18. Sako, T., Furuhata, T., Amagi, K., Arai. M., Study on nano-PM formed from laminar diffusion flame of diesel fuel, Transactions of the Japan Society of Mechanical Engineers Series B 72 (724): 3121-3127 (2006).
19. Smooke, M.D., Long, M.B., Connelly, B.C., Colket, M.B., Hall, R.J., Soot formation in laminar diffusion flames, Combustion and Flame 143: 613–628 (2005).
20. Zhang, T.F., Zhao, L.Y., Thomson, M.J., Effects of n-propylbenzene addition to n-dodecane on soot formation and aggregate structure in a laminar coflow diffusion flame, Proceedings of the Combustion Institute 36: 1339–1347 (2017).
21. Akihama, K., Yui, H., Namai, Y., Iwata, K., Imamura, O., Ishii, K. and Hashimoto, J., Transactions of Society of Automotive Engineers of Japan 49 (6): 1132-1137 (2018).
22. Donnet, J.B., Bansal, R.C., Wang, M.J., Carbon black / Second edition, Revised and expanded, Marcel Dekker, Inc. New York (1993).
23. Kunugi, M., Jinno, H., Determination of size and concentration of particles in diffusion flames by a light-scattering technique, Symposium (International) on Combustion 11(1): 257-266 (1967).
24. D’Alessio, A., Particulate Carbon Formation During Combustion (D. C. Siegla and G. W.
Smith, Eds.) Plenum Press, New York, 1981, p. 207.
25. Nishida, O. and Mukohara, S., The optical measurement of soot particles in diffusion laminar flame, Transactions of the Japan Society of Mechanical Engineers Series B 49 (441): 1068- 1077 (1983).
26. Dobbins, R. A., Santoro, R. J., and Semerjian, H. G., Analysis of light scattering from soot using optical cross sections for aggregates, Symposium (International) on Combustion, 23(1):
1525-1532(1991).
27. Presser, C., Gupta, A.K., Semerjian, H.G., Aerodynamic Characteristics of Swirling Spray Flames: Pressure-Jet Atomizer, Combustion and Flame 92:25-44 (1993).
28. Iannone, R.Q., Morlacchi, R., Calabria, R., Massoli, P., Investigation of unburned carbon particles in fly ash by means of laser light scattering, Appl Phys B 102: 357–365 (2011).
29. Araki, M., Ebata, A., Inoue, T. and Shiga, S., Sub micron particle size measurements using Multi wavelength polarized lights, Transactions of the Japan Society of Mechanical Engineers Series B ,76 (770): 1620-1628 (2010).
30. Inoue, T., Miura, N., Araki, M. and Shiga, S., Particle size measurements using multi- wavelength linear polarized lasers in sub-micrometer range, Atomization: journal of the
ILASS-Japan 20 (70): 43-50 (2011).
31. Koizumi, Y., Cheng, L., Kiribayashi, S., ODA, S. and Araki, M., Soot Particle Size Measurement in a Butane Laminar Diffusion Flame, Proceedings of the 56th Symp. (Japanese) on Combust. E 331 (2018).
32. Cheng, L., Koizumi, Y., Kiribayashi, S., ODA, S. and Araki, M., Soot volume fraction measurement in a pool flame using transmissive light extinction method, Proceedings of the 56th Symp. (Japanese) on Combust. E134 (2018).
33. Cai, X. S., Su, M. X., Shen, J. Q., Particle size measurement technology and application, Chemical Industry Press, Chapter 1: (2010).
34. Arkawa, M., Introduction to particle size measurement, Journal of the Society of Powder Technology of Japan 17(6): 299-307(1980).
35. Zhang, Q. X., Scattering matrices of fire smoke: measurement, modeling and inversion for particle size distribution and refractive index, Ph.D. Thesis, University of Science and Technology of China, (2011).
36. Sakashita, S., "Basics of powder technology" for color engineers Chapter 1 Physical properties of powder, J. JPn. Soc. ColourMater. 78(4): 168-184 (2005).
37. Baron, Paul A; Willeke, Klaus. Aerosol measurement: principles, techniques, and applications.
2nd ed. Nov 01, (2001).
38. Sakura, H., Particle size distribution II: General theory of electrical mobility analyzer method, Earozoru Kenkyu 32 (3), 199-207(2017).
39. DeCarlo, P. F., Slowik, J. G., Worsnop, D. R., Davidovits, P., Jimenez, J. J., Particle morphology and density characterization by combined mobility and aerodynamic diameter measurements. Part 1: Theory, Aerosol Science and Technology, 38: 1185-1205 (2004).
40. ILASS-Japan, Atomization Technology 2: 39 (2001).
41. Lou, C., Chen, C., Sun, Y. P., Review of soot measurement in hydrocarbon-air flames, Science China Tech. Sci 53(8): 2129-2140 (2010).
42. Brouwer, D. H. et al., Handbook of Nanosafety, Chapter 5: 173-206 (2014).
43. Kulkarni, P., Qi, C.L. and Fukushima, N., Development of portable aerosol mobility spectrometer for personal and mobile aerosol measurement, Aerosol Science and Technology 50 (11): 1167-1179 (2016).
44. Pandey, P., Pundir, B. P., Panigrahi, P. K., Hydrogen addition to acetylene–air laminar diffusion flames: Studies on soot formation under different flow arrangements, Combustion and Flame 148: 249–262 (2007).
45. Fruhstorfer, P., and Niessner, R., Identification and classification of airborne soot particles using an automated SEM/EDX, Mikrochim.Acta 113: 239-250 (1994).
46. McEnally, C. S, Köylü, Ü. Ö. et al., Soot volume fraction and temperature measurements in laminar non-premixed flames using thermocouples, Combustion and Flame 109: 701-720 (1997).
47. Umemoto, S., Kajitani, S., Hara, S. and Kawase, M., Fuel 167: 280-287 (2016).
48. Choi, M.Y., Mulholland, G.W., Hamins, A. and Kashiwagi, T., Comparisons of soot volume fraction using gravimetric and light extinction techniques, Combustion and Flame 102 :161- 169 (1995).
49. Zhao, H. and Ladommatos, N., Optical diagnostics for soot and temperature measurement in diesel engine, Progress in Energy and Combustion Science 24 (3): 221-255 (1998).
50. Wand, L., Sun, X. G., Xing, J., Determination of particle size distribution by light extinction method using improved pattern search algorithm with Tikhonov smoothing functional, Journal of Modern Optics 59 (21): 1829-184 (2012).
51. Lamprecht, A., Eimer, W. and Katharina, K.-H., Dynamic light scattering in sooting premixed atmospheric-pressure methane–, propane–, ethene–, and propene–oxygen flames, Combustion and Flame 118:140-150 (1999).
52. Bladh, H., Olofsson, N.-E., Mouton, T., Simonsson, J., Mercier, X., Faccinetto, A., Bengtsson, P.-E. and Desgroux, P., Probing the smallest soot particles in low-sooting premixed flames using laser-induced incandescence, Proceedings of the Combustion Institute 35: 1843-1850 (2015).
53. Zhang, Y.D., Liu, F., Clavel, D., Smallwood, G.J., Lou, C., Measurement of soot volume fraction and primary particle diameter in oxygen enriched ethylene diffusion flames using the laser-induced incandescence technique, Energy 177: 421-432 (2019).
54. Patiñoa, F., Cruza, J. J., Verdugoa, I., Moránb, J., Consalvic, j. l., Liud, F., Due, X., Fuentesa, A., Soot primary particle sizing in a n-heptane doped methane/air laminar coflow diffusion flame by planar two-color TiRe-LII and TEM image analysis, Fuel 266: 11703(2020).
55. Li, D., Thermal image analysis using calibrated video, Ph.D. Thesis, University of Missouri- Columbia (2006).
56. Kato, H., A survey on nano sized distribution particle standards, AIST Bulletin of Metrology 6(4): 185-20(2007).
Chapter 2 Measurement principle and experimental set-up
2.1 Measurement principle of the MPR method
MPR method is based on Mie scattering theory. The Mie scattering theory [1] was developed on the basis of the electromagnetic scattering theory proposed by Mie in 1908. It is the premise of various light scattering theories commonly applied in the measurement of particle concentration and particle size distribution. Maxwell’s equations enable the interaction between the light and matter to be expressed mathematically. The solution of these equations requires information about the geometry of the inhomogeneous particle and its electric, magnetic properties and optical properties with respect to its surroundings. For homogeneous spheres, for example, it is necessary to determine particle diameter, complex index of refraction and the wavelength of the incident light. Once these equations are solved, it can be established how a specific particle absorbs and scatters the incident electromagnetic wave on it. The reverse of this idea is workable as well. That is to say, particle physical and optical properties can be determined from an inverse analysis using this relation like the Maxwell equations if the exact relation for the interaction between light and particle is known.
In case that the particles are significantly smaller than the wavelength of the light incident on them, the Mie scattering theory is further simplified to the Rayleigh approximation. Due to its relative simplicity and availability, the Mie scattering theory has been commonly applied to characterize particles in different physical systems;
even though the particles are not homogeneous spheres. It can be expected that this mathematical simplification leads to physically inaccurate predictions. In various applications, this error may be small, insignificant or comparable with the signal-to- noise ratio of the detection system.
However, there are some circumstances where more precise monitoring is required for particle properties. Apart from gaseous components, the solid particles such as soot particles and fly ash particles also exist in the combustion field. Therefore, the Mie scattering theory can also be applied to the study of optical and radiation characteristics
exhibited by such materials. The solution process of Mie scattering theory is highly complex. Rather than elaborating here, only the most relevant conclusions regarding the Mie scattering theory will be presented.
2.1.1 Previous study-single wavelength polarization ratio method
Figure 2.1 shows the light scattering of a single particle for an incident light of random polarization. The observation plane is shaped by the incident light axis and the observer, the camera in this case. The scattered light involves component i1 and component i2. The component i1 is perpendicular to the observation plane, while the component i2 is parallel to the observation plane and can be expressed by the following equation.
𝑖1 ∝ 𝜏𝜆𝐶𝜆𝑓𝑖1(𝐷, 𝑚, 𝜆, 𝜃) (2-1)
𝑖2 ∝ 𝜏𝜆𝐶𝜆𝑓𝑖2(𝐷, 𝑚, 𝜆, 𝜃) (2-2) Herein, the parameter 𝜏 refers to the exposure time of the polarization CCD cameras, the parameter Cλ denotes the optical constant which the factor is depending on the particle number concentration and on the instrument constant, D represents the particle diameter, 𝑚 is the complex refractive index, 𝜆 is the wavelength of incident light and 𝜃 means the scattering angle.
Figure 2.1 Light scattering from a single particle for incident light of random polarization.
The polarization ratio is defined as component i1 divided by component i2 which can be expressed by the following equation.
𝜌 =
𝑖2𝑖1
=
𝜏𝜆𝐶𝜆𝑓𝑖1,λ(𝐷,𝑚,𝜆,𝜃)𝜏𝜆𝐶𝜆𝑓𝑖2,λ(𝐷,𝑚,𝜆,𝜃) (2-3) In Eq.2-3, 𝑖1 and 𝑖2
can be measured, the parameters of 𝜏𝜆 , 𝐶𝜆 , 𝑚, 𝜆 and 𝜃 are known values. Therefore, the particle diameter can be obtained.
The intensity functions depend upon both the complex refractive index m and the size parameter α. The value of m could be obtained from calculation. The size parameter α is calculated using the following formula.
𝛼 =
𝜋𝐷𝜆 (2-4)
In real particle size measurement, the measurement target is particle group. When the above theory is applied to a particle group having a particle size distribution, the scattered light intensities of each component are expressed by the following equations.
𝐼1 = ∑ 𝑖1 = 𝜏𝐶𝑁𝑓𝐼1(𝐷𝑔, 𝜎𝑔, 𝑚, 𝜆, 𝜃) (2-5)
𝐼2 = ∑ 𝑖2 = 𝜏𝐶𝑁𝑓𝐼2(𝐷𝑔, 𝜎𝑔, 𝑚, 𝜆, 𝜃) (2-6) Herein, N is the particle number. The polarization ratio which is in particle group is shown as flows.
𝜌 =
𝐼2𝐼1
=
𝜏𝐶𝑁 𝑓𝐼2(𝐷𝑔,𝜎𝑔,𝑚,𝜆,𝜃)𝜏𝐶𝑁 𝑓𝐼1(𝐷𝑔,𝜎𝑔,𝑚,𝜆,𝜃) (2-7) With regard to the probability distribution function, f(D), it is found that particle size distribution conforms to a lognormal distribution, which is expressed as [2]:
𝑓(𝐷) = 1
√2𝜋𝜎𝑔𝐷𝑒𝑥𝑝 [−1
2(𝑙𝑜𝑔10𝐷−𝑙𝑜𝑔10𝐷𝑔
𝑙𝑜𝑔10𝜎𝑔 )
2
] (2-8) Where σg indicates the geometric standard deviation and Dg denotes the geometric mean diameter.
Figure 2-2 shows the relationship between the polarization ratio and the geometric mean diameter in the single polarization ratio method. In the figure 2-2, the parallel axis is the geometric mean diameter of soot particles, vertical axis is the polarization ratio. It can be found that polarization ratio is as a function of geometric mean diameter.
Herein, the solid curves are the theoretical polarization ratios which can be calculated based on Mie scattering theory when the complex index of soot particles is m = 1.9- 0.63i and the scattering angle is θ = 60o. The dotted straight line is the measured
![Figure 1.2 Melting glaciers [7].](https://thumb-ap.123doks.com/thumbv2/123deta/6233112.1091756/11.888.135.756.763.1104/figure-melting-glaciers.webp)