FACT-FINDING IN EAST KALIMANTAN RAILWAY FOR COAL TRANSPORT IN INDONESIA
Study Report
December 2004
Engineering and Consulting Firms Association, Japan
Nippon Koei Co., Ltd.
Table of Contents
1. BACKGROUND AND OBJECTIVE ... 1
1.1 Background ... 1
1.2 Objective... 1
2. COAL IN THE WORLD... 2
2.1 Coal Consumption ... 2
2.2 Coal Trade... 3
2.3 Coal Reserves ... 5
3. COAL OPERATIONS IN INDONESIA... 7
3.1 Coal Reserve ... 7
3.2 Coal Mining and Production ... 7
3.3 Domestic Demand... 8
3.4 Export... 9
4. COAL STRATEGY OF INDONESIA ... 11
4.1 Coal Policy... 11
5. COAL MININGS IN KALIMANTAN ... 12
5.1 Coal Concessions in Kalimantan ... 12
5.2 Coal Production and Its Transportation ... 15
5.3 Coal Flow... 19
5.4 Past Discussions on Coal Transport in Kalimantan ... 19
6. COAL TRANSPORTATION ... 20
6.1 Present State of Coal Transportation in Kalimantan ... 20
6.2 Coal Terminal... 21
6.3 Transportation of Coal from Mine to Coal Terminal ... 22
7. PRELIMINARY PROJECT JUSTIFICATION AND BUSINESS SCHEME ... 36
7.1 Preliminary Economic Evaluation of PPP Based Program ... 36
7.1.1 General... 36
7.1.2 Economic Cost... 36
7.1.3 Economic Benefit ... 38
7.1.4 Economic Evaluation... 41
7.2 Likely organization and Business Scheme... 42
7.2.1 General... 42
7.2.2 Likely Organization ... 42
7.2.3 Likely Financing Scheme ... 43
7.3 Preliminary Financial Evaluation... 46
7.3.1 General... 46
7.3.2 Financial Cost ... 46
7.3.3 Financial Benefit... 46
7.3.4 Financial Evaluation ... 46
7.3.5 Proposed Tariff Structure ... i
8. CONCLUSION AND NEXT STUDY... II 8.1 Conclusion ...ii
8.2 Next Step and Implementation Shedule...iii
FACT-FINDING IN EAST KALIMANTAN RAILWAY FOR COAL TRANSPORT IN INDONESIA
1. BACKGROUND AND OBJECTIVE
1.1
1.2
•
•
•
BACKGROUND
The total coal reserves in Indonesia are estimated as 38.9 billion tons and 54% of it (21 billion tons) is located in Kalimantan. Of these 21 billion tons, 6.6 billion tons are measured reserves, and 2.5 billion tons are mineable reserves.
Indonesia dramatically increases its coal production in last two decades; 0.34 million tones in 1980, 27.84 million tones in 1983 and 114.28 million tones in 2003. This dramatic change in coal production mainly comes from the introduction of Coal Contract of Work with Production Sharing Scheme in 1981, that is to say the introduction of foreign capital to Indonesian coal world. Indonesia exported the 74%
of nationwide produced coal (85.68 million tons) in 2003, and of these 21.0% (17.99 million tons) exported to Japan. As regards to the Kalimantan coal, the 78% of produced coal was exported in 2003.
In Kalimantan, the 1st generation contractor’s coal mining sites locate near the coastline and they transport their products from mining site to port with track, conveyer belt or barge. The 2nd and 3rd generation contractor’s mining sites locate far from coastline so that there is a difficulty in developing their mines especially in transportation of their products. It is mandatory for developing the inland coal mines to establish the efficient and cheap transportation system, using railway system. In the course of inland coal transport development, not only the railway system but also port facility development as the coal terminal is indispensable.
OBJECTIVE
The objectives of the study are as follows;
Study on the coal mine development plan and coal transport demand in Kalimantan.
Study on the potential of railway coal transport system with the private investments.
Implementation planning for the next action.
2. COAL IN THE WORLD
2.1 COAL CONSUMPTION
The world coal consumption has varied for decades. Although its value in 2001 was 27% greater than that in 1980, it was 1% less than the recorded maximum in 1989 at 5.31 billion short tons, as seen in Figure 2.1. According to the International Energy Outlook 2004 (IEO, Energy Information
Administration, Office of Integrated Analysis and Forecasting, U.S. Department of Energy), the prospects of the coal industries are brilliant in the world, especially as the energy source in electricity generation.
The world coal consumption is estimated to increase from 5.3 billion short tons in 2001 to 7.5 billion short tons in 2025, by the average annual rate of 1.5% with considerable variation among regions.
0 2 4 6 8 10
1980 1985 1990 1995 2000 2005 2010 2015 2020 2025 Year
Billion Short Tons
High Economic Growth Reference Case Low Economic Growth
History Projections
Source: International Energy Outlook 2004, April 2004, Energy Information Administration, Office of Integrated Analysis and Forecasting, U.S. Department of Energy, Washington, DC 20585
Figure 2.1 World Coal Consumption, 1970-2025
Coal use is expected to increase in the most of regions in the world. Exceptions are Western Europe, Eastern Europe, and the former Soviet Union outside Russia. In these exceptional countries, coal consumption remarkably declined in 1990s, primarily due to displacement with alternative energy sources like natural gas.
It is expected that large increase of coal consumption in energy use projected for the developing Asian countries will raise the world coal consumption in the future. In developing Asia, like China and India, coal will continue to dominate many fuel markets. Because of very large countries in terms of both population and landmass, the expected increases in coal use in the developing Asia from 2001 to 2025 account for 76% of the total expected increase in coal use worldwide on a Btu1 basis. The coal consumption in the developing Asia is estimated to increase from 2.1 billion short tons in 2001 to 3.8 billion short tons, more than 83% of increase.
The developing Asian countries consumed 40% of the world’s coal in 2001. The developing Asia is projected by IEO to share the coal consumption over one half of the world’s total by 2025.
The large increase of the coal consumption expected for the developing Asia will result from the strong economic growth in the region. In fact, the GDP growth is estimated to be 5.1% p.a. for the developing Asia between 2001 and 2025. China and India are the dominant driving forces behind the coal
consumption increase in the developing Asia. The increased demand of coal in the region will be particularly by the industrial and electricity sectors. According to the IEO, investment is necessary for the developing Asia’s mines, transportation, industrial facilities, and power plants.
When excluding China and India from the developing Asia, however, the coal consumption rise is projected considerably small over the forecast period up to 2025. This expectation comes from the projected growths in coal-fired electricity generation in South Korea, Taiwan, Indonesia and other ASEAN member countries, like Malaysia, the Philippines, Thailand, and Vietnam. According to the IEO, coal’s share of fuel consumption for electricity generation in the region will decrease from 33% in 2001 to 27% in 2025.
The suppressive motivation against the dramatic increase in coal use in the non-China and non-India developing Asia is diversity of energy sources for electricity generation, primarily to natural gas. This motivation exists even in countries that have abundant reserves of natural gas, such as Indonesia, Thailand, Malaysia, and the Philippines.
Despite the energy source diversity, increase of coal use in the region will not be fully suppressive.
There exist a lot of plans to increase power generation capacity in coal-fired plants for 2002 and later in the non-China and non-India developing Asia. Respective capacity additions including new power stations are reportedly, 12.3 GW for South Korea, 10.6 GW for Taiwan, 6.6 GW for Malaysia, 3.8 GW for Indonesia, and several GW in Thailand and the Philippines.
It should be noted that because of environmental concerns there are arguments against the addition of coal-fired capacity in Southeast Asia, particularly for countries such as Thailand and the Philippines. A number of individuals and NGOs protest that electricity generation by natural gas be a wiser choice than constructing new coal-fired power plants.
COAL TRADE
2.2
The international coal trade is relatively small compared with the world consumption. In 2001, world imports of coal counted 656 million tons, only 13% of the total consumption at 4.8 billion tons. IEO projects that coal imports worldwide will increase to total 919 million tons in 2025, accounting for a 12%
share of the world coal consumption.
In recent years, international coal trade has been characterized by strong growth in imports in Asia and moderate growth in Western Europe. Rising production costs in the indigenous coal industries of Western Europe have brought enormous declines of coal production within their countries and significant increases of coal imports. In Asia, strong growth in coal demand in Japan, South Korea, and Taiwan in recent years has contributed to a substantial rise in the region’s coal trade.
0 50 100 150 200 250 300 350
Australia United States South Africa Former Soviet Union Poland Canada China Indonesiae
Million Short Tons
2002 2010 2025
Source: International Energy Outlook 2004 (Table 13), April 2004, Energy Information Administration, Office of Integrated Analysis and Forecasting, U.S. Department of Energy, Washington, DC 20585
Figure 2.2 Coal Exports by Major Exporter Countries
After 2002, the international coal markets have experienced dramatic changes in price. Although the international coal price was fairly stable in 2002, it has been dramatically raised in 2003.
Ocean freight for coal transport rose in 2003. The freight rise was mainly attributable to a substantial increase in imports of iron ore by Chinese steel producers. The present freight rates for major coal export routes are more than triple the rates in 2002.
Some coal exporting countries, such as China, Indonesia, and South Africa recently have gotten into the coal export business, have increased their export amount substantially over the past few years. Between 1998 and 2001, coal exports from China expanded remarkably by 178%, from 36 million tons to 100 million tons. Although its coal exports slipped down to 92 million tons during 2002, China maintained its position as the second leading coal exporter in the world, ahead of Indonesia and South Africa.
Japan will remain as the world’s leading importer of coal. Its import share is estimated to be 22% in the world in 2025, slightly less than 26% of share in recorded in 2002. In 2002, Japan produced
approximately 1 million tons of coal for domestic consumption and imported 172 million tons. Despite a less dominant role than before, coal demand in Japan will continue to exert considerable influence in the coal price especially in the Asian coal market.
$US/ton
BJI: FOB coal price in New Castle Port
Japan Long-term Contract: Long-term contract for export to Japan from New Castle Port Source: Coal 2003, Barlow Jonker
Figure 2.3 Prices of Export Coal in New Castle Port
2.3 COAL RESERVES
According to Energy Information Administration, USA, total recoverable reserves of coal in the world are 1,083 billion tons — enough to last approximately 210 years at current consumption levels.
Although coal deposits are broadly distributed, 60% of the world’s recoverable reserves are located in three countries; the United States (25%), Russia (23%), and China (12%). Indonesia shares only 0.55%
of the world reserves.
Quality of coal deposits is also important for coal reserves. Its quality varies significantly from one region to another.
Despite 18% of share in the world coal production, low-Btu lignite or “brown coal is not traded in the world markets. Quality of lignite varies; 4.55 million Btu per ton to 12.25 million Btu per ton in terms of the average heat content.
0 50 100 150 200 250 300 United States
Russia China India Australia Germany South Africa Ukraine Kazakhstan Poland Yugoslavia Indonesia Others
Billion Short Tons
Recoverable Anthracite and Bituminous
Recoverable Lignite and Subbituminous
Source: Energy Information Administration, International Energy Annual 2002 Figure 2.4 World Recoverable Coal Reserve
3. COAL OPERATIONS IN INDONESIA
3.1 COAL RESERVE
The coal resources in Indonesia exist in Sumatra, Kalimantan, Sulawesi, Papua and Java. According to the Directorate of Coal, MEMR, the total reserve is 38.92 billion tons of which the proved recoverable reserve is 5.4 billion tons, the proved amount in place is 11.6 billion tons, and the estimated additional amount in place is 27.3 billion tons. The coal quality is relatively low and its distribution corresponds to 58% for lignite, 27% for sub-bituminous, and 14% for bituminous. The water content is rather high at 20% to 40%. Caloric value is not very high and the majority is less than 5,000 kcal/kg.
Table 3.1 Coal Reserve in Indonesia Area
Proved Recoverable
Reserve
Proved Amount in Place
Estimated Additional Amount in Place
Total Reserve
Sumatra 2,825 4,258 9,015 13,273
Java 0 1 5 6
Kalimantan 2,505 6,640 14,573 21,213
Others 38 670 3,713 4,383
Total 5,368 11,569 27,306 38,875
3.2 COAL MINING AND PRODUCTION
At present, the most of coal mining in Indonesia is of open-pit. The mining sites are generally located near the seacoasts or big rivers, looking for easier transportation of coal.
Indonesian coal is being produced by four main groups, namely, State Owned Corporation (BUMN), mining contractors (PKP2B), mining concessionaires (KP holders), and mining cooperatives (KUD).
Today, there are 33 coal companies at production stage; 2 mines of BUMN, 19 mines of PKP2B, 10 mines of mining concessionaires (KP holders), and 2 mines of KUD.
Since 1990s, one BUMN and ten PKP2Bs started coal production. They are producing most of the Indonesian coal and called the first generation coal miners.
There are 15 second generation coal miners. Five of which have started the production, four are under development and the remaining six are still conducting feasibility study or exploration.
There are 76 PKP2B categorized in the third generation. Eight of them have started the production, two are in their development stage, 14 are still under feasibility study, and the remaining 52 are in exploration.
Total of mining concessionaires (KP holders) count 554 including KUDs. Where, 194 mining
concessionaires are in production, 63 are under studies, 260 are in exploration, and 37 are in preliminary research.
Figure 3.1 shows the coal production in Indonesia by groups from 1993 to 2003. The total production
2003. In 2003, First generation of PKP2B produced 83.9 million tones and 73.4% of total production.
BUMN and Second generation of PKP2B follow it as 10.0 million tones and 9.0 million tones
respectively. Kalimantan (East and South) dominates some 90% of total coal production in Indonesia, because nine of ten First generation locate at Kalimantan. In Sumatra, there are the last First generation and the entire state owned corporation. Figure 3.2 shows the coal production by province in 2003.
0 20,000 40,000 60,000 80,000 100,000 120,000
('000 tones)
1993 1994 1995 1996 1997 1998 1999 2000 2001 2002 2003
KUD KP Holder State Owned Generation 3 Generation 2 Generation 1
Source: Directorate of Mineral and Coal Enterprises, Indonesia Mineral and Coal Statistics 2004 Figure 3.1 Coal production in Indonesia by groups
Bengkulu:0.3%
W. Sumatra:0.1%
8.8%
40.4%
50.5%
West Sumatra South Sumatra Bengkulu South Kalimantan East Kalimantan
Source: Directorate of Mineral and Coal Enterprises, Indonesia Mineral and Coal Statistics 2004 Figure 3.2 Coal productions in Indonesia by province in 2003
3.3 DOMESTIC DEMAND
The main coal demand in the country is of 1) electric power generation, 2) cement industry, 3) other large scale industries (metallurgical, textile, pulp), and 4) small industries (briquette, lime stone incineration).
Figure 3.3 shows the domestic coal use by user in 2002 and 2003. The total domestic consumption was 29.25 million tons in 2002 and 30.66 million tons in 2003. The dominant domestic consumption is
The coal demand on the electric power generation is expected to grow rapidly. The contribution against fuel demand in national electricity sector increased from 10% at the end of 1980’s to 24% and 34.8% in 1995 and 2002. This is related with the condition that cost of coal generated electricity is the cheapest.
0.0 5.0 10.0 15.0 20.0 25.0 30.0 35.0
Domestic Coal Consumption
2002 2003
Others Briquette Pulp Industry Metallurgy Cement Industry Coal-Fired Power Plant (Million tons)
Notes: “Others” means could also include coal sold and distributed by coal traders.
Source: Directorate of Mineral and Coal Enterprises, Indonesia Mineral and Coal Statistics 2004 Figure 3.3 Indonesian domestic coal consumption
3.4 EXPORT
In 1990, China decreased its coal export due to the domestic demand increase, while Indonesia has become the third biggest coal exporter, followed by Australia and South Africa. In fact, the coal export from Indonesia was growing from 4.3 million tons in 1990 to 85.7 million tons in 2003. The main destination of the coal export is the Asia-Pacific countries such as Japan, ASEAN, South Korea, Taiwan and Hong Kong. Figure 3.4 shows the coal export destination in 2003.
3% 4%
19%
7% 8% 10%
15%
14% 20%
Japan Taiwan Hongkong South Korea India
Others in Asia Europe
Australia-America Others
Total export in 2003: 85.68 million ton
Source: Directorate of Mineral and Coal Enterprises, Indonesia Mineral and Coal Statistics 2004 Figure 3.4 Coal export by destination country in 2003
4. COAL STRATEGY OF INDONESIA
4.1 COAL POLICY
As broadly known, Indonesia is producing a lot of coal. In 2003 Indonesia is ranked the third in coal export and ninth in coal production in the world. However, the country’s coal reserve is not very huge when compared with other major coal reserving countries, like Russia, China, Australia, etc. Indonesia has 5.9 billion tons of the recoverable reserve, which shares only 0.55% of the global reserve and ranks 16th in the world.
The coal business plays an important role in Indonesia, both as the domestic energy resource and as the export commodity. Despite the satisfactory exploitation in the past, positive and definite efforts will be required to sustain and maximize the benefits from the coal business.
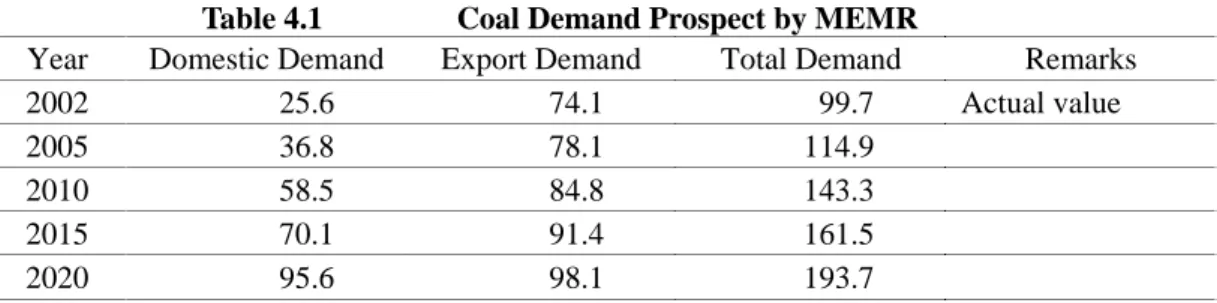
On 23 June 2004, the Ministry of Energy and Mineral Resources (MEMR) of the Republic of Indonesia issued the Ministerial Decree No. 1128K/40/MEM/2004 regarding the National Coal Policy (NCP). In the decree, MEMR assumes a couple of future coal demands, that is, the domestic demand and export demand.
Table 4.1 Coal Demand Prospect by MEMR
Year Domestic Demand Export Demand Total Demand Remarks
2002 25.6 74.1 99.7 Actual value
2005 36.8 78.1 114.9
2010 58.5 84.8 143.3
2015 70.1 91.4 161.5
2020 95.6 98.1 193.7
Source: Attachment 1A, NPC, for Domestic Demand
Attachment 3A, NPC, for Export Demand, which is equal to 17% of the world trade in 2002.
5. COAL MININGS IN KALIMANTAN
5.1 COAL CONCESSIONS IN KALIMANTAN
After the first oil crisis in 1973, Indonesia decided to expand the share of coal in mixed energy to get rid of oil-depended situation. In 1981, Indonesia introduced coal concession system named Coal Contract of Work. Since then, Indonesian coal production has dramatically increased from 0.34 million tones in 1981 to 114. 28 million tones in 2003.
Mining contractors can be classified into three generations by its contract era.
The first generation is consisted of 11 contractors. They contracted with PTBA between 1981 and 1990.
Nine of them are foreign capitals and one of them has already finished its activity. Eight of acting ten first generation contractor is in Kalimantan. There are six acting first generation contractor in East Kalimantan and others are in South Kalimantan.
In 1993, 17 contractors called second generation made contract with PTBA. They are all Indonesian domestic company. Five of them recorded the production in 2003 and two are in construction stage.
On the other hand, two second generation has terminated their activity and one is in terminated process.
There are 12 acting second generation mining contractors in Kalimantan.
Between 1997 and 1999, 110 third generation made Coal Contract of Work with Directorate of Coal.
But forty of them have terminated or in terminate process and five are suspending their activity. Only four third generation contractors recorded the production in 2003. In Kalimantan, there are 51 acting third generation contractors.
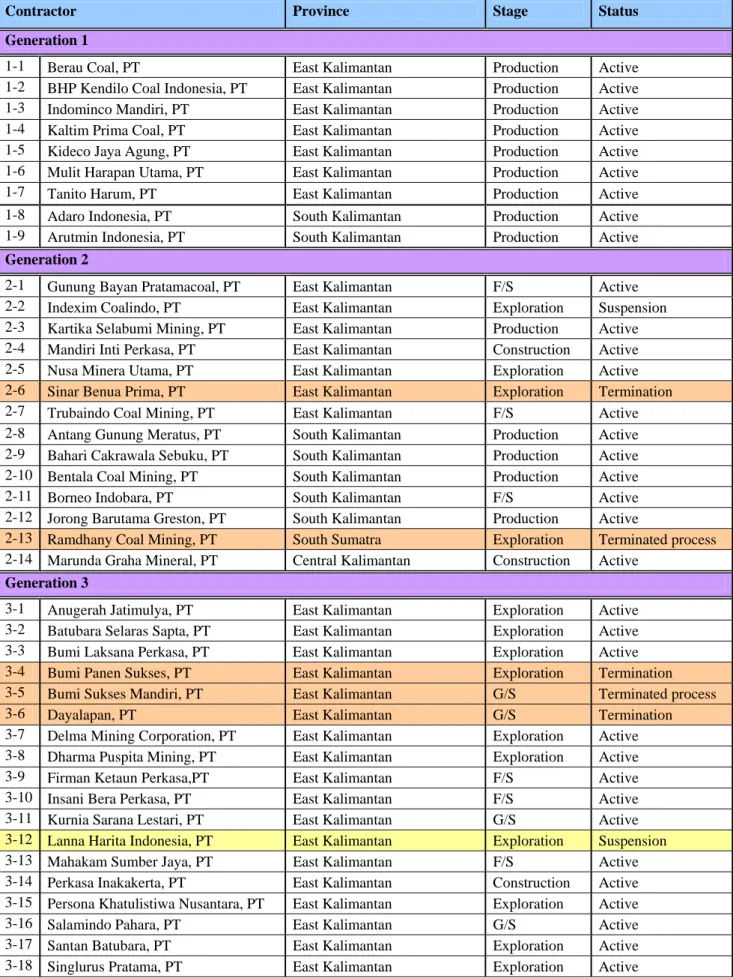
Table 5.1 shows the status of coal mining contractors in Kalimantan.
Table 5.1 Coal Mining Contractors in Kalimantan
Contractor Province Stage Status
Generation 1
1-1 Berau Coal, PT East Kalimantan Production Active 1-2 BHP Kendilo Coal Indonesia, PT East Kalimantan Production Active 1-3 Indominco Mandiri, PT East Kalimantan Production Active 1-4 Kaltim Prima Coal, PT East Kalimantan Production Active 1-5 Kideco Jaya Agung, PT East Kalimantan Production Active 1-6 Mulit Harapan Utama, PT East Kalimantan Production Active 1-7 Tanito Harum, PT East Kalimantan Production Active 1-8 Adaro Indonesia, PT South Kalimantan Production Active 1-9 Arutmin Indonesia, PT South Kalimantan Production Active Generation 2
2-1 Gunung Bayan Pratamacoal, PT East Kalimantan F/S Active 2-2 Indexim Coalindo, PT East Kalimantan Exploration Suspension 2-3 Kartika Selabumi Mining, PT East Kalimantan Production Active 2-4 Mandiri Inti Perkasa, PT East Kalimantan Construction Active 2-5 Nusa Minera Utama, PT East Kalimantan Exploration Active 2-6 Sinar Benua Prima, PT East Kalimantan Exploration Termination 2-7 Trubaindo Coal Mining, PT East Kalimantan F/S Active 2-8 Antang Gunung Meratus, PT South Kalimantan Production Active 2-9 Bahari Cakrawala Sebuku, PT South Kalimantan Production Active 2-10 Bentala Coal Mining, PT South Kalimantan Production Active 2-11 Borneo Indobara, PT South Kalimantan F/S Active 2-12 Jorong Barutama Greston, PT South Kalimantan Production Active
2-13 Ramdhany Coal Mining, PT South Sumatra Exploration Terminated process 2-14 Marunda Graha Mineral, PT Central Kalimantan Construction Active
Generation 3
3-1 Anugerah Jatimulya, PT East Kalimantan Exploration Active 3-2 Batubara Selaras Sapta, PT East Kalimantan Exploration Active 3-3 Bumi Laksana Perkasa, PT East Kalimantan Exploration Active 3-4 Bumi Panen Sukses, PT East Kalimantan Exploration Termination 3-5 Bumi Sukses Mandiri, PT East Kalimantan G/S Terminated process
3-6 Dayalapan, PT East Kalimantan G/S Termination
3-7 Delma Mining Corporation, PT East Kalimantan Exploration Active 3-8 Dharma Puspita Mining, PT East Kalimantan Exploration Active 3-9 Firman Ketaun Perkasa,PT East Kalimantan F/S Active 3-10 Insani Bera Perkasa, PT East Kalimantan F/S Active 3-11 Kurnia Sarana Lestari, PT East Kalimantan G/S Active 3-12 Lanna Harita Indonesia, PT East Kalimantan Exploration Suspension 3-13 Mahakam Sumber Jaya, PT East Kalimantan F/S Active 3-14 Perkasa Inakakerta, PT East Kalimantan Construction Active
Contractor Province Stage Status Generation 3
3-19 Salamindo Coalindo, PT East Kalimantan G/S Active 3-20 Tambang Damai, PT East Kalimantan F/S Active 3-21 Taraco Mining, PT East Kalimantan Exploration Termination 3-22 Teguh Sinar Abadi, PT East Kalimantan F/S Active 3-23 Tempayang Cemerlang, PT East Kalimantan Exploration Active 3-24 Timah Batubara Utama, PT East Kalimantan Exploration Active 3-25 Wadungmas Tambang Mulia, PT East Kalimantan G/S Termination 3-26 Wirakaneo Coalindo, PT East Kalimantan G/S Termination 3-27 Whiratama Bina Perkasa, PT East Kalimantan G/S Termination 3-28 Bangun Benua Persada, PT South Kalimantan F/S Active 3-29 Bara Pramulya Abadi, PT South Kalimantan Production Active 3-30 Baramarta, PD South Kalimantan Production Active 3-31 Baramulti Sukesessarana, PT South Kalimantan Production Active 3-32 Ekasatya Yanatama, PT South Kalimantan Exploration Active 3-33 Generalindo Prima Coal, PT South Kalimantan Exploration Active 3-34 Interex Sacra Raya, PT South & East Kalimantan F/S Active 3-35 Kadya Caraka Mulia, PT South Kalimantan Exploration Active 3-36 Kalimantan Energi Lestari, PT South Kalimantan Production Active 3-37 Lianganggang Cemerlang, PT South Kalimantan F/S Active 3-38 Mantimin Coal Mining, PT South Kalimantan Construction Active 3-39 Senamas Energindo Mulya, PT South Kalimantan Exploration Active 3-40 Sinarindo Barakarya, PT South Kalimantan G/S Termination 3-41 Sumber Kurnia Buana, PT South Kalimantan Production Active 3-42 Tanjung Alam Jaya, PT South Kalimantan Exploration Active 3-43 Torah Antareja Mining, PT South & Central Kalimantan G/S Termination 3-44 Wahana Baratama Mining, PT South Kalimantan F/S Active 3-45 Asmin Bara Bronang, PT Central Kalimantan Exploration Active 3-46 Asmin Bara Jaan, PT Central Kalimantan Exploration Active 3-47 Asmin Coalindo Tuhup, PT Central Kalimantan Exploration Active 3-48 Batubara Duaribu Abadi, PT Central Kalimantan F/S Active 3-49 Bharinto Ekatama, PT Central&East Kalimantan F/S Active 3-50 Buntok Perdana Coal Mining, PT Central & South Kalimantan Exploration Termination 3-51 Dhamar Tejokencono, PT Central & East Kalimantan G/S Termination 3-52 Juloi Coal, PT Central Kalimantan Exploration Active 3-53 Kalteng Coal, PT Central Kalimantan Exploration Active 3-54 Lahai Coal, PT Central & East Kalimantan Exploration Active 3-55 Maruwai Coal, PT Central & East Kalimantan Exploration Suspension 3-56 Multi Tambang Jaya Utama, PT Central Kalimantan Exploration Active 3-57 Pari Coal, PT Central & East Kalimantan Exploration Suspension 3-58 Ratah Coal, PT Central & East Kalimantan G/S Suspension 3-59 Sumber Barito Coal, PT Central Kalimantan Exploration Active 3-60 Suprabari Mapanindo Mineral, PT Central Kalimantan Exploration Active 3-61 Yamabhumi Palaka, PT West Kalimantan F/S Active
Source: Directorate of Mineral and Coal Enterprises, Indonesia Mineral and Coal Statistics 2004
COAL PRODUCTION AND ITS TRANSPORTATION
5.2
In 2003, 103.81 million tones coal or 90.8% of Indonesian national production were produced in Kalimantan. Of these 103.81 million tones, 83.89 million tones or 80.8% were produced by 1st generation contractors. Figure 5.1 shows the transition of coal production in Kalimantan by mining groups from 1993 to 2003.
0 20,000 40,000 60,000 80,000 100,000 120,000 ('000 ton)
1993 1994 1995 1996 1997 1998 1999 2000 2001 2002 2003
KUD KP Holder Generation 3 Generation 2 Generation 1
Source: Directorate of Mineral and Coal Enterprises, Indonesia Mineral and Coal Statistics 2004 Figure 5.1 Coal production in Kalimantan by mining groups
In Kalimantan, track, barge and conveyor belt are used to transport coal from mining site to river, coal terminal and coal freighter. Most of working coal mine locates near the coastline or large river for easy coal transportation. They transport the coal from mining site to barge transshipment port along the river or directly to the coal terminal along the coastline by track or conveyor belt. From the barge
transshipment port to coal terminal port or coal freighter, coal is transported by barge.
In Mahakam river, one of the main river for barge coal transportation in Kalimantan, there are some bottlenecks that restrict barge transport capacity, one is two road bridges at Samalinda and Tenggarong and the other is the channel at Mahakam delta. The span of Samarinda bridge is 40m only so that the barge size using Mahakam river is limited to 8,000 dwt only. Passage time under the bridge is also limited from 6:00 am to 18:00 only to avoid the accident of barge. Mahakam river has much accretion sand therefore the channel requires 1.3 million cubic meters dredging work every year to keep the enough depth for barge transportation.
There are five coal terminals in Kalimantan, two are public terminal and other three are particular contractor’s private terminal. Some contractors use these terminals to transship coal from barge to coal freighter ship but others transship its production from barge to coal freighter on the sea.
Photo 5.1 Coal transshipment to barge at Mahakam river
Photo 5.2 Coal transportation by barge at Mahakam river
Photo 5.3 Road bridge at Samarinda
Photo 5.4 Road bridge at Tenggarong
Photo 5.5 Unloading of coal from barge at Barikpapan coal terminal
Photo 5.6 Transshipment of coal at Barikpapan coal terminal
COAL FLOW
5.3
Totally 25 Kalimantan coal mining contractors sold 105.9 million tones coal in 2003. Of these 105.9 million tones, 83.1 million tones or 78.5% were exported and rest 22.8 million tones or 21.5 % were sold for Indonesian domestic use. Figure 5.2 shows the transition of coal sales of Kalimantan mining contractors. From 1994 to 2003, export coal sales have increased about 350%, and domestic sales recorded 770% growth.
0 20,000 40,000 60,000 80,000 100,000 120,000 ('000 ton)
1993 1994 1995 1996 1997 1998 1999 2000 2001 2002 2003
Domestic Sales Export
Source: Directorate of Mineral and Coal Enterprises, Indonesia Mineral and Coal Statistics 2004 Figure 5.2 Coal sales of Kalimantan mining contractors
5.4 PAST DISCUSSIONS ON COAL TRANSPORT IN KALIMANTAN
There are many past studies related to the coal business in the country. They are, for example, JICA (Japan) study in 1997, Monenco (Canada) in 1998, the IEEJ (Japan) studies in 2001 and 2002, FIKTM ITB (Indonesia) study in 2001, Yayasan Lentera (Indonesia) study in 2002, and NEDO (Japan) study in 2003.
The latest study, NEDO study in 2003, focused on the coal transport within Kalimantan and reached the straightforward conclusion. That is;
It is the most beneficial if a railway transport option is added to the present transport
infrastructure, together with expansion of the existing coal terminals and development of new coal terminals.
More importantly, however, the NEDO study points out the possibility of lack of domestic demand in around 2015.
6. COAL TRANSPORTATION
6.1 PRESENT STATE OF COAL TRANSPORTATION IN KALIMANTAN
The inland coal transportation in Kalimantan is conducted by truck, barge and belt conveyer and the existing transportation systems are;
Type 1. Mine site – truck – riverside coal terminal – barge – offshore loading to coal vessels Type 2. Mine site – truck – riverside coal terminal – barge –coal terminal port – loading to
vessels
Type 3. Mine site – truck – coal terminal port – loading to vessels
Type 4. Mine site – belt conveyer system – coal terminal port – loading to coal vessels.
(1) Type 1;
The transportation by barges and offshore transshipment without usage of port is most popular in East Kalimantan.
The coal is transshipped from a barge to a coal vessel at a loading point provided offshore. This offshore transshipment to coal vessels has poor loading capacity because coal is loaded using the coal vessel’s own loading gear. And the coal vessels without such gear and over Panamax Size vessels are not accepted. Some mines have or employ floating cranes.
The Codes of International Dangerous Matters of the International Marine Organization categorizes the coal falls in Fourth-Class Dangerous Matters. Therefore, in future there is the possibility that offshore loading will be banned and the loading work must be done at a terminal or a berth designed for that purpose.
The transshipping capacity is as shown follows;
Table 6-1 Transshipping capacity
20,000dwt Handy Panamax Cape
Kideco - 10,500 18,000 30,000
Multi Harapan 4,000 – 5,000 7,500 10,000 -
Baiduri 4,500 8,000 10,000 -
Berau - 16,000 20,000 24,000
Source: Preliminary Feasibility Study on Railway Coal Transportation in Kalimantan, Indonesia;
NEDO
(2) Type 2, Type 3 and Type4;
There are five coal terminals in Kalimantan, three of them are private, Tanjung Bara Coal Terminal (TBCT) of KPC, Bontang Coal Terminal (BCT) of Indominco, and North Pulau Laut Coal Terminal (NPLCT) of Arutmin, and other two are public, Balikpapan Coal Terminal (BPCT) and Indonesian Bulk Terminal (IBT). BPCT, TBCT and BCT are in East Kalimantan and IBT and NPLCT are located in South Kalimantan.
The public coal terminals, BPCT is used by only two users, Gunung Bayan and Kideco mines, and IBT is used only by Adaro.
The mines of KPC and Indominco are located near the coastline, KPC transports the coal to the terminal by belt conveyer system and Indominco transports the coal by truck.
COAL TERMINAL
6.2
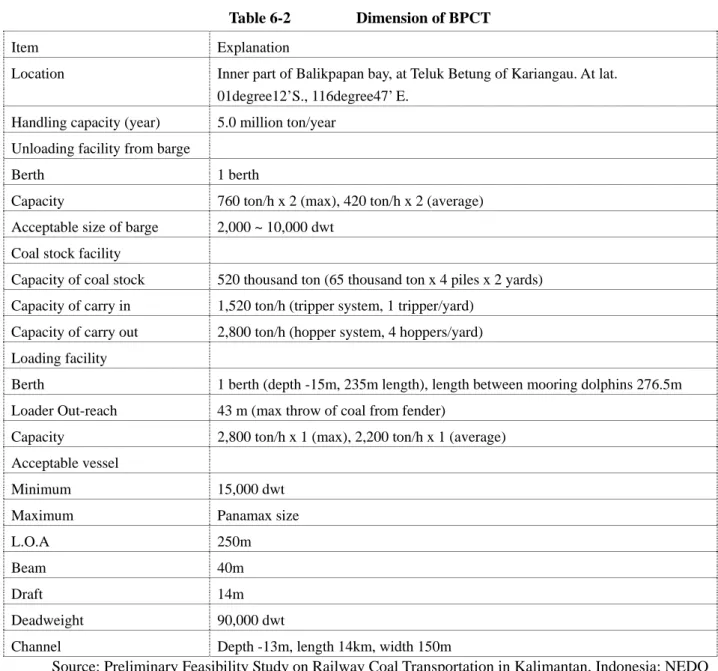
6.2.1 Balikpapan Coal Terminal (BPCT)
BPCT is located Teluk Betung of Kariangau area, north part of Balikpapan municipality, the inner part of BAlikpapan bay, and operated by PT.Dermaga Perkasapratama as public coal terminal.
The dimension of BPCT is as shown below;
Table 6-2 Dimension of BPCT Item Explanation
Location Inner part of Balikpapan bay, at Teluk Betung of Kariangau. At lat.
01degree12’S., 116degree47’ E.
Handling capacity (year) 5.0 million ton/year Unloading facility from barge
Berth 1 berth
Capacity 760 ton/h x 2 (max), 420 ton/h x 2 (average) Acceptable size of barge 2,000 ~ 10,000 dwt
Coal stock facility
Capacity of coal stock 520 thousand ton (65 thousand ton x 4 piles x 2 yards) Capacity of carry in 1,520 ton/h (tripper system, 1 tripper/yard)
Capacity of carry out 2,800 ton/h (hopper system, 4 hoppers/yard) Loading facility
Berth 1 berth (depth -15m, 235m length), length between mooring dolphins 276.5m Loader Out-reach 43 m (max throw of coal from fender)
Capacity 2,800 ton/h x 1 (max), 2,200 ton/h x 1 (average) Acceptable vessel
Minimum 15,000 dwt
Maximum Panamax size
L.O.A 250m Beam 40m Draft 14m
Deadweight 90,000 dwt
Channel Depth -13m, length 14km, width 150m
Source: Preliminary Feasibility Study on Railway Coal Transportation in Kalimantan, Indonesia; NEDO The user of BPCT is Gunung Bayan and Kideco mines at present.
The required time of loading to Panamax size vessel is about 30 hours, the necessary time is about 1/5 ~ 1/7 of offshore transshipment.
According to the Daw Jones News on December 1, 2004, PT. Dermaga Perkasapratama who operates BPCT made a floating terminal charter contract with Singapore company ASL Marine Holdings Ltd.
This floating terminal pontoon will be used by PT. Dermaga Perkasapratama for the unloading of from the barges, storage of coal, and subsequent loading of coal on to ocean-going coal vessels near the Balikpapan Coal Terminal. The charter contract amount is US$50 million for a period of 10 years.
The shipbuilding cost of a 65,000 dwt floating terminal is estimated US$32.8 million.
6.2.2 Indonesia Bulk Terminal (IBT)
IBT is located at the southern end of Plau Laut Island and the construction of 1st stage was completed at July 1997 with the capacity of 10 million ton/year. IBT is targeted to the public coal terminal for the coal mine in South Kalimantan. Laut island is separated by Laut strait of 5km width from Kalimantan island. The user of IBT is only Adaro mine at present.
TRANSPORTATION OF COAL FROM MINE TO COAL TERMINAL
6.3
Existing mines are located near the coastline or riversides where the coal can be transported easily by ocean vessels or barges. However, those mines in future newly developed mines will be located in the hinterland than the existing mines, in areas where barges cannot be used, therefore, the new mines will need new coal transportation systems.
Second- and Third-generation contractors are expected to become the principal developers of new mines, but many of them are afraid that their production will be delayed owing to short investment funds especially when they need to invest all the coal transportation method.
To promote the development of coal mine, it is necessary to prepare the coal transportation method including the coal terminal which can be used publicly by any new mines.
The transportation and loading cost by mode are estimated as follows.
Table 6-3 Transportation cost Method Cost (US$/ton-km) Truck 0.07 Barge 0.005 – 0.01 Railway 0.02 – 0.023 Belt conveyer 0.015
Source: Preliminary Feasibility Study on Railway Coal Transportation in Kalimantan, Indonesia; NEDO
Table 6-4 Loading cost Method Cost (US$/t) Barge 0.075 Railway 0.075 Transshipment 1.80
Coal terminal 2.25
Source: Preliminary Feasibility Study on Railway Coal Transportation in Kalimantan, Indonesia; NEDO
According to the Report of “ Preliminary Feasibility Study on Railway Coal Transportation in
Kalimantan, Indonesia” studied by the Institute of Energy Economics, Japan, the transportation of coal by train and coal terminal will be cheapest for the coal mines which will be developed.
The construction of railway from coal mine at the hinterland of Mahakam River to the coal terminal at Balikpapan and extension of BPCT is recommendable.
6.4 Railway construction plan 6.4.1 Specification of railway
The railway should be specialized to transport of coal.
The population of East Kalimantan is 3 million persons, the populations of Samarinda and Balikpapan are about 500 thousand persons and the area between Samarinda and Balikpapan is the sparsely populated area, therefore, the passenger transportation is not suitable for railway transportation.
The main purpose of construction of railway in Kalimantan is coal transportation and the other freight and passenger transportation are additional transportation, the study of railway system shall be done only for coal transportation.
(1) Gauge of track: Standard gauge
The gauge of railway in Java and South Sumatra is 1,067mm same as Japan. The railway in Kalimantan will be constructed and operated independently from existing railway of PT.KA, therefore, it will not be required to adopt the same system of PT.KA.
The purpose of the railway in Kalimantan is transportation of coal, the suitable railway system to transport the coal is heavy duty railway.
The suitable railway norm of railway in Kalimantan shall be standard gauge with heavier than 25 ton of axel load. The study report of PT.Gelar Sarana Trekka proposes the standard gauge and 27.5 ton of axle load for locomotive.
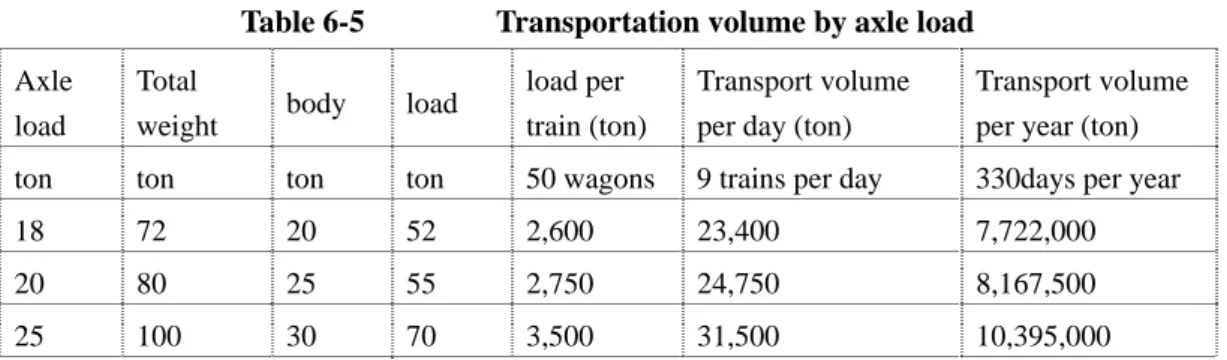
The relationship between axle load and wagon capacity is as shown below.
Table 6-5 Transportation volume by axle load Axle
load
Total
weight body load load per train (ton)
Transport volume per day (ton)
Transport volume per year (ton) ton ton ton ton 50 wagons 9 trains per day 330days per year
18 72 20 52 2,600 23,400 7,722,000
20 80 25 55 2,750 24,750 8,167,500
25 100 30 70 3,500 31,500 10,395,000
In this study, it is proposed to adopt the axle load of 25 ton, which makes it possible to transport more than 10 million tons coal per year with 9 trains operation per day.
The Study Report of PT.Gelar Sarana Trekka proposed to use the wagon with total load 90ton and pay load 70ton.
The line capacity related to the interval of stations and train operation speed is shown in Table 6-6.
Table 6-6 Line capacity by station interval and train speed
Distance Line capacity
(Train speed Km/h) 30 40 45 50 Interval of station Km Number of train par day
5 66 82 89 96
6 57 72 78 84
7 50 64 70 75
8 45 57 63 68
9 41 52 57 62
10 37 48 52 57
11 34 44 48 53
12 32 41 45 49
13 29 38 42 46
14 27 36 39 43
15 26 33 37 41
16 24 32 35 38
17 23 30 33 36
18 22 28 32 35
19 21 27 30 33
20 20 26 29 32
The line capacity for the distance of 2 stations at 15km and train speed 30km/h is 26 trains (round trip) per day. It is possible to operate 10 trains (one way) per day to realize the coal transportation of 10 million ton per year by single track.
The double track railway is not necessary to transport 10 million tons of coal per year.
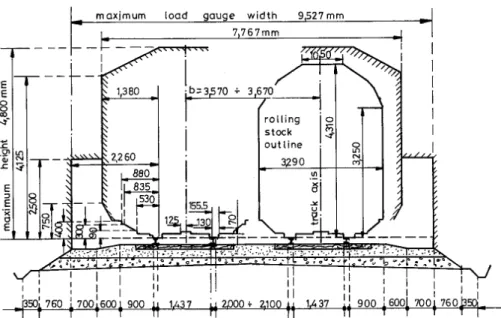
(2) Construction gauge
Indonesia consultant, PT.Gelar Sarana Trekka, studied the construction gauge based on the DB (Germany Railway) construction gauge. The construction gauges of DB, UIC and USA are shown below.
Fig. 6-1 Construction gauge of DB (German Railway)
Fig. 6-2 Medium and low-speed train construction gauge of UIC
Fig.6-3 Construction gauge of USA
All of these 3 construction gauge are similar and there will be no problem to adopt the construction gauge studied by PT.Gelar Sarana Trekka.
(3) Radius of curve and gradient
Lager radius and gentler gradient shall be adopted for heavy load train to economize the operation and to avoid the derailment of wagons. The study report of PT.Gelar Sarana Trekka proposed 1200m for minimum radius and 5 per mil. For steepest gradient, these propose is suitable.
(4) Signal
Automatic signal system with electronic interlocking system shall be adopted and Centralized Traffic Control system will be useful for efficient train control.
(5) Telecommunication
The exclusive telecommunication line by optical fiver will be suitable for Kalimantan railway.
(6) Alternative signal and telecommunication system.
It is necessary to study new train control system using GPS (Geographical Positioning System) and satellite communication system to minimize the construction cost.
(7) Rolling stock:
Diesel locomotive is suitable as the traction system for this railway.
High speed of train operation is not required for coal transportation trains, the average train speed can be 30km/h and maximum train speed is lower than 80km/h. At the length of 160km railway, the train operation time with 30km/h average speed is less than 6 hours (one way).
Loading and unloading capacity at mine and coal terminal is estimated 2,000 ton/h, with this assumption, loading and unloading times are 2.25 hours respectively.
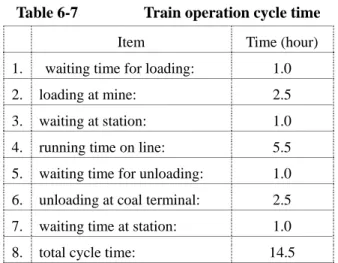
The cycle time of train operation is estimated as follows,
Table 6-7 Train operation cycle time
Item Time (hour)
1. waiting time for loading: 1.0 2. loading at mine: 2.5 3. waiting at station: 1.0 4. running time on line: 5.5 5. waiting time for unloading: 1.0 6. unloading at coal terminal: 2.5 7. waiting time at station: 1.0 8. total cycle time: 14.5
The cycle time of one train is about 14.5 hours, and one train can operate 1.6 time operation per day.
The composition of train is 2 locomotives, 50 coal wagons and 1 caboose. The required number of rolling stock is shown in Table 6-8.
Table 6-8 Number of rolling stocks necessary for coal transportation
Item Required number
for operation Reserve (20%) Total
Locomotive 12 3 15
Wagon 300 60 360
Caboose 6 2 8
6.4.2 Route
Indonesian Government has some technical reports for railway construction in Kalimantan and Indonesian consultants propose some railway routes between Samarinda and Balikpapan.
(1) Railway route sown in the Report of Rayakonsult PT.
The railway traffic demand is enough studied in this report but the railway route is not well studied and only the idea of route is proposed. The railway route is as shown in Fig.6-4,
Fig. 6-4 Railway rout studied by Rayakonsult
(2) Railway route proposed by PT.Gelar Sarana Trekka
This report proposed the technical mater of railway including the route and technical standards. The proposed railway route is coast line route to avoid the geographical undulation to reduce the construction cost of railway structures. The proposed route is as shown in Fig. 6-5.
The location and distance between 2 stations are shown as follow.
Table 6-9 Location of stations between Balikpapan and Samarinda Station Location (km) Distance(km) Town
Station 1 0 Balikpapan
10.668 Station 2 10.668
10.887 Station 3 21.5552
10.022 Station 4 31.577
8.354 Station 5 39.9312
8.602 Station 6 48.5332
5.737 Station 7 54.2706
11.376 Station 8 65.6467
14.294 Station 9 79.9411
12.504 Station 10 92.4454
10.458 Station 11 102.9035
10.635
Station 12 113.5389 Samarinda
The interval of stations, shortest is 5.737km and longest is 14.294km, but other intervals as between 8.375km and 12.504km and it does not vary widely, this condition may be easy to operate the trains on single track line.
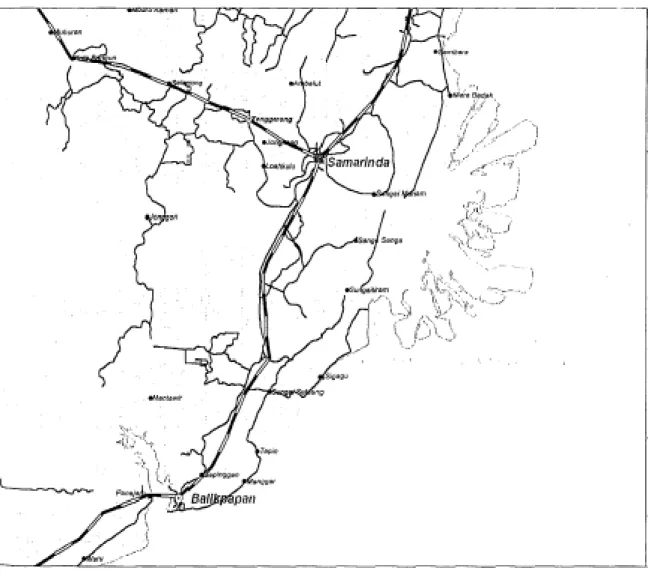
(3) Alternative route
The necessary railway for coal transportation is from mine to coal terminal, the railway line from Samarinda to coal mine area is not studied by Indonesian Consultant, however, the railway should be constructed to Kotabangun about 70km north-west of Samarinada for coal transportation.
The Fig.6-6 shows the railway line from Balikpapan to Kotabangun via Samarinda, the total length of railway is about 170km. From Balikpapan to Samarinda, two routes are shown in Fig.6-6, one is studied by PT.Gelar Sarana Trekka and one is short cut route as alternative.
Shortest line (straight line) between Samalinda and Balikpapan will be nearly 20km shorter than other coast line but the construction cost will be higher than coast line. However, the operation cost will be
lower than longer line, therefore, it is necessary to study this shortcut line from the view point of project life cycle cost.
For the construction cost, the coast line is lower cost per unit length and the shortcut route is higher because the undulation of route is larger than coast line and the working volume of cutting and filling is larger than coast line but the railway line length is shorter then the total construction cost may be not so different between two routs.
The total length of railway line is estimated as 170km for the coast line and 150km for shortcut line.
The stations should be constructed every 10km and coal terminal stations should be at Balikpapan and Kotabangun. The number of stations is two terminals and 16 stations for train passing.
Fig.6-6 Alternative railway route
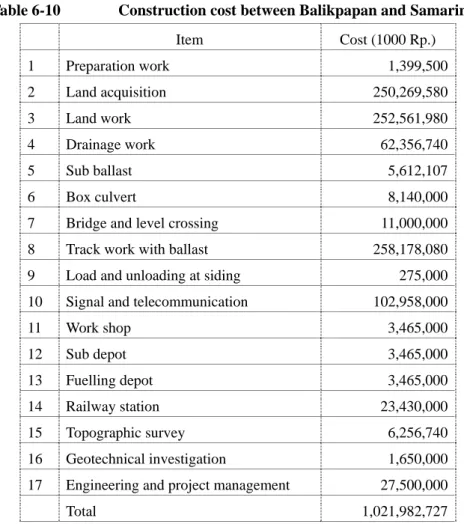
6.4.3 Construction cost
The construction cost, train operation and operation cost are studied with 170km railway line.
(1) Civil work
The construction cost between Balikpapan and Samarinda, 113km538.9m, estimated by PT.Gelar Sarana
Table 6-10 Construction cost between Balikpapan and Samarinda
Item Cost (1000 Rp.)
1 Preparation work 1,399,500
2 Land acquisition 250,269,580
3 Land work 252,561,980
4 Drainage work 62,356,740
5 Sub ballast 5,612,107
6 Box culvert 8,140,000
7 Bridge and level crossing 11,000,000 8 Track work with ballast 258,178,080 9 Load and unloading at siding 275,000 10 Signal and telecommunication 102,958,000
11 Work shop 3,465,000
12 Sub depot 3,465,000
13 Fuelling depot 3,465,000
14 Railway station 23,430,000
15 Topographic survey 6,256,740
16 Geotechnical investigation 1,650,000 17 Engineering and project management 27,500,000
Total 1,021,982,727
Total construction cost of 113.5389km is 1,021,983million Rp., i.e. 12,774 million Japanese yen, 9,001 million Rp./km and 112.5 million Yen/km. This cost includes civil work cost only.
The construction cost for 170km is estimated at 1,530,199 million Rp. (19,127million Yen) (2) Signal and telecommunication
The terminal station for Balikpapan is consists of 8 lines and 6 lines for Kotabangun terminal station and 2 lines for other 16 stations. The signal system with electric interlocking system will be adopted and optical fiver telecommunication line will be installed 170km along the railway line.
The construction cost of signal and telecommunication system is as follows;
Table 6-11 Construction cost of signal and telecommunication
Item Unit Unit price (1000Rp.) Amount(million Rp.) (million Yen) Balikpapan Terminal type A 41,664,000 41,664.0 521 Kotabangun Terminal type B 37,200,000 37,200.0 465
Stations 16 17,112,000 273,792.0 3,422
CTC 1 14,840,000 14,840.0 186
Cable 170km 108,000 18,360.0 230
Total Rp. 385,856.0
(3) Rolling stock
Number of rolling stock required for operation and estimated procurement cost are as follows, Table 6-12 Procurement cost of rolling stocks
Item
Required number for
operation
Reserve (20%)
Total number
Unit cost (1000Yen)
Amount (million yen)
Locomotive 12 3 15 400,000 6,000
Wagon 300 60 360 10,000 3,600
Caboose 6 2 8 4,000 32
Total 9,632
(4) Summarized Construction cost
The summarized construction cost of 170km railway between Balikpapan and Kotabangun via Samarinda is estimated as follows,
Table 6-13 Overall Construction cost
Item Amount (million Rp.) Amount (million Yen)
Civil work 1,530,199 19,127
Signal and telecommunication 385,856 4,823
Rolling stock 770,560 9,632
Total 2,686,615 33,582
6.3.4 Operation Cost
The maintenance and operation cost of South Sumatra Railway of TP.KA in 2003 is as shown below.
Table 6-14 Maintenance and operation cost of South Sumatra Railway in 2003 Item Amount 1 Direct Operation Cost 198,914,329
a. Train Costs 198,914,329
1 Fuel 73,422,919
2 Employees 31,851,773
3 Rolling Stock Maintenance 71,412,294 4 Rolling Stock Depreciation & Ins. 22,227,343 2 Indirect Operation Cost 70,816,098
a. Main Infrastructure Maintenance 28,586,311 b. Other Infrastructure Maintenance 573,786
c. Employees 28,225,373
d. Infra Depreciation & Ins. 862,393
e. Accident 3,252,058
f. Station / Yard 9,316,177
3. General Cost 60,708,947
a. Employees 20,969,794
b. Others 39,739,153
Total 330,439,374
The operation length of South Sumatra Railway is 638km and the operation cost per km is 518 million Rp./km/year (6,474 thousand Yen).
Take into the consideration of the various conditions of South Sumatra Railway, such as, lack of maintenance, operation of longer distance of coal transportation, operation of passenger train and other various cargos, the maintenance and operation cost per km for the railway in Kalimantan is estimated 500 million Rp. per year.
The maintenance and operation cost of 170km railway is estimated 85,000 million Rp. per year (1,063 million Yen).
6.4.5 Organization of railway operation
The organization of railway operation should be private organization which will be organized by the companies related to the coal mine, coal user, coal exporter and railway company.
The operation of this railway is simple compare to the railway in Java Island because the line is one line and they transport the coal from coal mine to coal terminal.
A new established organization will be able to operate the railway with appropriate training of staff and
6.5 Coal terminal extension plan
It is informed that the extension plan of Balikpapan Coal terminal is prepared and land area has already acquired.
The construction cost of extension of coal terminal is estimated roughly 3 billion Yen.
7. PRELIMINARY PROJECT JUSTIFICATION AND BUSINESS SCHEME
7.1
(1) (2) (3) (4)
PRELIMINARY ECONOMIC EVALUATION OF PPP BASED PROGRAM
7.1.1 General
The objective of the economic evaluation is to assess the economic feasibility of the PPP based Program, which is composed of the Public Sub-program and Private Sub-program. Both sets of the cost and benefit discussed in this chapter are respective sums in the Public and Private Sub-programs, unless otherwise specifically noted.
For the economic evaluation, two measures of project worth, namely, the net present value (NPV) and the economic internal rate of return (EIRR), are examined. In addition, a sensitivity analysis is made to evaluate the economic viability of the Program against possible changes in the project costs and benefits.
The economic evaluation is made based on the following assumptions:
The useful life of the Program is 30 years from the implementation.
For the calculation of EIRR, only direct economic benefits are counted, and any indirect and intangible benefits are not taken into account.
Constant prices at 2009 level are used in this economic evaluation.
The economic conversion factors given in Table 7.2 are used to convert the financial costs to economic values.
7.1.2 Economic Cost
The Economic Cost here is composed of the construction cost, physical contingencies, and operation and maintenance cost (O&M cost), all in terms of the economic value. The economic cost is obtained from the corresponding financial value and an economic conversion factor.
The construction cost is straight forward. It is the economic cost required for construction of the Program.
The physical contingencies are monetary values of additional real resources that may be required beyond the construction cost to complete the Program facilities. The O&M cost consists of the costs of
operation, maintenance, and repair of the civil structures, such as the track structures of the railways and the mooring facilities of the coal ports, and the non-civil facilities, such as the rolling stocks of the railways and the cargo sorting facilities of the coal ports.
The economic costs here do not include the working capital, depreciation, price contingencies, taxes and other transfer payments from the financial charges. Since the rail track is assumed to keep remained as the public assets, the land acquisition cost is not counted in this economic evaluation.
The construction cost and physical contingencies are given in Table 7.1
Table 7.1 Economic Construction Cost and Physical Contingencies Description Construction Cost
(US$ million) Notes 1. Railway track and control systems 193.9 Public sub-program
2. Coal port 21.3 Public sub-program
3. Stock yard 4.3 Private sub-program
4. Freight cars 78.0 Private sub-program 5. Loading station 8.5 Private sub-program 6. Physical contingencies 30.6
Total Economic Cost 336.6
Table 7.2 Economic Conversion Factors and Financial Costs Description Financial Cost
(US$ million) Conversion Factors 1. Railway track and control systems 228.1 0.85
2. Coal port 25.1 0.85
3. Stock yard 5.1 0.85
4. Freight cars (Rolling stocks) 91.8 0.85
5. Loading station 10.0 0.85
6. Physical contingency 36.0 0.85
Financial Base Cost 396.0 0.85
The O&M costs assumed in this chapter are given in Table 7.3, which includes the internal O&M costs and external O&M costs. Here, the internal O&M costs are related to the Program facilities, like railway track and loading stations, and assumed constant throughout the operational years. While, the external O&M costs, like On-site excavation cost and freight, are the costs beyond the Program but counted as part of the economic costs in order to fairly evaluate the economic viability. The external O&M costs are assumed proportional to the volume of coal transport under the Program.
Table 7.3 Economic O&M Costs
O&M Cost (US$ million/year) Description
Domestic Export 1. Railway track and control systems 2.2 US$million/year 2.2 US$million/year
2. Coal port 0.2 US$million/year 0.2 US$million/year 3. Stock yard 3.0 US$million/year 3.0 US$million/year 4. Freight cars (Rolling stocks) 6.5 US$million/year 6.5 US$million/year 5. Loading station 3.0 US$million/year 3.0 US$million/year
6. External costs 8.2 US$/ton 8.2 US$/ton
On-site excavation cost 5.0 US$/ton 5.0 US$/ton
Freight 3.2 US$/ton 3.2 US$/ton
to zero in the case of the Program. In this paper, the depletion premium is assumed negligible small and not numerically counted in the economic costs.
7.1.3 Economic Benefit
The economic benefit, which is the sum of the benefits expected from both of the Public Sub-program and Private Sub-program, is assumed to be the net increase of the coal production in East Kalimantan.
Besides, there are indirect benefits such as the employment and economic development opportunities, deterrent to environmental destruction, taxation to SPCs and community contribution from SPCs.
These indirect benefits are not counted in the economic evaluation of the Program.
(1) Benefits of Coal Transport (a) Economic prices of coal
In order to evaluate the expected program benefits, economic prices of export coal and non-export coal are examined. The economic prices of export coal are estimated on the basis of the economic parity border prices calculated from the projected world market prices of coal in the long-term range for the period from 2010 to 2039. The economic prices of non-export coal are valued by applying the conversion factors to their financial prices at the current market.
Table 7.4 summarizes projection of the economic coal prices for both export and domestic use. Further details on the projection are given in Appendix 2 hereto.
Table 7.4 Estimated Economic Coal Prices (a) For Export
Year Economic Price Notes
2004 37.01 US$/ton
2010 35.27 US$/ton Base year
2011 to 2039 Prices are reduced by 0.8% p.a.
Source: Estimate of the Study Team 6,200 kcal/ton FOB
(b) For Non-Export
Year Economic Price Notes
2004 28.80 US$/ton
2010 27.44 US$/ton Base year
2011 to 2039 Prices are reduced by 0.8% p.a.
Source: Estimate of the Study Team 5,200 kcal/ton FOB
(b) Net increase of coal production
The net increase of coal production will accrue primarily increased mining sites. The net increase of coal production is defined as the difference of the coal production between a) the without-the-Program condition and b) the with-the-Program condition.
The coal production in East Kalimantan in 2003 is reportedly 60 million tons, all of which are now transported by barge under the without-the-Program condition. It is targeted to increase over 170 million tons in 2020 under the with-the-Program condition. To realize such large increase, one can hardly expect any decrease of the barge transport. This is simply because the coal transport in East
Kalimantan has only two choices; barge and coal rail. Therefore, it is quite reasonable to assume that the net increase of the coal production under the Program equals the freight capacity of the coal rail. In other words, one can introduce full freight in normal years for each rolling stock of the coal rail.
Applying the coal production increase rate for the entire East Kalimantan discussed in Appendix 2, the net increase of coal production in East Kalimantan is assumed as illustrated in Figure 7.1.
0 2 4 6 8 10 12
2010 2015 2020 2025 2030 2035 2040
Year
Million ton
Export Non-Export Total
Figure 7.1 Assumption of Net Increase of Coal Production in East Kalimantan
(c) Benefits from net increase of coal production
Applying the economic coal prices discussed earlier, the economic benefit from the coal production increase is calculated, as shown in Table 7.5. The annual benefits of the Program are estimated to be US$ 84.7 million with 10% of the discount rate.
Table 7.5 Expected Economic Benefit under the Program Coal Transport
(Mt)
Unit Benefit
(US$/ton) Benefit (US$ million) Year
Export Domestic Export Domestic Export Domestic Total 2010 5.1 2.7 35.3 27.4 178.4 74.8 253.3 2011 5.5 2.6 35.0 27.2 190.7 72.0 262.7 2012 5.7 2.6 34.7 27.0 199.3 71.1 270.4 2013 5.9 2.7 34.4 26.8 204.6 72.0 276.6 2014 6.1 2.8 34.2 26.6 206.7 74.5 281.2 2015 6.1 3.0 33.9 26.4 206.1 78.5 284.6 2016 6.0 3.2 33.6 26.2 203.0 83.7 286.6 2017 5.9 3.5 33.3 25.9 197.6 90.0 287.6 2018 5.8 3.8 33.1 25.7 190.3 97.2 287.5 2019 5.5 4.1 32.8 25.5 181.4 105.1 286.5 2020 5.3 4.5 32.6 25.3 171.0 113.7 284.7 2021 4.9 4.9 32.3 25.1 159.5 122.7 282.2 2022 4.6 5.3 32.0 24.9 147.0 132.1 279.1 2023 4.2 5.7 31.8 24.7 133.9 141.6 275.4 2024 3.8 6.2 31.5 24.5 120.3 151.1 271.4 2025 3.4 6.6 31.3 24.3 106.4 160.5 266.9 2026 3.0 7.0 31.0 24.1 92.5 169.4 261.9 2027 2.6 7.4 30.8 23.9 78.8 178.1 256.9 2028 2.1 7.9 30.5 23.8 65.5 186.5 252.0 2029 1.7 8.3 30.3 23.6 52.7 194.6 247.3 2030 1.4 8.6 30.0 23.4 40.8 202.0 242.8 2031 1.0 9.0 29.8 23.2 29.7 208.7 238.4 2032 0.7 9.3 29.6 23.0 19.8 214.6 234.4 2033 0.4 9.6 29.3 22.8 11.2 219.5 230.6 2034 0.1 9.9 29.1 22.6 4.0 223.2 227.2 2035 0.0 10.0 28.9 22.5 0.0 224.5 224.5 2036 0.0 10.0 28.6 22.3 0.0 222.7 222.7 2037 0.0 10.0 28.4 22.1 0.0 220.9 220.9 2038 0.0 10.0 28.2 21.9 0.0 219.2 219.2 2039 0.0 10.0 27.9 21.7 0.0 217.4 217.4
Total 0.0 0.0 3,191.2 4,542.0 7,733.2
NPV 0.0 0.0 1,505.4 1,035.2 2,540.6
(2) Other Indirect Benefits
(a) Employment and economic development opportunities
Construction and operation of the railways and coal ports will give vast opportunities to professionals and local laborers to obtain employment. The recruited manpower will reinvigorate local economies through their housing and daily needs.
Another major benefit of the Program is the increase in economic opportunity, increased employment in transportation and service industries.
(b) Benefit to Regional Community
It is assumed that 1% of sales revenue is to be transferred to the regional community every year. The regional community will gain US$35 million in total for all over 30 years. With 10% of the discount rate, its contribution is computed to be US$10 million in a present value.
Note that all of the social impact when the Program is implemented, including household resettlement, will be compensated by the public sector and be neutralized before the commissioning. In this report, such social impact related to the project development is not counted in the public benefit discussions.
(c) Corporate Income Tax
The corporate income tax to be paid by SPCs during the commercial operation years is also counted as public benefit. In the base case discussed later, total amount of the corporate income tax to be paid by SPCs would be as large as US$402 million and its present worth is US$114 million with 10% of the discount rate for 30 years of the operational years from 2010.
Assumptions of the corporate income tax are given later in Sub-section 7.3.4 (2) (i).
7.1.4 Economic Evaluation (1) NPV and EIRR
The NPV and EIRR are calculated based on the aforementioned economic costs and benefits. The cost and benefit flow of the Program, which is composed of the Public Sub-program and Private Sub-program, during the useful life is given in Table 7.56.
The three measures for the Program are:
NPV = US$401.9 million
•
•
•
•
EIRR: 26.5%
These results indicate that the investment on the Program can expect sufficient economic returns.
(2) Sensitivity
The sensitivity analysis demonstrates the consequences of major changes in the values of costs and benefits parameters on the economic viability of the Program. The results of the sensitivity analysis showed that the Program remained economically viable under a combination of stringent sensitivity tests.
If, for example, it is assumed that the capital cost is 10% greater than the base case and economic prices of coal is 10% less than the same, the economic viability of the Program is sustained, as summarized below.
NPV = US$ 114.2 million EIRR: 15.1%