DISCUSSION PAPER No.131
企業の生産性と国際競争力:
日本と韓国の製造業の比較分析
( International Competitiveness: A Comparison of the Manufacturing Sector in Korea and Japan )
2016 年 2 月
文部科学省 科学技術・学術政策研究所 第 1 研究グループ
深尾京司 池内健太 金榮愨 権赫旭 牧野達治
本 DISCUSSION PAPER は、文部科学省科学技術・学術政策研究所が、一橋大学及び経済 産業研 究所 との共同 研 究の一部の成果をまとめたものであり、所内での討論に用いるとともに、
関係の方々からのご意見をいただくことを目的に作成したものである。
また、本 DISCUSSION PAPERの内容は、執筆者の見解に基づいてまとめられたものであり、機
関の公式の見解を示すものではないことに留意されたい。
【執筆者】
深尾 京司 一橋大学経済研究所 教授
文部科学省科学技術・学術政策研究所 客員研究官 独立行政法人経済産業研究所 ファカルティフェロー
池内 健太 文部科学省科学技術・学術政策研究所 第1研究グループ研究員 金 榮愨 専修大学経済学部 准教授
文部科学省科学技術・学術政策研究所 客員研究官 権 赫旭 日本大学経済学部 教授
独立行政法人経済産業研究所 ファカルティフェロー 文部科学省科学技術・学術政策研究所 客員研究官 牧野 達治 一橋大学経済研究所 研究員
本報告書の引用を行う際には、出典を明記願います。
DISCUSSION PAPER No.131
International Competitiveness:
A Comparison of the Manufacturing Sector in Korea and Japan
Kyoji Fukao, Kenta Ikeuchi, YoungGak Kim, Hyeog Ug Kwon, and Tatsuji Makino February 2016
First Theory-Oriented Research Group
National Institute of Science and Technology Policy (NISTEP) Ministry of Education, Culture, Sports, Science and Technology (MEXT)
Japan
http://doi.org/10.15108/dp131
企業の生産性と国際競争力:日本と韓国の製造業の比較分析
文部科学省 科学技術・学術政策研究所 第1研究グループ 要旨
本研究の目的は、日本と韓国の企業レベルのミクロデータを用いて、企業規模別及び産業別の 生産性と要素価格に関するデータセットを新たに構築し、両国の企業の相対的な競争力の変化を 定量的に分析することである。本研究では、Dekle and Fukao (2011)が開発した分析方法にもとづ き、日本企業に対する韓国企業の相対的な競争 力の時間を通じた変化の要因を、(1)全要素生 産 性(TFP)上 昇 率 格 差 の変 化 (韓 国 企 業 のキャッチアップ)、(2)生 産 要 素 の相 対 価 格 の変 化 、
(3)中間投入財の相対価格の変化、(4)実質為替レートの変化の4つに分解した。また、両国の企 業の競争力の変化について、企業規模別の比較も行った。本研究の分析結果によると、1994年か ら2010年の期間において、韓国の労働者の実質賃金率がほとんどの産業で倍増しているが、それ にも関わらず、韓国企業の競争力は日本企業と比較して低下していないことが明らかになった。さ らに、韓国企業における実質賃金の上昇の影響を打ち消した主な要因として、自動車製造業をは じめとする多くの産業において韓国企業の TFP 上昇率が高かったこと、電気・電子機械器具製造 業などのいくつかの産業では中間財の価格が急激に低下したことがわかった。また、多くの産業に おいて、日本の中規模・小規模企業に対する韓国の中規模・小規模企業の競争力が大規模企業 の場合よりも高まっていることも興味深い発見であった。韓国の中規模・小規模企業の相対的な競 争力の上昇の背景として、韓国では中規模・小規模企業の方が大規模企業よりも TFP 上昇率が 高かったこと、中規模・小規模企業と大規模企業の間の賃金格差が日本においては縮小している 一方で、韓国では逆に拡大していたことがわかった。
International Competitiveness: A Comparison of the Manufacturing Sector in Korea and Japan
First Theory-Oriented Research Group, National Institute of Science and Technology Policy (NISTEP), MEXT
ABSTRACT
Using firm-level data covering most firms in the manufacturing sectors of Korea and Japan, we compiled a new dataset of TFP and factor costs by firm size and industry. Employing this dataset, we quantitatively examine changes in the two countries’ relative competitiveness. Following Dekle, and Fukao’s (2011) approach based on production cost functions, we decompose intertemporal changes in the relative competitiveness of Korean firms vis-à-vis Japanese firms into four factors: (1) differences in TFP growth (catching up of Korean firms); (2) changes in relative factor prices; (3) changes in relative intermediate input prices; and (4) changes in real exchange rates. Using our new dataset, we also compare changes in the two countries’
competitiveness by different firm-size groups. We find that during the period of 1994-2010, the real wage rate of Korean workers doubled in most industries. Nevertheless, the competitiveness of Korean firms relative to their Japanese counterparts did not deteriorate. The main factors canceling out the impact of real wage increases were Korea’s higher TFP growth in many industries such as motor vehicles and the sharp decline in Korean intermediate input prices in some industries such as electrical and electronic machinery. We also find that in many industries
the competitiveness of Korean small and medium-sized firms vis-à-vis their Japanese counterparts increased by more than that of large firms. Two important developments can be observed which likely contributed to the improved competitiveness of small and medium-sized firms in Korea vis-à-vis their rivals in Japan. First, in Korea, small and medium-sized firms registered higher TFP growth rates than large firms during 1994–2010. And second, wage gaps across firm-size groups narrowed in Japan, while they widened in Korea.
1
概要
2
1. 背景・目的
日本と韓国の間に生産性レベル(技術水準)のギャップが存在する時までは、お互いに 競争するより補完的な部分が多く、日本から韓国へ多くの技術移転や技術のスピルオーバ ーがあった。しかし、日本経済が「失われた 20 年」と呼ばれる長期停滞期を経験している 間に日本が長期間国際競争力を誇ってきた電気機械や一般機械などの組立産業のみならず、
鉄鋼産業をはじめとする素材産業においても韓国の猛烈な追い上げを受けて、日本の国際 競争力の低下を実感できる状況にきている。三星電子(Samsung)、現代自動車(Hyundai)
などの韓国を代表する企業は世界市場における競合する日本企業のシェアを奪っており、
技術やブランドの国際的な認知度の面においてもライバル日本企業に負けていない。日本 と韓国は産業構造や貿易構造が近いこともあり、現在では日本企業と韓国企業は世界市場 で激しい競争を繰り広げている。このような状況で日本企業と韓国企業の間の相対的な競 争力の変化は両国の貿易収支や GDPへ大きなインパクトを与える可能性は非常に高いと 考えられる。日韓両国の企業の相対的な競争力を正確に理解することは、政策当局だけで はなく、世界市場で激しく競争している企業にとっても関心の高いテーマと考えられる。
上記のような背景の下で、本研究の目的は1994年から2010 年までに両国の企業データ を用いて、製造業における日本と韓国の相対的な国際競争力の変化の要因を、技術水準の 違いをあらわす生産性格差の変化や相対的な要素価格や中間投入価格、実質為替レートの 変化といった多面的な観点から定量的に比較することである。
2. データ・分析方法
本研究で使っているデータは各国の企業レベルのパネルデータである。まず、日本の データは 1994年から2010年までの経済産業省の『企業活動基本調査』の個票データであ る。『企業活動基本調査』のデータは従業者 50人以上かつ資本金または出資金3000万円以 上の企業を対象にする全数調査である。一方、韓国の企業データについては韓国信用評価 機関であるNICE社が作成したデータベースを利用する。このデータベースは韓国統計庁
3
が調査している韓国の『企業活動基本調査』と比較すると、企業数において 83%、従業者
数では73%、売上高では 75%をカバーしている。
本研究では、Dekle and Fukao (2011)が開発した生産費用関数に基づく分析方法を用いて、
日本企業と韓国企業の間の相対的な競争力の変化を以下の 4つの要因に分解した。
1) TFP(全要素生産性)上昇率の差異(韓国企業のキャッチアップ)
2) 相対的な要素価格(賃金、資本コスト)の変化 3) 相対的な中間投入価格の変化
4) 実質為替レートの変化
企業レベルのデータを用いることを活かし、製造業を17産業に分けて、各産業の競争 力をその産業に属する各企業の競争力を産業全体に占める各企業のコストシェアをかけて 集計して求めた。このように求められた産業競争力の源泉を上記に分解方法を用いて明ら かにした。また、両国において企業規模によって競争力が違うかどうかを確認するために、
17 産業毎に大規模企業、中規模企業、小規模企業の三つのグループ 1に分けて、産業レベ ルの分析と同様の方法を用いて、各産業における企業規模別に日韓の相対的な競争力とそ の源泉を明確に示した。
3. 本研究の主な分析結果
本研究で得られた結果は以下の通りである。まず、概要図表1で示すように1994 年から 2010 年の期間において、韓国の労働者の実質賃金率がほとんどの産業で倍増しているが、
それにも関わらず、韓国企業の競争力は日本企業と比較して低下していないことが明らか となった。
1 日本と韓国の両国について、各年の産業別に従業者数の大きい順に企業を並べ、グルー プ内の従業者数の合計がグループ間で等しくなるように、上から大規模企業、中規模企業、
小規模企業の3つのグループに分割した。
4
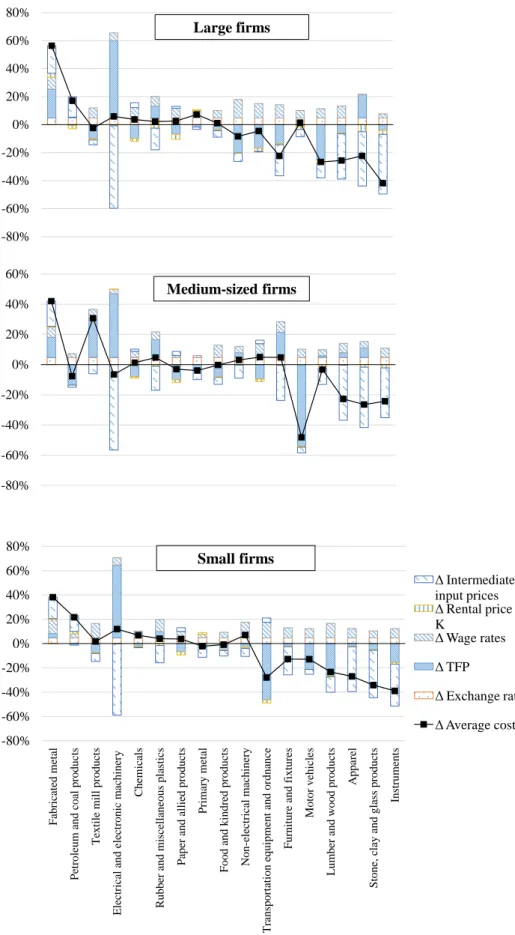
概要図表1:産業別の平均生産費用格差の変化の要因分解:日韓比較、1994-2010.
-80%
-60%
-40%
-20%
0%
20%
40%
60%
80%
金属製品製造業 石油・石炭製品製造業 繊維工業(衣服を除く) 電気・電子機械器具製造業 化学工業 ゴム・プラスティック製品製造業 パルプ・紙・紙加工品製造業 鉄鋼・非鉄金属製造業 食料品製造業 一般機械器具製造業 輸送用機械器具製造業(自動車を除く) 家具・装備品製造業 自動車製造業 木材・木製品製造業(家具を除く) 衣服製造業 窯業・土石製品製造業 精密機械器具製造業
韓国が優位←→日本が優位
中間投入価格上昇率の寄与 資本コスト上昇率の寄与 賃金率上昇率の寄与 TFP上昇率の寄与
為替レート変化率の寄与 相対平均コスト(韓国/日本)
変化率
さらに詳細な分析結果によれば、実質賃金の上昇の影響を打ち消した主な要因は、韓国 の自動車製造業をはじめとする多くの産業での高い TFP上昇に加え、電気・電子機械器具 製造業などのいくつかの産業においては中間投入財の価格の急激な低下によるものである ことがわかった。また、多くの産業で日本の中規模・小規模企業に対する韓国の中規模・
小規模企業の競争力が大規模企業の場合よりも高まっていることを明らかになった。日本 の中規模・小規模企業に対する韓国の中規模・小規模企業の競争力の上昇に貢献した重要 な現象は2つある。まず、韓国では、1994 年から 2010 年の期間において中規模・小規模 企業は大規模企業より TFP上昇率が高かった。次に、図 2で示すように企業規模グループ 間の賃金格差は日本においては縮小したが、韓国では拡大していた。
5
概要図表 2:企業規模別賃金ギャップの推移:日韓比較、1994-2010.
0.5 0.6 0.7 0.8 0.9 1.0 1.1
1994 1995 1996 1997 1998 1999 2000 2001 2002 2003 2004 2005 2006 2007 2008 2009 2010
【日本】中規模企業/大規模企業の賃金率格差
【日本】小規模企業/大規模企業の賃金率格差
【韓国】中規模企業/大規模企業の賃金率格差
【韓国】小規模企業/大規模企業の賃金率格差
4. 今後の研究課題
上記のような本研究の分析結果は今後取り組むべきいくつか研究課題を示している。ま ず、先進国の経済で観察された企業規模間の生産性格差が拡大している現象が韓国で見ら れない理由を明確にする必要がある。次に、国際的な労働分業やオフショアリングの時代 に、安くて質が良い中間財を仕入れることが企業の競争力を維持する上で重要度が増して いる中で、韓国の電気・電子機械器具製造業で安くて質が良い中間材を仕入れることがで きた理由を明らかにすることは学術的な面だけではなく、政策的にも重要な研究課題であ る。
6
参考文献
Dekle, R., and Fukao, K., with the assistance of Ungor, M. “The Japan-US Exchange Rate, Productivity, and the Competitiveness of Japanese Industries.” In K. Hamada, A. K. Kashyap, and D. E. Weinstein (eds.), Japan’s Bubble, Deflation, and Long-term Stagnation. U.K.: The MIT Press, pp. 105-28, 2011.
7
本文(英語)
8 I. Introduction
During the two lost decades, Japan’s manufacturing sector suffered from a deterioration of its international competitiveness caused by currency appreciation and a slowdown of TFP growth (Dekle, and Fukao 2011; Jorgenson, Nomura, and Samuels 2015). In some important industries, such as electrical and electronic machinery and motor vehicles, Korean firms such as Samsung Electronics and Hyundai Motors have captured markets from Japanese firms. Because the two countries share a similar level of economic development and similar factor endowments (abundant skilled labor and technical knowledge, scarce natural resources, etc.), have limited mutual foreign direct investment, and are located in close proximity, firms from the two countries frequently produce close substitutes and stand in fierce competition in world markets. The relative competitiveness of firms from the two countries has important implications for the two countries’
trade balance and final demand in the economy. Against this background, the purpose of the present study is to compare the manufacturing-sector competitiveness of the two countries using firm-level data covering the period from 1994 to 2010.
Our approach has two distinguishing characteristics. First, we quantitatively analyze changes in the relative competitiveness of the two countries from the perspective of average production costs. Following Dekle, and Fukao’s (2011) approach based on production cost functions, we decompose intertemporal changes in the relative competitiveness of Korean firms vis-à-vis Japanese firms into four factors: (1) differences in TFP growth (catching up of Korean firms); (2) changes in relative factor prices; (3) changes in relative intermediate input prices; and (4) changes in real exchange rates. As Dekle, and Fukao (2011) and Demian, and di Mauro (2015) have shown, changes in relative competitiveness can differ substantially across subsectors. We therefore examine competitiveness at a subsector level.
The second distinguishing characteristic of our analysis is that we take account of the possibility that changes in international competitiveness may differ across different firm-size groups. To do so, we compare the competitiveness of the two countries across different firm-size groups. In many manufacturing subsectors, firms of different size compete in different markets.
For example, in the motor vehicle and electrical and electronic machinery industries, most large firms are assemblers and compete in final goods markets. In contrast, most smaller firms are parts and components suppliers and compete in intermediate goods markets. Probably because of such differences, the manufacturing sector in both countries is characterized by a dual structure: large firms tend to be more human- and physical capital-intensive and offer substantially higher wages than smaller firms.2 In addition, TFP growth may also differ across firms of different size. As shown by Kim, Fukao, and Makino (2010), the productivity gap between large and small factories has widened in Japan.3 In the two lost decades, when productivity growth in Japan overall was very sluggish, it was primarily small and medium-sized enterprises (SMEs) that suffered a slowdown in TFP growth, while most large manufacturing firms in Japan continued to experience substantial TFP growth. This means that if no such widening in productivity gaps occurred in
2 For more on this issue, see Okazaki, and Okuno-Fujiwara (1999) and Lim (2013).
3 On this issue, also see Fukao, and Kwon (2006).
9
Korea, the competitiveness of small firms in Korea may have improved vis-à-vis their Japanese counterparts.
In order to examine manufacturing-sector competitiveness in the two countries from these two perspectives – average production costs and potential productivity differences across firms of different size – we compiled a new dataset of TFP and factor costs by firm size and industry, using firm-level data. The dataset covers most firms in Korea’s and Japan’s manufacturing sector and spans the period from 1994 to 2010.4
The remainder of this study is organized as follows. In the next section, we explain our analytical framework and data. Next, in Section III, we report the results of our empirical analysis, while in Section IV we summarize our main findings and discuss issues left for future research.
II. Analytical Framework and Data
Our approach to compare the competitiveness of Korea’s and Japan’s manufacturing sectors follows that presented in Dekle, and Fukao (2011). Specifically, we measure changes in the competitiveness of Korean firms by estimating changes in their average production costs relative to the average production costs of Japanese firms.
The structure of this section is as follows. First, we explain how we decompose changes in firms’ average production costs. Next, we explain how we aggregate firm-level data into averages for firm groups (firms are grouped by country, by industry, and by firm size) and how we convert the data for the two countries into a comparable unit. Finally, we describe our data sources.
We assume constant returns to scale and the following production function for a representative firm f in industry i in country κ at time t:
)) ( ), ( ), ( ), ( ( )
(
, ,, ,, ,, ,,,
,
t F L t K t X t T t
Y
f iκ=
iκ fiκ fiκ fiκ fiκ (1)where Yf,i,κ(t) denotes the real gross output of firm f, Lf,i,κ(t) is the labor input, Kf,i,κ(t) the capital service input, Xf,i,κ(t) the input of intermediate goods, and Tf,i,κ(t) the technology level.
The average production cost of firm f, Cf,i,κ, is given by
) (
) ( ) ( ) ( ) ( ) ( ) ( )
( ) ) (
(
, ,
, , ,
, , ,
, , , , ,
, , , ,
,
Y t
t X t q t K t r t L t w t Y t t C
i f
i f i
i f i
i f i f i
f i f i
f
κ
κ κ
κ κ
κ κ
κ κ κ
t + +
=
=
(2)
4 One of the authors of this paper already measured absolute TFP level of Korean and Japanese listed firms and studied about catching up in Jung, Lee and Fukao (2008). This paper is different from that work in three points. First, this paper analyzes not only TFP but also changes in all the determinants of average production costs, such as factor prices and exchange rates. Second, this paper covers small and medium sized firms in addition to large firms. Third, this paper covers more recent years (Jung, Lee, and Fukao (2008) covers the period of 1984-2005) and use Bank of Korea’s new data on prices in Korea.
10
where τf,i,κ(t) denotes the total cost, wf,i,κ(t) denotes the wage rate for workers at firm f, ri,κ(t) is the price of capital services, and qi,κ(t) the price of intermediate inputs.5 We measure all three factor prices in real terms. In the case of Korean firms, we deflate the three nominal factor prices in won by Korea’s consumer price index (CPI). Therefore, the unit of Korea’s average production costs,
Cf,i,Korea, is Korea’s consumption basket. Similarly, for Japanese firms, we deflated factor prices in
yen by Japan’s CPI. The unit of Japan’s average production costs, Cf,i,Japan, is Japan’s consumption basket.
For the Korea–Japan comparison of average production costs, we need to measure the two countries’ production costs in terms of an identical unit. For this purpose, we divide our average costs data on Japanese firms, Cf,i,Japan, by the real exchange rate, π=(Π×Korea’s CPI/Japan’s CPI), where Π denotes the nominal yen–won rate (the value of the Korean won in terms of the Japanese yen). The derived value, Cf,i,Japan/π, denotes Japan’s average costs in terms of Korea’s consumption basket.
Differentiating Equation (2) over time and using cost minimization conditions, we obtain
) ˆ ( ) ˆ ( ) ( )
ˆ ( ) ( )
ˆ ( ) ( )
ˆ (
, , ,
, , ,
, , ,
, , , ,
, t s t w t s t r t s t q t A t
Cf iκ = Lf iκ f iκ + Kfiκ iκ + Xf iκ iκ − f iκ (3)
where the circumflex denotes the growth rate of a variable. sLf,i,κ(t), sKf,i,κ(t), and sXf,i,κ(t) denote the cost share of each production factor. The cost shares are defined as follows:
) ( ) ( ) ( ) ( ) ( ) (
) ( ) ) (
(
, , ,
, , ,
, , , ,
, , , , ,
,
w t L t r t K t q t X t
t L t t w
s
i f i
i f i i
f i f
i f i L f
i f
κ κ
κ κ
κ κ
κ κ
κ
= + +
) ( ) ( ) ( ) ( ) ( ) (
) ( ) ) (
(
, , ,
, , ,
, , , ,
, , ,
,
,
w t L t r t K t q t X t
t K t t r
s
i f i
i f i i
f i f
i f K i
i f
κ κ
κ κ
κ κ
κ κ
κ
= + +
) ( ) ( ) ( ) ( ) ( ) (
) ( ) ) (
(
, , ,
, , ,
, , , ,
, , ,
,
,
w t L t r t K t q t X t
t X t t q
s
i f i
i f i i
f i f
i f X i
i f
κ κ
κ κ
κ κ
κ κ
κ
= + +
In Equation (3), ˆ ( )
,
, t
Af iκ denotes total factor productivity (TFP) growth on a gross output basis, which is defined by
5 We calculate firm-level wage rates by dividing total direct labor costs by the number of employees.
As for the price of capital services, ri,κ and the price of intermediate inputs, qi,κ, we do not have information at the firm level, so that we assume that these are identical across firms in a particular industry.
11 )
ˆ ( ) ( (...) )
( ) ) (
ˆ (
, , , , , ,
, , , ,
, T t
t T
F t Y
t t T
A f i
i f i i
f i f i
f κ
κ κ κ
κ
κ ∂
= ∂
In order to apply Equation (3) to discrete time-series data, we use the following Törnqvist approximation of this equation:
( ) ( )
{ }
( ) ( )
{ }
( ) ( )
{ }
( ) ( )
{
ln ( ) ln ( 1)}
) 1 ( ln ) ( 2 ln
) 1 ( )
(
) 1 ( ln ) ( 2 ln
) 1 ( )
(
) 1 ( ln ) ( 2 ln
) 1 ( )
(
)) 1 ( ln(
)) ( ˆ ln(
, , ,
,
, ,
, , ,
,
, ,
, , ,
,
, , ,
, ,
, ,
,
, , ,
, ,
1 , ,
−
−
−
−
− − + +
−
− − + +
−
− −
= +
−
−
− ≡
t A t
A
t q t
t q s t s
t r t
t r s t s
t w t
t w s t s
t C t
C C
i f i
f
i i
X i f X
i f
i i
K i f K
i f
i f i
f L
i f L
i f
i f i
f t
t i f
κ κ
κ κ κ
κ
κ κ κ
κ
κ κ
κ κ
κ κ
κ
(4)
Using Equation (4), we can decompose changes in average costs into changes in capital services prices, changes in wage rates, changes in intermediate input prices, and changes in TFP. We use the following variables to represent the different terms on the right-hand side of Equation (4):
( ) ( )
{ ln ( ) ln ( 1 ) }
2
) 1 ( )
ˆ (
, , ,
, ,
, ,
, , 1
,
,
+ − − −
≡
−
s t s t w t w t
W
f i f iL i f L
i t f t
i
f κ κ κ κ
κ ,
( ) ( )
{ ln ( ) ln ( 1 ) }
2
) 1 ( )
ˆ (
, ,
, , ,
, , 1
,
+ − − −
≡
−
s t s t r t r t
R
i iK i f K
i t f t
i κ κ κ κ
κ , and
( ) ( )
{ ln ( ) ln ( 1 ) }
2
) 1 ( )
ˆ (
, ,
, , ,
, , 1
,
,
+ − − −
−
≡
t q t
t q s t
Q s
i iX i f X
i t f t
i
f κ κ κ κ
κ .
Differentiating Equation (1) over time and applying the Törnqvist approximation, we can derive the following growth accounting relationship:
12
( ) ( )
( ) ( )
( ) ( )
{ }
( ) ( )
{ }
( ) ( )
{
ln ( ) ln ( 1)}
2
) 1 ( )
(
) 1 ( ln ) ( 2 ln
) 1 ( )
(
) 1 ( ln ) ( 2 ln
) 1 ( )
(
) 1 ( ln ) ( ln
) 1 ( ln ) ( ˆ ln
, ,
, , ,
,
, ,
, ,
, ,
,
, , ,
, ,
, ,
,
, , ,
,
, , ,
, ,
1 , ,
−
− −
− +
−
− −
− +
−
− −
− +
−
−
=
−
−
− ≡
t X t
t X s t s
t K t
t K s t s
t L t
t L s t s
t Y t
Y
t A t
A A
i i
X i f X
i f
i i
f K
i f K
i f
i f i
f L
i f L
i f
i f i
f
i f i
f t
t i f
κ κ
κ κ
κ κ
κ κ
κ κ
κ κ
κ κ
κ κ
κ
Using this relationship, we estimate the TFP growth rate of firm f in industry i in country κ from t-1 to t, Aˆtf−,i1,,κt, in Equation (4).
Next, we turn to how we aggregate the variables in Equation (4) over all firms in industry i in country κ. As weights for the aggregation, we use the total costs of each firm f. We then aggregate the variables on both sides of Equation (4) as follows:
[ ]
∑
∈−
−
−
= ×
i f
t t
i f t t
i f t
t
i
C
C ˆ
,1, ,1,,ˆ
,1,,κ κ
κ
θ
,[ ]
∑
∈−
−
−
= ×
i f
t t
i f t t
i f t
t
i
W
W ˆ
,κ1,θ
,1,,κˆ
,1,κ, ,[ ]
∑
∈−
−
−
= ×
i f
t t
i f t t
i f t
t
i
R
R ˆ
,1, ,1,,ˆ
,1,,κ κ
κ
θ
,[ ]
∑
∈−
−
−
= ×
i f
t t
i f t t
i f t
t
i
Q
Q ˆ
,1, ,1,,ˆ
,1,,κ κ
κ
θ
, and[ ]
∑
∈−
−
−
= ×
i f
t t
i f t t
i f t
t
i
A
A ˆ
,1, ,1,,ˆ
,1,,κ κ
κ
θ
,where
− +
= −
∑
∑
∈ ∈−
i g
i g i f
i g
i g i t f
t i
f
t
t t
t
) (
) ( )
1 (
) 1 ( 2
1
, , , , ,
, , , ,
1 , ,
κ κ κ
κ
κ
t
t t
θ t
.This aggregation yields the following relationship:
t t i t t i t t i t t i t t
i W K Q A
Cˆ,−κ1, = ˆ,κ−1, + ˆ,−κ1, + ˆ,−κ1, − ˆ,−κ1, (5)
We use 1994 as the benchmark year and set Ci,k(1994)=1 We, then, calculate Ci,κ(t) for t>1994
13 iteratively usingCi,κ(t)=Ci,κ(t−1)⋅exp(Cˆit,−κ1,t).
We can then examine the sources of changes in the relative competitiveness of the two countries in a particular industry by calculating the difference between the two countries in each of the terms on both sides of Equation (5) and taking account of changes in the real exchange rate:
t t t t
Japan i t t
Korea i t t
Japan i t t
Korea i
t t
Japan i t t
Korea i t t
Japan i t t
Korea i t t t t
Japan i t t
Korea i
A A
Q Q
K K
W W
C C
, 1 ,
1 , ,
1 , , 1 , ,
1 ,
, 1 , ,
1 , ,
1 , , 1 , , 1 ,
1 , ,
1 ,
ˆ ˆ ˆ
ˆ ˆ
ˆ ˆ
ˆ ˆ ˆ
ˆ ˆ
−
−
−
−
−
−
−
−
−
−
−
−
+ +
−
− +
− +
−
= +
−
p p
(6)
When we compare competitiveness across firm-size groups, we aggregate the variables for each firm-size group.
Next, let us explain our data sources and describe the key variables of our analysis. The main source for Japanese firm-level data is the Basic Survey on Business Structure and Activities (BSBSA) published by the Ministry of Economy, Trade and Industry (METI). The BSBSA consists of a survey of all firms with 50 or more employees and capital of 30 million yen or more in the manufacturing, retail, and wholesale sectors as well as some service sectors (including software services). Data for most of the key variables for Japanese firms are taken from this survey.
To deflate most of the input and output variables we employ industry-level deflators from the Japan Industrial Productivity Database 2014 (JIP 2014). CPI data are obtained from the Statistics Bureau, Ministry of Internal Affairs and Communications.
Specifically, our variables are measured as follows. Output is measured by deflating firms’
annual sales data from the BSBSA by the gross output deflators taken from JIP 2014. Labor input is firms’ number of employees taken from the BSBSA. Capital input is calculated as firms’ nominal fixed tangible assets (excluding land) from the BSBSA deflated by industry-level investment good deflators from JIP 2014. Intermediate input is calculated as nominal intermediate inputs from the BSBSA deflated by the intermediate input deflator from JIP 2014. Nominal intermediate inputs are the sum of the cost of sales and sales and general administration expenses minus total direct labor costs and depreciation.
Wage rate wi, κin Equation (2) is calculated by dividing total direct labor costs by the number of employees. The price of capital services, ri, κ, is the sum of the interest rate and the depreciation rate minus the rate of change in investment goods prices (capital gains). We calculate depreciation rates at the industry level using capital data from JIP 2014.6 For the interest rate, we use the rate on newly issued 10-year bonds, obtained from the Ministry of Finance. Finally, we employ the intermediate input deflator, qi, κ, to deflate nominal intermediate input to obtain real values.
Our main source for data on Korean firms is the firm-level dataset compiled by NICE GROUP (formerly National Information and Credit Evaluation, Inc., NICE). The dataset covers firms subject to statutory audit as well as firms listed on the Korea Stock Exchange. Firms are
6 Industry-level depreciation rates are calculated as the ratio of economic depreciation over the capital stock in a particular industry and year. Industry-level economic depreciation is the total sum of the economic depreciation of capital assets in the industry. JIP 2014 provides capital stock data for each industry and year.
14
subject to statutory audit if they have assets of more than 7 billion Korean won.
Industry-level deflators are compiled from two data sets. Output and intermediate input deflators are taken from the Korea Industrial Productivity Database 2012 (KIP 2012) provided by the Korea Productivity Center.7 As the deflator for capital we use the investment goods deflator provided by the Bank of Korea (BOK). The depreciation rate for capital is also taken from the BOK. Meanwhile, CPI data are taken from the Korean Statistical Information Service (KOSIS).
Next, wage rates, wf,i,Korea, the price of capital services, ri,Korea, and the price of intermediate inputs, qi,Korea, for Korean firms are calculated in the same manner as for Japanese firms. For the price of capital services we use the interest rate on 5-year housing bonds, which is taken from KOSIS.
When calculating wage rates, we had to estimate the total direct labor costs for Korean firms due to the lack of labor cost data in the NICE Database for many firms after 2004. As reporting of labor costs became voluntary in 2004, many firms have not reported labor costs since then. In order to estimate the total labor costs per worker for firms for which such data are not available in the NICE Database we calculate the average of the total labor costs per worker using the available data for the latest three years and extrapolated these using the industry average growth rate of average labor costs per worker. For the industry average labor costs per worker, we use the direct labor costs published by KOSIS, which are available for six different firm-size categories.
III. Empirical Results
This section reports the results of our empirical analysis. Figure 1 shows developments in average production costs and the constituent components over time in the motor vehicle industry in the two countries. All nominal values are deflated by the respective national CPI. For example, Figure 1(a) shows Japan’s real average production costs (Japan’s nominal costs in yen terms/Japan’s CPI), Ci,Japan, Korea’s real average production costs (Korea’s nominal costs in won terms/Korea’s CPI), Ci,Korea, and Japan’s average costs converted into won (in real terms) using the real exchange rate, Ci,Japan/π. All three variables are normalized to equal one in the base year, 1994.
Since the values for Korea’s real average production costs and for Japan’s average costs converted into won (in real terms) using the real exchange rate measure production costs in the two countries in terms of the same unit, namely, Korea’s consumption basket, the two series allow us to examine how the relative competitiveness of the motor vehicle industry in the two countries evolved over time.
In a similar manner, Figures 1(b) to (d) show how factor prices – wage rates, the rental price of capital, and intermediate input prices – evolved over time in real terms.8 Finally, Figure 1(e)
7 KIP 2012 was the most recent version available in January 2016.
8 Note that the series for the industry-level wage rate, wi,κ(t), is derived as follows:
ˆ ) exp(
) 1 ( )
(
, ,1,,
t t i i
i
t w t w
w
κ=
κ− ⋅
−κ , and∑ [ { ( ) ( ) } ]
∈
−
−
= × − −
i f
i f i
f t
t i f t
t
i
w t w t
w ˆ
,κ1,θ
,1,,κln
,,κ( ) ln
,,κ( 1 )
where θt-1,tf,i,κ is the weight that we already used for the aggregation of Equation (4) across firms.
However, here we do not multiply values by the cost share of labor. Therefore, the series wi,κ(t) differs
15
shows developments in TFP over time in the motor vehicle industry in the two countries. As explained in Section II, under our assumptions, changes in the average production costs in each country are equal to the weighted average of changes in the prices of the three factor minus changes in that country’s TFP. Moreover, the weights are equal to the cost share of each factor of production. In the case of machinery industries, the cost share of intermediate inputs is typically much higher than the labor and capital cost shares. In the case of the motor vehicle industry, for example, the cost share of intermediate inputs is around 80–85%, while that of labor is about 10–15% and that of capital about 5–10%. 9 Moreover, probably reflecting increasing modularization and the growing international division of labor, the cost share of intermediate inputs is on a rising trend.
Figure 1 suggests that Korean firms’ competitiveness vis-à-vis their Japanese counterparts, measured in terms of their average production costs, improved by about 5% during the period 1994–2010. The main engine for this gain in competitiveness was the higher TFP growth of Korean firms. Over the 16-year period, Korean firms’ TFP growth was 20 percentage points higher than that of their Japanese counterparts.10 On the other hand, real wage rates in Korea doubled during this period, reducing the competitiveness of Korean firms. In contrast, real wage rates in Japan hardly increased at all. In sum, our findings regarding long-run trends indicate that Korean workers in the motor vehicle industry enjoyed a doubling of real wage rates without this resulting in a loss of Korean firms’ competitiveness, which was made possible by the higher TFP growth in Korea.
Next, looking at annual fluctuations in the relative average production costs of the two countries, these are dominated by changes in the real exchange rate. As Figure 2 shows, during the period 1994–2010, there were two big swings in the yen–won real exchange rate: the Korean won appreciated substantially before the Asian currency crisis of 1997 and the global financial crisis of 2008 and depreciated sharply after the two crises. Reflecting these exchange rate movements, Korean firms’ competitiveness vis-à-vis Japanese firms deteriorated gradually before the two crises and improved rapidly after the crises.
It has been frequently argued that Korean manufacturing firms to a considerable extent rely on imported inputs, especially from Japan, and that a depreciation of the won leads to higher prices for foreign inputs, so that a depreciation of the won does not necessarily lead to a substantial improvement in Korean firms’ competitiveness.11 As Figure 1 indicates, it is true that intermediate input prices (deflated by Korea’s CPI) for Korean firms increased substantially during the periods of currency depreciation after the two crises; however, as panel Figure 1 (a) from Wi,κ(t). The rental price of capital, ri,κ(t), and intermediate input prices, qi,κ(t), take the same value for all firms within the same industry, so that these series require no aggregation.
9 Cost shares also depend on firm size. For example, smaller firms in the machinery industries tend to have lower intermediate input cost shares than larger firms.
10 Nevertheless, according to the East Asian Listed Company Database (EALC) based on purchasing power parity (PPP) data, the average TFP level of Korean firms in the motor vehicle industry in 2010 was still lower than that of Japanese firms. For more details, see Jung, Lee, and Fukao (2008).
11 See, for example, Pyun, and Choi (2015).
16
shows, the overall effect of the sharp currency depreciations was an improvement in Korean firms’
competitiveness vis-à-vis Japanese firms. Thus, even though it raises imported intermediate import prices, currency depreciation appears to increase Korean firms’ competitiveness.
Figure 1 also shows that most of the increase in real wages and TFP in Korea occurred between 1998 and 2004. It seems that both real wage rate and TFP improvements lost steam after 2004. Meanwhile, in the case of capital costs, taking also account of the relatively small cost share of capital inputs, it appears that movements in the rental price of capital did not play a decisive role in determining the relative competitiveness of firms from the two countries, with the exception of the period of Korea’s credit crunch in 1998.
Next, let us examine the case of the electrical and electronic machinery industry. As shown in Figure 3, Korean workers enjoyed a doubling of the real wage rate almost without a loss in Korean firms’ competitiveness, as in the case of the motor vehicle industry. However, the main factor canceling out the impact of the real wage increases was not high TFP growth: as panel Figure 3 (e) shows, according to our estimation, TFP growth in Korea’s electrical and electronic machinery industry was much lower than that in Japan. The main factor underpinning Korean firms’
competitiveness in this sector was the very sharp decline in intermediate input prices. Specifically, as can be seen in Figure 3, the decline in intermediate input prices (in terms of Korea’s consumption basket) for Korean firms between 1994 and 2010 was 30 percentage points greater than the decline in intermediate input prices converted into won (in real terms) for Japanese firms.
17 Figure 1
Average Production Costs and Constituent Components, Motor Vehicle Industry:
Korea-Japan Comparison
18 Figure 2
Yen–Won Real Exchange Rate (Monthly, 1994=1)
Note: The monthly average nominal yen–won rate (obtained from the Bank of Korea) is converted into real terms using the consumer price indexes of the two countries.
What explains the very low TFP growth and the sharp decline in intermediate input prices of Korean firms in the electrical and electronic machinery? There are two plausible explanations.
The first explanation is as follows. From the end of the 1990s to the present, Korean electrical and electronic machinery firms increased their procurement of inexpensive intermediate inputs from developing economies such as China. Firms achieved such an increase not only by switching from expensive suppliers in developed economies such as Japan to new, inexpensive suppliers in developing economies, but also by splitting production processes into multiple tasks and relocating most of the tasks to developing economics by setting up affiliates abroad (Choi 2014). Although Japanese electrical and electronic machinery firms made similar efforts from the beginning of the 1990s, Korean firms probably have made larger strides in this direction. This may be partly because Korean firms are more specialized in consumer electronics such as mobile phones and household appliances, the production processes of which can be relatively easily modularized and split. According to this explanation, the main source of Korean electrical and electronic machinery firms’ competitiveness is not their efficient domestic production but their ability to procure cheap high-quality intermediate inputs from abroad through the smooth operation of worldwide supply chains and their highly productive affiliates abroad.
19 Figure 3
Average Production Costs and Constituent Components, Electrical and Electronic Machinery Industry: Korea-Japan Comparison
The second explanation is offshoring bias.12 Suppose that imported intermediate inputs, say a certain type of ready-made semiconductors, are much cheaper than domestically produced inputs but their quality is not inferior. Moreover, electrical and electronic machinery firms are much more advanced in terms of increasing procurement of imported intermediate inputs than firms in other industries. Therefore, the share of imported inputs of semiconductors in total semiconductor inputs increases much more rapidly in the case of electrical and electronic machinery firms than firms in other industries (Fukao, and Arai, 2015, have shown that this is the case in Japan). Also suppose that no separate deflators for imported and domestically produced semiconductors are available and the only available deflator is for the average of the two. Under these circumstances,
12 For more on the offshoring bias problem, see Diewert, and Nakamura (2011) and Houseman et al.
(2011).