九州大学学術情報リポジトリ
Kyushu University Institutional Repository
Enhanced Oil Recovery from Heterogeneous
Reservoir by Blocking Performance with In/situ Formed Sodium Carbonate Gel
サムニアン, チア
https://doi.org/10.15017/4060153
出版情報:九州大学, 2019, 博士(工学), 課程博士 バージョン:
権利関係:
Enhanced Oil Recovery from Heterogeneous Reservoir by Blocking Performance with
In-situ Formed Sodium Carbonate Gel
Samneang Chea
Enhanced Oil Recovery from Heterogeneous Reservoir by Blocking Performance with
In-situ Formed Sodium Carbonate Gel
A DOCTORAL DISSERTATION
By
Samneang Chea
Department of Earth Resources Engineering, Graduate School of Engineering,
Kyushu University, Japan
2020
Enhanced Oil Recovery from Heterogeneous Reservoir by Blocking Performance with
In-situ Formed Sodium Carbonate Gel
Submitted to the Department of Earth Resources Engineering, Graduate School of Engineering,
Kyushu University, Japan
In Partial Fulfilment of the Requirement for the Degree of Doctor of Philosophy
By
Samneang Chea
Supervised by Professor Kyuro Sasaki
2020
-i- Abstract
Injected fluids conformance is one of challenges in producing oil by water flooding and enhanced oil recovery operations from a heterogeneous reservoir with large permeability variation layers or fractures. When the displacement process of reservoir fluids, such as oil or gas, is applied in the heterogeneities reservoir, the injected fluids tend to flow through the highest permeability pathway between injecting and producing wells. This breakthrough of the injected fluids causes decreasing in the production with the excessive fluids production through the pathway. In such case, blocking fluids flow to shut-off the short-cut pathway in thief zone in the heterogeneous reservoir.
The scope of this research considered characterizing and evaluating the potential of in-situ sodium carbonate gel (SC-gel) as blocking performance in heterogeneous reservoirs for enhanced oil recovery by forming from alkaline water-solution of sodium metasilicate (Na2SiO3ꞏ9H2O; S-MS) reacted with dissolved CO2 gas. To apply the SC- gel blocking to enhanced oil recovery after water flooding, the permeability and flooding tests were also carried out using sandstone cores.
This dissertation consists of five chapters.
Chapter 1 is the introductory chapter, which addresses the importance of the oil recovery process from heterogeneous reservoirs by blocking high permeable pathways, and its challenges. The overviews of oil recovery mechanism starting from primary to tertiary oil recovery and previous researches on water-shut off treatment methods. The approach of enhanced oil recovery method was highlighted comprehensively in this chapter for both megascopic and microscopic oil displacement efficiency.
Chapter 2 describes the experimental research process with an overview of qualitative and quantitative methods, data collection, recording and analysis. It also presents the materials, such as crude oil and chemicals, used in gel formation coreflooding experiments and interfacial tension measurement (IFT) between oil and the S-MS water solutions including the experimental setups measurement instrument. Furthermore, Raman spectroscopy and scanning electron microscopy/energy dispersive x-ray (SEM- EDS) spectroscopy that were used to analyse molecular compounds and chemical characterization of the gel formed in the experiments is explained. The sandstone core was used to measure the threshold pressure gradient (TPG) after in-situ forming SC-gel in it. The cylindrical heterogeneous core (43.4 mm in diameter and 72.0 mm in length) was constructed by combining two semi-cylindrical Berea sandstone cores with different
-ii-
permeability (300 mD and 50 mD). It was used for coreflooding test after injecting saline water and the Japanese light crude oil (JLO-I) into the core to evaluate the blocking effect in the heterogeneous reservoir.
Chapter 3 explains the gel characterization and evaluation by using the sodium metasilicate (S-MS) solution and dissolved CO2 gas. The characterization process based on the chemical and physical properties of the gel formed from different S-MS concentration, CO2 gas pressure, temperature, time, salinity and divalent ion. The gel properties were measured based on both chemical and physical methods. The physical characterization was presented on the gelation time, gel strength, and gel stability through the controlling parameters such as sodium metasilicate concentrations (1-10 wt%), CO2
Gas pressure (2-7.5 MPa), temperature (25-80 ºC), salinity (NaCl; 0.1-10 wt%), divalent ion (Ca2+; 10-10000 ppm), and light crude oil interaction (JLO-I). Both Raman and SEM- EDS spectroscopies revealed that the gel was a sodium carbonate type (SC gel). Gelation time after CO2 gas injection was around 1 to 24 h depending on temperature and pressure.
Gel strength increased with higher S–MS concentration and CO2 gas pressure. The baseline concentration of S-MS solution was selected for the detailed investigation of the effect of supercritical CO2 injection, salinity (NaCl), divalent ion (Ca2+), and crude oil interaction with the gel property, as well as the gel behaviour in the porous media.
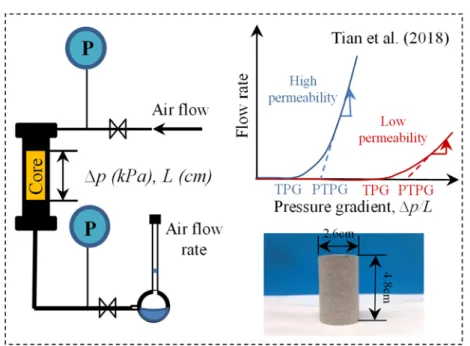
Measurements of gas permeability and threshold pressure gradient (TPG) were carried out to evaluate the blocking effect by forming SC-gel in the sandstone core. It was confirmed that TPG and gas permeability of the sandstone core increased by 2.6 times and decreased about 1/10 to that of water saturation by filling in-situ SC-gel.
Chapter 4 evaluates the blocking performance of in-situ formed SC-gel on oil recovery from the heterogeneous sandstone core. Firstly, the alkaline flooding of S-MS solution can be applied after water flooding and before blocking operations to improve the oil recovery, because IFT between oil and S-MS solution and oil was reduced to around 0.1 mN/m from 27 mN/m of the case of water. It was confirmed that micro- emulsion consisting water droplets (0.5-50 μm) in oil and stable up to three weeks at temperature of 55°C was generated by mixing 0.5-2 wt% of S-MS solution including 0.1- 10 wt% of NaCl.
The coreflooding test was applied to the heterogeneous sandstone core prepared from two different permeability sandstone cores. The water flooding using the saline water (2 wt% of NaCl concentration) was conducted until oil recovery became 57%. Then 1 wt%
of S-MS solution of 0.5 pore-volume (PV) at 0.1 mL/min was injected as the alkaline
-iii-
flooding. Then 0.3 PV of 5wt% of S-MS solution at the same flow rate and CO2 gas was injected at 2.0 MPa. After the injections, the core was immediately shut-in to form in-situ gel for 2 days in which the pressure drop of 1.6 MPa was recorded due to CO2 gas dissolution and forming the gel. Meanwhile the pH, pressure drop in the core, oil and water/solution volumes in produced micro-emulsion were also monitored during the core flooding to investigate fluids properties in the core. When 2 PV water injection at the same flow rate took place again after shut-in, the pressure drop increased to 1.5 times (permeability reduced to 67% reduced) with increasing 9 % in oil recovery ratio due to the in-situ formed gel in the core. It was concluded that the operation of blocking with in- situ formed SC-gel by injecting S-MS solution and CO2 gas was effective for the heterogeneous oil reservoir after water and alkaline floodings.
Chapter 6 is a summary and conclusion of the major findings of present research, including the research interest in the future study.
-iv-
Acknowledgement
I would like to express my gratitude to Professor Kyuro SASAKI for his invaluable guidance, time, encouragement and his excellent supervision during this research. No achievement without him.
I also would like to gratefully thank to Assoc. prof. Yuishi Sugai for his kind support, assistance and discussion during the laboratory experiment.
Acknowledgement and appreciation go to Asst. prof. Ronald Nguele for his helpfulness, discussion and suggestion during my research.
I am thankful to all members of Resources Production and Safety Engineering Laboratory and also all professors and department office staffs of Earth Resources Engineering Department for their helpfulness and kindness.
I would like to give my sincere gratitude to KIZUNA program (JICA) for the scholarship and financial supports for my research.
I gratefully acknowledge Dr. OM Romny, General Director of the Institute of Technology of Cambodia for giving this golden chance to pursue my study.
Last but not least, special thanks are extended to my beloved wife and family for their support, encouragement and loves during my study.
-v-
Table of contents
Abstract ... i
Acknowledgement ... iv
Table of contents ... v
List of figures ... vii
List of tables ... x
Chapter 1 : Introduction ... 1
1.1 Oil Recovery Mechanisms ... 1
1.1.1 Microscopic Displacement of Fluids in a Reservoir ... 4
1.1.2 Macroscopic Displacement Efficiency ... 7
1.2 Previous Research and Problem Definitions ... 8
1.2.1 Oil Recovery from Heterogeneous Reservoirs ... 8
1.2.2 Previous Gel Characterization ... 9
1.2.3 Alkaline Flooding Using S-MS Solution ... 14
1.2.4 Effect of Salinity on Microemulsion Formed from Oil and S-MS Solution 15 1.3 Objectives ... 18
1.4 Outline of Dissertation ... 18
Chapter 2 : Experimental Research Process ... 21
2.1 Introduction ... 21
2.2 Materials and Methods of Gel Characterization and Evaluation of Present Research ... 21
2.2.1 Materials ... 21
2.2.2 Gel Formation ... 22
2.2.3 Chemical Characterization ... 22
2.2.4 Physical Characterization ... 23
2.2.5 Evaluation of In-situ Gel as a Blocking Agent ... 25
2.3 Materials and Methods of Evaluation of S-MS Solution as Alkaline Flooding Agent ... 26
2.3.1 Materials ... 26
2.3.2 Measurement Methods ... 26
2.4 Blocking Test of SC-Gel in Enhanced Oil Recovery ... 28
2.4.1 Porous Media ... 28
2.4.2 Fluids and Chemicals ... 28
2.4.3 Crude Oil ... 29
2.4.4 Core Flooding Test System ... 29
-vi-
2.4.5 Heterogeneous Berea Sandstone Core ... 30
2.4.6 Coreflooding Scheme ... 30
Chapter 3 : In-situ Characterization and Evaluation as Blocking Agent ... 32
3.1 Introduction ... 32
3.2 Screening of Baseline Concentration ... 32
3.3 Spectral Characterization of Gel ... 33
3.4 Physical Properties of Gels ... 35
3.4.1 Gel Formation Time ... 35
3.4.2 Rheological Properties of In-Situ Gel ... 39
3.4.3 Gel Strength ... 40
3.4.4 Gel Stability ... 43
3.5 Parameters Influencing Gel Formation ... 45
3.6 Blocking Performance of In-Situ SC-Gel ... 49
3.7 Conclusions ... 51
Chapter 4 : The Effect of In-situ Sodium Carbonate Gel as Blocking Agent in Heterogeneous Reservoir for Enhanced Oil Recovery ... 53
4.1 Introduction ... 53
4.2 Static Interfacial Tension of Oil (IFT) between Oil and S-MS Solution ... 54
4.3 Wettability Alteration of Oil in S-MS Solution ... 56
4.4 Analysis of O/W Emulsion formed with S-MS Solution ... 56
4.4.1 Phase Behaviour of Microemulsion formed with S-MS Solution ... 56
4.4.2 Microemulsion Stability ... 57
4.4.3 Type of Microemulsion and Particle Size Distribution ... 59
4.5 Core Flooding Results on the Effects of S-MS as Blocking Performance for Enhanced Oil Recovery (EOR) ... 61
4.6 Conclusions ... 66
Chapter 5 : Conclusions ... 68
5.1 Summaries of Present Research ... 68
5.1.1 In-situ SC-gel Characterization and Evaluation as Blocking Agent... 68
5.1.2 Effect of S-MS solution on IFT Reduction, Wettability Alteration, and Emulsification as Alkaline Flooding Agent ... 69
5.1.3 Effect of In-situ SC-gel as Blocking Agent in Heterogeneous Reservoir for Enhanced Oil Recovery ... 70
5.2 Future Possibility and Recommendation ... 71
References ... 72
-vii-
List of figures
Figure 1.1 Oil recovery process ... 2
Figure 1.2 The concepts of surface and interfacial tension ... 4
Figure 1.3 Capillary measurement method (Abdallah et al., 2007) ... 5
Figure 1.4 Wettability and interfacial tension (Green and Willhite, 1998) ... 6
Figure 1.5 Effect of wettability on saturation ... 6
Figure 1.6 Gel time determination ... 10
Figure 1.7 Gel strength determination (Sydansk and Argabright, 1988) ... 11
Figure 1.8 Rheology of a shear-thinning fluid (Green and Willhite, 1998) ... 13
Figure 1.9 Effect of S-MS solution and salinity on the IFT (Larrondo and Urness, 1985) ... 15
Figure 1.10 Three types of phase behavior system and the effect of salinity on phase behavior (Sheng, 2011) ... 16
Figure 1.11 Conceptual oil recovery process in heterogeneous reservoir ... 18
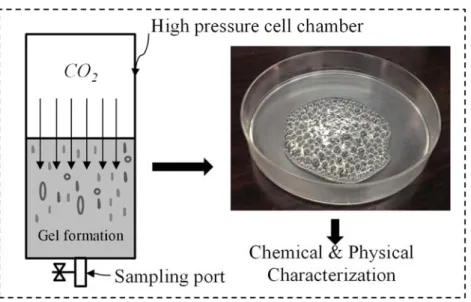
Figure 2.1 In-situ gel formation as per conducted in this study ... 22
Figure 2.2 Gel formation test in porous media ... 23
Figure 2.3 Schematic evaluation of gas permeability in Berea sandstone core ... 25
Figure 2.4 Surface tension meter (DropMaster DMS-401) ... 27
Figure 2.5 Schematic figure of wettability measurement ... 27
Figure 2.6 Heterogeneous Berea sandstone core before oil saturation ... 28
Figure 2.7 Schematic figure of coreflooding apparatus: (1) injection pump, (2) CO2 gas cylinder, (3) gas regulator, (4) CO2 storage high pressure cell, (5) pressure indicator, (6) mounted plug, (7) fractionator ... 29
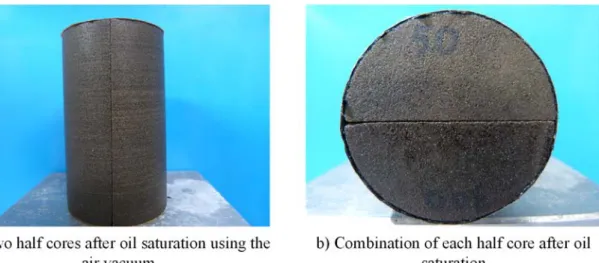
Figure 2.8 A Cylindrical heterogeneous Berea sandstone core formed by combining two half core with different permeability after oil saturation ... 30
Figure 3.1 pH monitoring during the gel formation ... 33
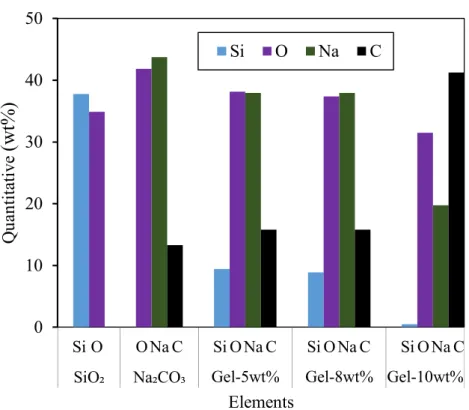
Figure 3.2 SEM images obtained from S-MS solutions and CO2 at different concentrations; (a) 5 wt%, (b) 8 wt%, and (c) 10 wt% ... 33
Figure 3.3 Raman spectra of gel samples ... 34
Figure 3.4 Elemental composition of samples prepared at different S-MS concentrations and dissolved CO2 under pressure of 5.5 MPa ... 35
Figure 3.5 Gelation time as function of S-MS concentrations ... 36
Figure 3.6 Effect of temperature on gelation time and gel strength ... 37
-viii-
Figure 3.7 Mass of in-situ gel (g/g-solution) formed in porous media consisting of glass- beads ... 38 Figure 3.8 In-situ gel formation in porous media, (a) glass beads saturated by 5 wt% of S-MS before gelation; (b) glass beads bonded by gel after gelation by 5 wt% of S-MS, under 5.5 MPa of CO2 pressure, 25ºC, 24 h; (c), (e) glass beads saturated by 10 wt% of S-MS before gelation; (d) glass beads bonded by gel after gelation in supercritical CO2
injection, 7.5 MPa, 35ºC, 24 h ... 38 Figure 3.9 Rheological properties of SC-gel ... 39 Figure 3.10 Effects of S-MS concentration, and CO2 gas pressure on SC-gel strength . 40 Figure 3.11 Effects of S-MS concentrations (1-10 wt%) on the gel strength in subcritical CO2 condition (25ºC, 5.5 MPa of CO2 pressure, and 45 min of shut-in time ... 42 Figure 3.12 Gel strength investigation in supercritical CO2 condition (35ºC, 7.5MPa of CO2 pressure, and 24 h of shut-in time)エラー! ブックマークが定義されていません。
Figure 3.13 Effect of temperature on the gel strength in supercritical CO2 condition (35- 55 ºC, 7.5 MPa-CO2 pressure, and 24 h of shut-in time) ... 42 Figure 3.14 Effect of temperature on gel apparent viscosity in supercritical CO2 injection ... 43 Figure 3.15 Gel stability as function of different S-MS concentrations and temperatures ... 44 Figure 3.16 Effect of temperature on the gel stability ... 44 Figure 3.17 Effects of salinity (NaCl) on the gel strength (10 wt% of S-MS, 0.1-10 wt%
of NaCl@25 ºC, 5.5 MPa-CO2 gas pressure) ... 45 Figure 3.18 Precipitation with different Ca2+ concentrations (10 wt% of S-MS @25 ºC) ... 46 Figure 3.19 Effect of Ca2+ concentration on SC-gel strength ... 46 Figure 3.20 Effect of crude oil interaction on the gel behavior and gel formation in subcritical CO2 condition (S-MS 5wt%-solution /JLO-I, 25ºC, 5.5 MPa-CO2, 45min-shut- in time) ... 47 Figure 3.21 Effect of crude oil interaction on the gel behavior and gel formation in subcritical CO2 injection (S-MS-10 wt%/JLO-I@25ºC, 5.5 MPa-CO2, 45 min-shut-in time) ... 48 Figure 3.22 Effect of crude oil interaction with 10 wt% of S-MS solution on the gel formation (Volume ratio of S-MS/JLO-I=1@25ºC, 5.5 MPa-CO2, 45 min of gelation time) ... 49 Figure 3.23 Blocking performance for gas permeable flow by the in-situ formed SC-gel in core samples ... 50 Figure 4.1 Schematic figure of challenge of oil displacement process in heterogeneous reservoir and the effectiveness of in-situ blocking SC-gel in high permeability zone ... 53
-ix-
Figure 4.2 Effect of S-MS solution on IFT reduction (JLO-II) ... 55 Figure 4.3 Comparisons of JLO-II and JHO on IFT vs. S-MS solution concentration .. 55 Figure 4.4 Contact angle of oil droplet vs. S-MS solutions (0.01-0.07 wt%) to evaluate wettability alteration of JLO-II/JHO ... 56 Figure 4.5 Effect of S-MS solution on emulsification of Japanese light crude oil and various salinities: (a) 2 wt%-S-MS/JLO-II/salinity (0.1-10 NaCl wt%)@ 55 ºC, and (b) 1 wt%-S-MS/JLO-II/salinity (0.1-10 NaCl wt%) ... 57 Figure 4.6 Effect of S-MS concentration on microemulsion stability of Japanese heavy oil (JHO) with range of salinity ... 58 Figure 4.7 Microemulsion stability forming by mixing of 1 wt% of S-MS concentration/JHO/different salinities (0.1-10 wt% of NaCl) ... 59 Figure 4.8 Microemulsion stability forming by mixing of 2 wt% of S-MS concentration/JHO/different salinities ... 59 Figure 4.9 Microphotography of microemulsion of Japanese heavy oil (JHO) at 1 wt% of S-MS concentration and ranging salinities in 1 week ... 60 Figure 4.10 Droplet size distribution of formed O/W and W/O microemulsion in various salinities, 0.1-10 wt% NaCl ... 61 Figure 4.11 Oil recovery by applying the two functions of S-MS as alkaline flooding and in-situ SC-gel formation in the heterogeneous Berea sandstone core... 62 Figure 4.12 Monitoring results of pH of fluid in heterogeneous sandstone core ... 62 Figure 4.13 Photographs of produced fluids showing O/W and W/O microemulsion during 1 S-MS wt% alkaline flooding ... 63 Figure 4.14 Photographs of produced fluids showing O/W and W/O microemulsion during 5 S-MS wt% solution flooding ... 64 Figure 4.15 Monitoring of pressure decreasing during shut-in (2 days) for SC-gel formation ... 65 Figure 4.16 Pressure difference monitoring during the shut-in time period ... 65
-x- List of tables
Table 1.1 Methods of enhanced oil recovery (Taber et al., 1997) ... 2
Table 1.2 Summary of screening criteria for EOR methods(Carman, 1956) ... 3
Table 1.3 Contact angle in different wettability (Zolotukhin and Ursin, 2000) ... 6
Table 1.4 Bottle test-gel strength code (Sydansk and Argabright, 1988) ... 11
Table 2.1 Properties of each half Berea sandstone core ... 28
Table 2.2 Properties of chemical solutions ... 29
Table 2.3 The properties of heterogeneous Berea sandstone core after combination ... 30
Table 2.4 The details injection scheme in coreflooding test system ... 31
Table 3.1 Gas permeability reduction by in-situ SC-gel ... 51
-1- Chapter 1: Introduction
Oil is a fundamental energy source and also an important chemical raw material. 95% of worldwide oil production is used to provide energy purpose. However, the oil resources are being depleted rapidly. In addition, to increase the oil production replying the growing of global demands of fossil fuel, some oil recovery operation and technique have been developed from primary, secondary and tertiary process to enhance the oil recovery.
Tertiary recovery is the most important method used to remove the residual oil trapping the pore space in the reservoir which cannot be produced by primary and secondary process.
The water breakthrough has been a main problem during the enhanced oil recovery (EOR) process in the heterogeneous reservoir consisting of fracture or a short-cut layer with much higher permeability than that of other layers resulting in low oil recovery ratio.
1.1 Oil Recovery Mechanisms
Oil recovery operation traditionally has been subdivided into three stages: primary, secondary and tertiary. Primary recovery is the oil recovery from the natural drive energy existing in the reservoir. Secondary recovery is usually implemented after the primary stage by water flooding, pressure maintenance and gas injection process. Tertiary is any technique applied after secondary recovery by using miscible gases, chemicals, or thermal energy to displace the residual oil trapped in the pore space after the secondary recovery process became uneconomic (Green and Willhite, 1998; Lake, 1996). The recovery factor by primary and secondary process is around 35 to 50 % of the original oil in place. But the residual oil in the part of the reservoir swept by water flooding largely remains about 20% to 35%, so the oil may still exist about 50-60 % (Green & Willhite, 1998). In this case, the tertiary recovery or EOR process is expected to remove the remaining oil. By the way, the EOR process somehow can be applied after the primary stage so the stage of oil recovery is not always in chronological order. The oil recovery process is comprehensively provided in Figure 1.1.
-2-
Figure 1.1 Oil recovery process
Enhanced oil recovery, principally results from the injection of gases, or liquid chemicals and/or the use of thermal energy which do not normally present in the natural reservoir.
Enhanced oil recovery can be in term of tertiary oil recovery and it can be carried out after the secondary oil recovery. Somehow, EOR processes are also implemented as a primary production stage. The classification scheme of oil recovery clearly shown in Figure 1.1.
Gases used in EOR processes are hydrocarbon gases, CO2, nitrogen, and flue gases. A number of liquid chemicals are commonly used, including the polymer, surfactants, and hydrocarbon solvents. Thermal processes typically consist of the use of steam, hot water, or rely on the in-situ generation of thermal energy through oil combustion in the reservoir rock. Table, et al., 1997 listed down a detailed EOR method applying in the oil industries (see Table 1.1).
The selection of any EOR technique is really depended on the oil type, reservoir rock, formation type, reservoir temperature, as well as the oil saturation, and the history of the past operation (Green and Willhite, 1998). Carman (1956) provided comprehensive screening criteria for enhanced oil recovery methods as shown in Table 1.2.
Table 1.1 Methods of enhanced oil recovery (Taber et al., 1997)
EOR processes ideally consider on the overall displacement efficiency, including the microscopic and macroscopic displacement efficiencies. Microscopic displacement
Less than 30% of OOIP
Tertiary recovery (Enhanced oil recovery) Secondary recovery
Primary recovery
30-50% of OOIP (+20%) Up to 80% of OOIP (+50%)
Internal energy drive
Artificial lift
Water flooding
Pressure maintenance
Non-thermal:
Gas/Chemical liquids
Thermal:
Heat
Thermal methods Chemical methods Gas (and hydrocarbon solvent) methods In-situ combustion Alcohol-miscible solvent flooding " Inert" gas injection
Standard forward combution Micellar/polymer (surfactant) flooding Nitrogen injection
Wet combustion Low IFT waterflooding Flue gas injection
O2enriched combustion Alkaline flooding Hydrocarbon gas injection
Reverse combustin ASP flooding CO2flooding
Steam and hot-water injection Polymer floodng Hot-water flooding Gels for wate-shutoff
Steam stimulatin Microbial injection Stem flooding
Surface mining and extraction
-3-
relates to the displacement or mobilization of oil at the pore space and reflects the oil saturation. It is a measure of the effectiveness of the displacing fluid in moving the oil at where the displacing fluid contacts the oil. Macroscopic displacement efficiency concerns the sweep efficiency conformance of displacing fluids in contacting the reservoir volume.
It is a measure of effectiveness of the displacing fluid sweeps out the volume of a reservoir, both horizontally and vertically, as well as how effectively the displacing fluid moves the displaced oil toward the production wells.
Table 1.2 Summary of screening criteria for EOR methods(Carman, 1956)
Several physical/chemical interactions occur between the displacing fluids and oil that can improve the efficiency of microscopic displacement (low oil saturation). These phenomena are including the miscibility between the fluids, decreasing the interfacial tension (IFT) between fluids, oil volume expansion, and reducing oil viscosity.
Macroscopic displacement is improved by maintaining of favourable mobility ratios between all displacing and displaced fluids throughout the process (Green and Willhite, 1998).
EOR methodA2:J32
Oil properties Reservoir characteristics
Gravity
ºAPI Viscosity (cp) Composition Oil saturation
(%PV)
Formation type
Net thickness
(ft)
Average permeabilit
y (md)
Depth (ft) Temperatu re (ºF) Gas injection methods (misible)
Nitrogen >35 <0.4 High % of C3- C7
>40 Sandstone or carbonate
Thin unless
dipping N.C.2 >6000 N.C.
(& flue gas) 48 75
Hydrocarbon >23 <3 High % of C2- C7
>30 Sandstone or carbonate
Thin unless
dipping N.C. >4000 N.C.
41 0.5 80
Carbon dioxide >22
36
<10
1.5
High % of C6- C12
>20
55
Sandstone or carbonate
(Wide
range) N.C. >2500 N.C.
Chemical Micellar/-
polymer, Light,
intermedia.
Some organic acids for alkaline floods Alkaline/-
polymer >20 <35 >35 Sandstone
preferred N.C. >10450 <9000
3250 <200 80
(ASP), and 35 13 53
alkaline flooding
Polymer <15 <150,
N.C. >70 Sandstone
preferred N.C. >103800 <9000 <200 140
flooding <40 >10 80
Thermal
Combustion Some asphaltic
components
High porosity
sand/
Sandstone
<115003 500
>100 135
>10ä <5000 1200 >50 >10 >50s
16? 72
Steam
High porosity
sand/
sandstone
>8- <200000 N.C. >40 >20 >200s <4500 N.C.
13.5? 4700 66 1500
1. Underlined values represent the approximate mean or average for current filed projects, indicated higher value of parameter is better 2. N.C.=not critical
3. >S md from some carbonate reservoirs 4. Transmissibility >20 md ft/cp 5. Transmissibility >50 md ft/cp
-4-
The large density difference between displacing and displaced fluids might be advantaged by flooding in an up dip or down dip direction.
1.1.1 Microscopic Displacement of Fluids in a Reservoir
An important aspect of any EOR process is the effectiveness of process fluids in removing oil from the rock pore at the microscopic scale. Microscopic efficiency is mainly controlled by capillary and viscous forces governing phase trapping and mobilization of fluids in porous media. So the understanding of these forces is required to understand the recovery mechanism involved in the EOR process (Green and Willhite, 1998).
The forces related to phase trapping and mobilization in multiphase fluid system in porous media including the interfacial tension (IFT), rock wettability, and capillary pressure.
Surface Tension and Interfacial Tension, IFT:
IFT is the surface energy related to the fluid interfaces influence the saturation, distributions, and displacement of the phases when immiscible phases coexisted in a porous medium. The surface tension term refers to the surface energy between a liquid and its vapour or air. If the surface energy is between two different liquids, or between a liquid and a solid, so the term is the interfacial tension, IFT (Figure 1.3). IFT value, commonly encountered in water, hydrocarbon, water/hydrocarbon systems, and some water/ hydrocarbon /surfactant systems. IFT can be measured by using either ring tension- meter, spinning-drop, or the pendant-drop methods.
Figure 1.2 The concepts of surface and interfacial tension
A simplest way to measure the surface tension of a liquid is to use a capillary tube shown in Figure 1.3.
σ (1.1) where
r: capillary-tube radius, cm
-5- h: height of water rise in the capillary, cm ρw: water density, g/cm3
ρa: air density, g/cm3
g: gravity acceleration constant, 980 cm/s2
θ: contact angle between water and capillary tube.
Figure 1.3 Capillary measurement method (Abdallah et al., 2007)
In the porous media, fluid distribution is not only affected by the forces at fluid/fluid interfaces, but also by the forces at fluid/solid interfaces. Wettability is the tendency of a fluid to spread on or adhere to a solid surface in the presence of a second fluid in the porous media. When two immiscible phases are placed in contact with a solid surface, one phase usually is attracted to the solid more strongly than the other phase (Figure 1.4).
The more strongly attracted phase is called the wetting phase (Green and Willhite, 1998).
-6-
Figure 1.5 Effect of wettability on saturation (Abdallah, et al., 2007)
Rock wettability affects the nature of fluid saturation and the general relative permeability as mentioned in Figure 1.5.
The contact angle, θ, is used to measure the wettability. The solid is water-wet if θ<90°
and oil-wet if θ>90°. A contact angle closes to 0° indicates a strong water-wet and an angle closes to 180° means a strongly oil-wet (Green and Willhite, 1998). The details, angles with different wettability are shown in Table 1.3. (Zolotukhin and Ursin, 2000).
Table 1.3 Contact angle in different wettability (Zolotukhin and Ursin, 2000)
Capillary Pressure:
Capillary Pressure is a pressure difference existing across the interface (Abdallah et al., 2007; Green and Willhite, 1998). This pressure can be illustrated by the fluid rise in a capillary tube in Figure 2.3 and calculated by Eq. (1.2). The capillary pressure is related to the fluid/fluid IFT, the relative wettability of the fluids (through θ), and the size of capillary, r.
𝑃 (1.2)
where
Pc: capillary pressure (mN/cm2)
σow: IFT between water and oil (mN/cm) r: capillary tube radius (cm)
θ: contact angle (-) σow
σos θ σws
Oil
Rock Surface Water
Contact angle values Wettability prerference
0-30 Strongly water wet
30-90 Preferentially water wet
90 Neutral wettability
90-150 Preferentially oil wet
150-180 Strongley oil wet
Figure 1.4 Wettability and interfacial tension (Green and Willhite, 1998)
-7- Viscous Force:
Viscous forces in a porous medium are the magnitude of the pressure drop passing through the medium. It can be expressed by Darcy’s law (Green and Willhite, 1998).
∆𝑃 ∅ (1.3)
where
ΔP: pressure drop across the porous medium P2-P1 (Pa)
𝜈̅: average velocity of fluid in the pores of the porous medium (m/s) µ: fluid viscosity (Paꞏs) (1 mPaꞏs=1 cP or 1000cP=1Paꞏs)
L: length of the porous medium, (m).
ϕ: porosity of the porous medium (-)
k: permeability of reservoir (m2) (1 mD = 0.987-15 m2 or 1D = 0.987-12 m2) 1.1.2 Macroscopic Displacement Efficiency
Oil recovery in any displacement process relies on the volume of reservoir contacted by the injected fluid. Macroscopic displacement efficiency is the volume sweep efficiency, which is controlled by the areal and vertical sweep efficiencies (Green and Willhite, 1998).
The four main parameters affecting areal displacement efficiency are:
- Injection/production well pattern - Reservoir permeability heterogeneity - Mobility ratio
- Relative importance of gravity and viscous forces.
The factors effecting vertical displacement efficiency are following:
- Gravity segregation caused by differences in density - Mobility ratio
- Vertical to horizontal permeability variation - Capillary forces
Mobility Ratio:
The mobility ratio, M, is an extremely important parameter in any displacement process.
The oil displacement process is considered to have the mobility control if M 1. The sweep efficiency increases if M decreases. M also effects on the stability of a displacement
-8-
process, with flow becoming unstable/viscous fingering (non-uniform displacement front) when M >1 (Green and Willhite, 1998).
The mobility ration can be calculated by Eq. (1.4).
𝑀 (1.4)
where
λD: mobility of the injecting fluid phase such as surfactant solution (m2/(Paꞏs)) λd: mobility of the displaced fluid phase such as oil (m2/(Paꞏs))
The mobility of the fluid phase in porous media is given by Eq. (1.5).
𝜆 (1.5)
where
λi: mobility of the fluid phase
ki: effective permeability of phase i (m2) µi: fluid viscosity of phase i (Paꞏs)
Mobility control concept is applicable to the development of EOR process, especially for the fluid flow in the porous media.
Green & Willhite (1998) suggested that the important factor of macroscopic efficiency is better considered in the heterogeneous reservoir geology.
The implementation of EOR technique is always affected by reservoir geology and reservoir geologic heterogeneities. This factor can cause the unexpected losses of injected fluids or bypassing of fluids because of channelling in high permeability zones or fractures. Similarity, fluid movement may be very non-uniform because of heterogeneity of reservoir rock.
1.2 Previous Research and Problem Definitions 1.2.1 Oil Recovery from Heterogeneous Reservoirs
A heterogeneous reservoir is defined as a reservoir consisting of shift zone, high permeability layer and/or fractures (Green and Willhite, 1998, pp. 1–4). These features are one of the major problems during water-flooding recovery processes as far as the oil recovery is concerned. This is due to the injected water is produced through the high permeability zone (short-cut zone) leaving unsweep low permeability zone. On the other hand, carbon dioxide (CO2) leakage through the sealing potential of fractures and high
-9-
fault zone remains the main problem for carbon capture and storage (CCS) in the underground geological formation (Blackford et al., 2013; IPCC, 2005). Given the substantial volume of trapped oil within the low permeability zones or the need of a sealing agent, which prevents the CO2 gas leakage from the underground reservoir, a conformance improvement treatment is crucial for either process.
Conformance improvement, also referred as water shut off treatments, can be divided into mechanical and chemical methods, in which the former approach relies on horizontal and multi-lateral wells to increase contact reservoir zone, or liner and cement squeezes to block short-cut flow (Prada et al., 2000). Those mechanical techniques often failed, because water either leaks past the packing devices to outside of plugging zone (Hoefner, 1989). The latter approach, which is the scope of this study, uses a chemical solution to form gels in high permeability zones. Several methods have been investigated, with mitigated results, including phenol-formaldehyde resins, chemical precipitation, and inorganic gels (sodium silicate gels) and gelling polymer (Nasr-El-Din and Taylor, 2005).
Stahl and Schulz, 1988 studied the cross-linked polymer for water diversion and presented two methods to evaluate gel characteristics including beaker tests and gel evaluation. They concluded that both the gelation time, therein defined as the time at which viscosity starts to increase and the viscosity of the polymer are the main influencing parameters (Chou and Bae, 1994). It was further shown that water shut-off treatment using polymer as starting material is severely challenged by the heterogeneity of the candidate formation. In this regard, alternative approaches consisting of blending polymer with silica gel has been proposed (Bryant et al., 1996; Hamouda and Amiri, 2014; Hoefner, 1989; Jousset et al., 1990; Skrettingland et al., 2014; Stahl and Schulz, 1988; Sydansk and Argabright, 1988; Taylor and Nasr-El-Din, 2003). However, the details mechanisms and chemical analyses of this silicate gel are poorly understood on previous studies. It appears from the literature that in order to form the gel, a foreign material (gelling activator) is required, none of which are carbon dioxide (CO2).
1.2.2 Previous Gel Characterization
Stahl and Schulz (1988) conducted the laboratory evaluation of crosslinked polymer gel for water diversion and proposed two methods, beaker and core testing, for gel characterization and evaluation.
Beaker test:
-10- Gel time:
Gel time is arbitrarily defined as the time at which viscosity starts to increase or the time at which the apparent viscosity reach at a specific value (Green and Willhite, 1998). The time required for gelation to occur is an important design for gel placement. With gel system, chemicals are mixed at the surface and injected as a viscous solution to the underground formation. The solution is designed to react and gel at the designated time after being placed in the formation. Gel time is determined from the intercept of the extrapolations from the two straight line sections of a viscosity-versus-time curve as shown in Figure 1.6 (Green and Willhite, 1998; Stahl and Schulz, 1988). This concept is similar to what McDonald (2015) did by taking the gel time at highest viscosity.
For short gelation time, a Brookfield Viscometer is used for viscosity monitoring. But for long gel times, a ball viscometer is recommended because it is not efficient to continuously monitor the solution viscosity with the viscometer (Bookfield DVI) (Stahl and Schulz, 1988).
This method has been found to give reproducible results for gel time up to 10 days or more (Green and Willhite, 1998).
Figure 1.6 Gel time determination Gel Strength:
Gel strength is a variable related to process performance, but it is not defined precisely.
Methods of measurement based on the use of shear viscosity, dynamic viscosity, a penetrometer device, gel breakdown pressure, or visually observed flow characteristics have been proposed (Green and Willhite, 1998).
Gel time Time (hrs)
Apparent Viscosity (cP)
-11-
The term “gel strength” is being used as a general term to include both the gel’s yield pressure and its apparent viscosity as a function of pressure and its apparent viscosity as a function of shear rate (Meister, 1985).
Another approach is to monitor the value of storage modulus, G’. Lukach and Sun (1986) found that a strong gel has a storage modulus of approximately 100 dynes/cm2 and a weak gel refers to a storage modulus of approximately 10 dynes/cm2. A strong gel is a better candidate compared to weak gel for plugging a large fracture.
The simple bottle test can also be used in which the gel solution is observed when a bottle holding a gel is tilted in a specified way or inverted. The gel strength code of bottle test was provided by Sydansk & Argabright (1988) as illustrated in Table 1.4 and Figure 1.7.
Figure 1.7 Gel strength determination (Sydansk and Argabright, 1988) Table 1.4 Bottle test-gel strength code (Sydansk and Argabright, 1988)
Gel Stability:
A major cause of gel instability in polymer system is syneresis. Syneresis is defined as shrinkage of the gel by expelling out the liquid from a gel. It appears as a breaking up of the gel. The mechanism of syneresis is thought to be due to an over crosslinking of polymer (Bryant et al., 1996; Green and Willhite, 1998; Stahl and Schulz, 1988).
Type Definition
“A” No detectable gel formed.
“B” Highly flowing gel.
“C” Flowing gel.
“D” Moderate flowing gel.
“E” Barely flowing gel.
“F” Highly deformable non-flowing gel.
“G” Moderately deformable non-flowing gel.
“H” Slightly deformable non-flowing gel.
“I” Rigid gel.
“J” Ringing rigid gel.
-12-
Syneresis is commonly believed to be incompatible with the application of polymer gels to reduce the permeability of porous media (Bryant et al., 1996).
A simple measurement of gel syneresis is by visual observation. The volume of remaining gel is estimated and divided by the initial volume to give a percent syneresis.
By plotting of this percent syneresis versus aging time gives a visual stability curve (Stahl and Schulz, 1988).
Rheological Properties of Gel:
Gel generally exhibits viscous behaviour when it is placed in the porous media for plugging. Thus, the rheological properties of gel help to understand a lot about the gel characteristics and the effects of reservoir condition on it.
Rheological behaviours of fluids divided into Newtonian and non-Newtonian fluid. A Newtonian fluid has a linear relationship between shear stress and shear rate with the constant viscosity (Eq. 1.6), whereas non-Newtonian fluid has no linear relationship and viscosity depends on the shear rate. A non-Newtonian behaves as shear shinning (Figure 1.8). The viscosity of fluid decreases as the shear rate increases, and as shear thickening (Eq. 1.7). The polymer gel is typically non-Newtonian fluid in shear thinning (Green and Willhite, 1998; James Sheng, 2010; Stahl and Schulz, 1988).
𝜏 𝜇𝛾 (1.6)
𝜇 𝐾𝛾 (1.7)
where
τ : shear stress (Pa)
µ: solution viscosity (Paꞏs) (1 mPaꞏs=1 cP or 1000cP=1Paꞏs) 𝛾 : shear rate (s-1)
K: power law constant (Pa. sn) n: power law exponent
n<1 Pseudoplastic or shear-thinning fluid n=1 Newtonian fluid
n>1: Dilatant or shear-thickening fluid
-13-
The data can be correlated as function of polymer concentration in Eq. 1.7, n=1/(1+0.002C0.943), K=5.435+2.362×10⁻⁵C2.286 (Green and Willhite, 1998).
Figure 1.8 Rheology of a shear-thinning fluid (Green and Willhite, 1998)
The rheological behaviour of polymer gel is affected by shear rate, polymer concentration, temperature, salinity and divalent ion (Ca2+, Ma2+) (Green and Willhite, 1998; James Sheng, 2010).
Affecting Factors on Gel Properties:
There are many variables that can affect on the gelation time, gel strength and gel stability.
Those major effects are chemical concentration/properties, temperature, salinity, divalent ion, pH and shear rate (Green and Willhite, 1998; James Sheng, 2010; Stahl and Schulz, 1988). Stahl & Schulz (1988) found that the high molecular weight polymers have faster gel times and higher gel strengths than low molecular weight polymer.
- Effects of chemical concentration: gel strength increases with an increase in the polymer concentration. However, syneresis is promoted as well at high concentration.
- Effects of salinity: increasing the salinity of the solution reduces the gel time and decrease the gel strength in some cases. Sydansk & Argabright (1988) reported that the gel time of polyacrylamide is faster with increasing salinity at low salt concentration, but it is slower with increasing salinity at high salt concentration.
Salinity also affects gel stability, and gels syneresis can occur at very low and very high salt concentration (Green and Willhite, 1998).
- Effects of shear rate: normally the apparent viscosity decreases as the shear rate increases, hence the shear thinning of rheological characteristics is due to the reduction of internal friction of molecules (Green and Willhite, 1998).
-14-
- Effects of temperature: the redox-reaction process relies on the temperature.
Normally gel time is shorter at high temperature. The increasing in temperature promoted the intensive syneresis (Green and Willhite, 1998).
Core Testing
The second evaluation program tests the performance of gels under simulated flow conditions in reservoir core samples. In this section, the core sample must be an actual reservoir core sample or generic rock like Berea sandstone. There are two types of apparatus for the routine core testing (Stahl and Schulz, 1988).
- A core screening panel is designed for the rapid evaluation of gel system in the core. This step, only the total pressure drop across the core is measured.
- The second core test apparatus is designed for more detailed tests, such as injectivity/retention tests, gel placement evaluation, and gel stability tests under flowing condition.
1.2.3 Alkaline Flooding Using S-MS Solution
Sodium-metasilicate, hereinafter S-MS, is commonly used as powder detergents and industrial applications (PQ Corporation, 2015; SILMACO, 2016). They contain an optimum portion of alkali and soluble silica, which made S-MS a suitable gel precursor (Hamouda and Amiri, 2014; McDonald, 2012; Vinot et al., 1989). Injected in an oil- bearing matrix, S-MS solution, whose viscosity is similar to that of water; is suitable for formation areas located at long distance from the injector (Lakatos et al., 2009;
Skrettingland et al., 2012). However, the solution should be thermally stable in high temperature reservoirs, and its gelation time also controllable at the same conditions ( Amiri et al., 2014). Furthermore, S-MS is inorganic and do not present hazards such as low flash or flammability. Because of the alkali content that alter the interfacial tension of the trapped oil, S-MS solution has a long history as an alkaline flooding agent for light/medium/heavy oil formations (Chang and Wasan, 1980; James Sheng, 2010;
Krumrine et al., 1985; Larrondo and Urness, 1985; Martin and Oxley, 1985).
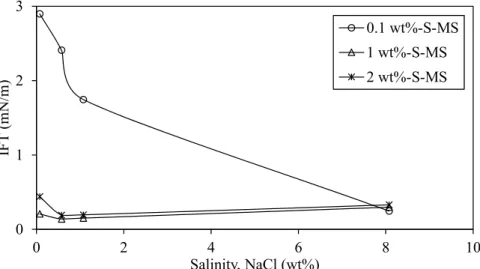
Larrondo et al. (1985) conducted the experiment on the effect of salinity (0.075-8.075 wt% of NaCl) on the IFT of wellhead oil and sodium metasilicate solutions (0.1-2 wt%).
They reported that at the alkali concentrations greater than 1 wt% of S-MS solutions showed the minimum IFT value in orthosillicate solution and sodium hydroxide solutions.
As S-MS concentration increased, IFT value tended to decrease, but as the sodium
-15-
chloride concentration, the IFT value also decreased and slightly increased at the high salinity case (Figure 1.9).
Figure 1.9 Effect of S-MS solution and salinity on the IFT (Larrondo and Urness, 1985) The W/O emulsification was usually observed in the alkaline floodings. The role of forming W/O emulsification was discussed by Pei et al. (2013).
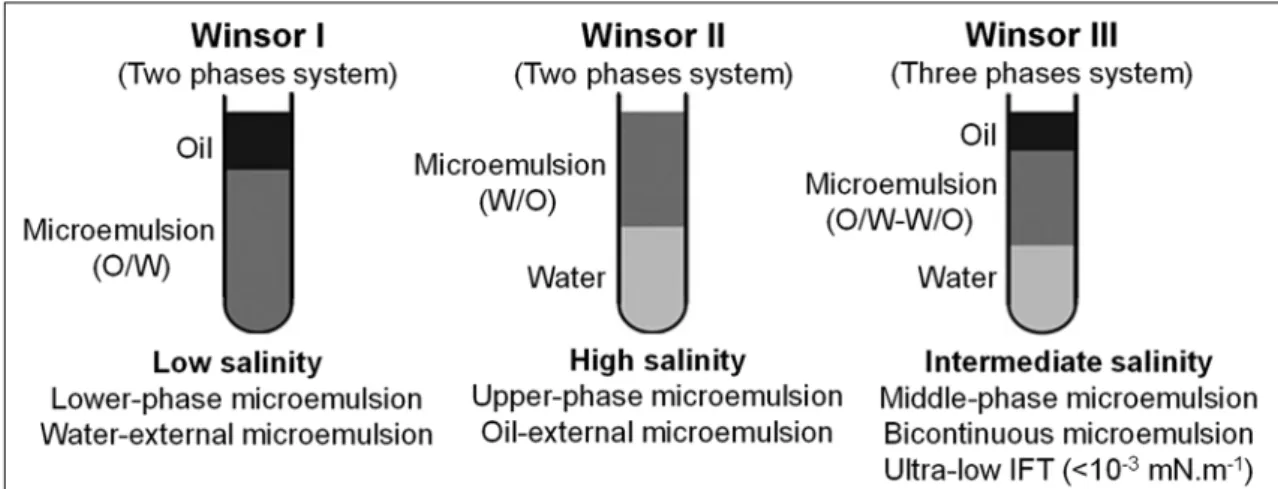
1.2.4 Effect of Salinity on Microemulsion Formed from Oil and S-MS Solution The pipette test was undertaken to investigate phase behaviour. As shown in Figure 1.10, the microemulsion types were classified to Winsor I (Lower-phase microemulsion), Winsor II (Middle-phase microemulsion) and Winsor III (Upper-phase microemulsion).
Sheng (2011) used the term O/W, bicontinous (O/W-W/O), and W/O microemulsions to describe water-external (Winter I), bicontinuous (Winter III), and oil-external (Winsor II).
Generally, W/O emulsion is generated at low water/oil ratio (WOR), whereas O/W emulsion are formed at higher WOR.
The effect of salinity in the S-MS solution was also investigated by observing the phase behaviour of the microemulsion. In this study, it was focused to find the optimal salinity to form stable microemulsion which shows type Winsor III and low IFT (<10-3 mN.m-1) (James J. Sheng, 2011).
0 1 2 3
0 2 4 6 8 10
IFT (mN/m)
Salinity, NaCl (wt%)
0.1 wt%-S-MS 1 wt%-S-MS 2 wt%-S-MS
-16-
Figure 1.10 Three types of phase behavior system and the effect of salinity on phase behavior (Sheng, 2011)
By the reaction of alkaline solution with crude oil in a reservoir, the in-situ generated soaps (surfactants) facilitate the formation of both O/W and W/O emulsions with the help of low IFT, and the mobility ration improves displacing and displaced fluids. The flow of these two types of microemulsion induces the mechanism to enhance oil recovery by alkaline flooding (Ding et al., 2010; Green and Willhite, 1998; Sheng, 2011; Pei et al., 2013). In the low salinity solution, oil-in-water (O/W) emulsion was formed with the oil droplet particles smaller diameters than the pore throat size owing the low IFT by the alkaline flooding. Meanwhile in the high salinity, water-in-oil (W/O) emulsion was generated by in-situ formed soap in the reservoir. The water droplets in W/O emulsion break easily and coalesce to become larger particles during moving through the pores, so the oil mobility was improved by reducing apparent viscosity with decreasing water droplets (Green and Willhite, 1998; Sheng, 2011; Pei et al., 2013).
The effect of temperature on the stability of microemulsion was reported by Bera et al, (2012). They showed that the type of Winsor I of emulsion phase behaviour was observed at low salinity and low temperature, while the phase changes to the type of Winsor III as the temperature increases above 42ºC, and the type of Winsor II in the system at the high salinity and low temperature. As temperature increases, the type of Winsor II start to generate. At moderate salinity near the optimal salinity, the middle phase microemulsion is very stable compared to other salinities. However, the volume of middle phase microemulsion decreases with increasing of temperature. But the change is no so high due to the high stability of microemulsion around the optimal salinity (Bera et al., 2012).
Using S-MS for conformance has been extensively studied. Taylor and Nasr-El-Din (2003a) stated that the silica gel formed when the S-MS solution is acidified to a pH value lesser than 10, however the challenge therein reported was controlling the gelation time
-17-
(McDonald, 2012; Kevin C. Taylor and Nasr-El-Din, 2003). In the field treatment, S-MS can form silicate gels using precursors or activators such as organic acid, urea, multivalent cation (Krumrine and Boyce, 1985; Nasr-El-Din and Taylor, 2005). Aforementioned precursors intend to lower the acidity of the solution to promote the formation of gel.
Young and Blankenhorn, 1972 reviewed potential gelling activators among CO2, hydrogen chloride (HCl) and amides. CO2 is easy to handle and to adjust, because it can be injected into a well and spread in a reservoir due to its higher relative permeability compared to that of liquid fluids. Moreover, using captured CO2 as precursor is also an alternative approach for carbon sequestration.
On the basis of S-MS solution features discussed above, it is rational to think that it can be used for a dual purpose, including blocking channelling passes in the reservoir and chemical agent for alkaline flooding (Figure 1.11).
Both functions could subsequently enhance oil recovery given that S-MS solution remaining after alkaline flooding could become the starting material for the channel plugging. In theory, S-MS solution is injected as the alkaline flooding agent into the formation. The oil is produced from high permeable zones. At the water breakthrough, CO2 is injected and the reservoir is shut-in. An in-situ gelation is then expected, which would plug short-cut passes, reducing thereby the permeability. As a result, the sweep efficiency, the oil recovery, is improved. It is worth pointing that this production scheme would be also altered the parameters, which influence the oil recovery by alkaline flooding (hard formation brine) or the gel formation (hard formation brine/high temperature) (Kristensen et al., 1995; Mayer et al., 1983; Skrettingland et al., 2014).
Therefore, the scope of this work, which is a preliminary study, aims to prepare, to characterize and to evaluate the potential of the in-situ gel as plugging/binding agent in heterogeneous reservoirs. An aqueous S-MS solution is used as starting material and CO2
as precursor. To unveil the mechanisms of gel formation, both physical and chemical analyses were considered. The permeability tests were further performed to validate the in-situ gel formation in porous media. The effect of in-situ gel performance in the heterogeneous reservoir for enhanced oil recovery was investigated and evaluated through the heterogeneous Berea sandstone core flooding.
-18-
Figure 1.11 Conceptual oil recovery process in heterogeneous reservoir 1.3 Objectives
This research principally aims to characterize and evaluate the potential of the in-situ gel as blocking agent in heterogeneous reservoirs for enhanced oil recovery (EOR). The details of each objective are listed as follows:
To screen, characterize and evaluate a potential of the in-situ gel as blocking agent in high permeability zones forming by the reaction between the sodium metasilicate solution as gelling solution, and dissolved CO2 gas as precursor.
To investigate the effect of sodium metasilicate solution on IFT reduction, wettability alteration, and emulsification as alkaline flooding agent for improving the oil recovery in the high permeability zones.
To investigate the effects of in-situ gel as blocking agent in heterogeneous reservoir for enhanced oil recovery by using the heterogeneous Berea sandstone core.
1.4 Outline of Dissertation
The dissertation is compiled of six chapters according to the research objectives. The brief explanation of each chapter is in following:
Chapter 1 introduces about the oil recovery mechanism from primary to tertiary process, the approach of enhanced oil recovery method, its challenges in heterogeneous reservoir,
-19-
and the objectives of this present research. The approach of enhanced oil recovery method was highlighted comprehensively in this chapter for both megascopic and microscopic oil displacement efficiency.
Chapter 2 overviews the experimental research process with an overview of qualitative and quantitative methods, data collection, recording and analysis. It also presents the materials, such as crude oil and chemicals, used in gel formation coreflooding experiments and interfacial tension measurement (IFT) between oil and the water solutions including the experimental setups measurement instrument. Furthermore, Raman spectroscopy and scanning electron microscopy/energy dispersive x-ray (SEM- EDS) spectroscopy that were used to analyse molecular compounds and chemical characterization of the gel formed in the experiments is explained. The sandstone core was used to measure the threshold pressure gradient (TPG) after in-situ forming SC-gel in it. The cylindrical heterogeneous core (43.4 mm in diameter and 72.2 mm in length) was constructed by combining two semi-cylindrical Berea sandstone cores with different permeability (300 and 50 mD). It was used for coreflooding test after injecting saline water and the Japanese light crude oil (JLO-I) into the core to evaluate the blocking effect in the heterogeneous reservoir.
Chapter 3 explains about the in-situ gel screening, characterization and evaluation as blocking performance in high permeability zones by using the sodium metasilicate (Na2SiO3ꞏ9H2O; S-MS) as the gelling solution and dissolved CO2 gas as a precursor. The experiments were carried out to characterize and evaluate the gel system based on the chemical and physical analysis by changing of sodium metasilicate solutions (1-10 wt%), CO2 gas pressure (subcritical to supercritical condition), temperature (25-80ºC), salinities (NaCl, 0.1-10 wt%) and divalent ion (Ca2+, 10-10000 ppm). Raman and scanning electron microscopy/energy dispersive x-ray (SEM-EDS) spectroscopy were used to determine the surface morphology, elemental composition, and structure of the gels. The physical characterization method was focused on the gel time, gel strength, and thermal stability of the gel. Firstly, the in-situ gel samples were prepared and formed in the high pressure cell by injecting the rang of CO2 gas pressure (2-5.5 MPa) into 45 mL of different S-MS solution concentrations (1-10 wt%) at temperature of 25°C. Gel samples were taken in every shut-in time for the measurement of physical properties (pH, density), apparent viscosity (Brookfield DV-I Prime), flowing behaviour of gel (gel strength code), and the volume change of the gel under various temperature of 25°C, 55°C and 80°C (thermal stability of the gel). The baseline concentration of S-MS solution was selected for the
-20-
detailed investigation of the effect of supercritical CO2 injection, salinity (NaCl), divalent ion (Ca2+), and crude oil interaction with the gel property, as well as the gel behaviour in the porous media. The effect of in-situ gel as blocking performance was evaluated by the measurement of air flowing permeability and threshold pressure gradient (TPG) using Berea sandstone saturated with the in-situ gel.
Chapter 4 evaluates the effect of in-situ SC-gel as blocking performance in heterogeneous reservoir for enhanced oil recovery. The effect of on IFT reduction, wettability alteration and emulsification, as alkaline flooding agent for improving the residual oil recovery remaining in the high permeability zone was also investigated in this chapter. IFT and contact angle measurement were carried out by using a surface tension-meter (DropMaster DMS-401) for S-MS solution (0.01-0.2 wt%) and Japanese light/heavy crude oil. The phase behaviour test was conducted for emulsification investigation, including the phase system, emulsion type and stability of emulsion by using S-MS solutions (0.5-2 wt%), Japanese crude oil, and different salinities (0.1-10 wt% of NaCl), under the temperature of 55ºC. S-MS solution has two functions as an alkaline flooding agent and base fluid to form SC-gel with CO2 gas as a blocking agent. Two half Berea sandstone cores fully saturated by Japanese light oil (JLO) was combined together to make a cylindrical heterogeneous sandstone core consisting of two different permeability zones and a thin fracture at the contacting interface of both half core. This cylindrical heterogeneous sandstone core was used for the coreflooding test that was carried out to evaluate the effect of in-situ formed SC-gel formation as blocking agent in the high permeability zones to recover oil from low permeability zone. After mounting the core into the core holder, the heterogeneous core was prepared by injecting 1PV oil (JLO) at 0.1 mL/min to be oil saturation is 1 including the fracture zone. The fluid injection scheme in the coreflooding test was designed as follows: (1) water flooding (2 wt% of NaCl concentration) at the same flow rate until produced oil became 0 (for around 6.5 PV), (2) alkaline flooding by injecting S-MS1wt%-solution at 0.1 mL/min for 0.5 PV, (3) injecting S-MS 5wt%-solution at the same flow rate for 0.3 PV as the base solution for in-situ formation of SC-gel, (4) CO2 gas injection at 2 MPa during 10s from the cell (75 mL), (5) shut-in the core for in-situ gel formation during 2 days, (6) Second water flooding at 0.1 mL/min for 2 PV to produce extra oil from the core. Therefore, the effect of in-situ formed gel as blocking agent on the enhanced oil production process was investigated.
During the coreflooding test, pH, pressure difference, oil and water production volume were monitored since from early stage of water flooding.
-21-
Chapter 2: Experimental Research Process
2.1 Introduction
Many researches have been conducted to study about the conformance the water-shut off by using the polymer and silica based gel in this decade. Those studies provided a lot of concepts for gelation characterization and evaluation.
Gelation time, gel strength, and long term gel stability are the gel properties that describe the gelation (Green and Willhite, 1998). Stahl and Schulz (1988) conducted the laboratory evaluation of crosslinked polymer gel for water diversion and gave two methods for gel characterization and evaluation. First, the beaker tests are conducted over a range of conditions to determine the gel time, gel strength, and gel stability, which are related to the placement, the magnitude of permeability reduction and the long life of gel treatment. At this point, the most favourable system is selected for the further testing.
Second the gel evaluation is continued with more complex flow tests in reservoir core samples. The core tests are the best indicators available under the potential reservoir performance with the prior selected gel system and are used to make the final selection of gel system for field testing. Green and Willhite (1998) also agreed with this concept.
The beaker test is used to determine the gel time, gel strength and gel stability. Stahl &
Schulz (1988) suggested to make a simple screening test and to consider about the time consuming due to the complex process of gelation affected by many variables.
2.2 Materials and Methods of Gel Characterization and Evaluation of Present Research
2.2.1 Materials
A various concentrations of S-MS solution (1-10 wt%) was used as the starting material reacting with the dissolved CO2 (99.9 % of purity) as a precursor for the in-situ gel formation. A lyophilized powder of sodium metasillicate nonahydrate (Na2SiO3.9H2O, S- MS), supplied by Junsei Chemicals (Japan), was diluted with the distilled water for the solution preparation. To investigate the effects of salinity and the water hardness on the gel formation, different solutions of sodium chloride (0.1-10 wt% of NaCl) and calcium chloride (10-10000 ppm of CaCl2) were used. Both salts were purchased from Junsei Chemicals (Japan) and used as received.