九州大学学術情報リポジトリ
Kyushu University Institutional Repository
Effects of Short-Term Exposure to Hand-Arm Vibration on Physiological Responses and Hand Functions
レヴィリア, ホセファ, アンジェリー, ヂィリア
http://hdl.handle.net/2324/4110515
出版情報:九州大学, 2020, 博士(工学), 課程博士 バージョン:
権利関係:
Effects of Short-Term Exposure to Hand-Arm Vibration on Physiological Responses
and Hand Functions
REVILLA, JOSEFA ANGELIE D.
Effects of Short-Term Exposure to Hand-Arm Vibration on Physiological Responses
and Hand Functions
短時間の手腕振動暴露が生理応答および手機能に及ぼす影響
September 2020
REVILLA, JOSEFA ANGELIE D.
Acknowledgement
First and foremost, I would like to express my sincerest gratitude to my advisor, Professor Satoshi Muraki, for his unwavering support all throughout my doctoral study in Kyushu University. I would like to thank Professor Muraki for giving me the opportunity to be part of his laboratory, for his time and patience during my experiment and manuscript writing, and for his invaluable contribution to my dissertation.
Secondly, I would like to thank Professor Ping Yeap Loh and all the members of the Laboratory of Ergonomics for All Ages and Abilities for the advice and support while I was doing my experiment. In addition, I would like to extend my gratitude to the Japanese Government for the MEXT scholarship that supported my doctoral study.
Thirdly, I would like to extend my appreciation to the faculty members and administrative staffs of the Department of Industrial Engineering, University of the Philippines, Los Baños for the trust and encouragement.
Finally, I would like to thank my family, friends, loved ones, and the Almighty God for being my constant source of inspiration and strength.
Thank you for being with me throughout my doctoral study.
Table of Contents
Page
Acknowledgement i
Table of Contents ii
List of Tables vi
List of Figures vii
List of Abbreviations x
List of Publication xi
Abstract xii
Chapter 1. General Introduction 1
1.1 Vibration in the workplace 2
1.2 Whole-body vibration 3
1.3 Hand-arm vibration 4
1.4 Hand-arm transmitted vibration 5
1.5 Hand-arm vibration syndrome 7
1.6 Immediate effects of short-term exposure to HAV 10
1.7 Hand tractor in the Philippines 11
1.8 General objectives and research plan 13
1.9 Structure of the dissertation 15
Chapter 2. Exploratory Study on the Impacts of Handle Vibration
on the Hand and Forearm 17
2.1 Introduction 18
2.2 Methods 20
2.2.1 Participants 20
2.2.2 Vibration source 20
2.2.3 Experiment procedure 21
2.2.4 Measurements 23
2.2.5 Statistical analysis 25
2.3 Results 26
2.3.1 Post-task hand performance tests 26
2.3.2 Post-task subjective discomfort rating 27 2.3.3 Responses of forearm muscles during grip strength test,
NV task, and V task 27
2.4 Discussion 29
2.4.1 Effects on hand performance 29
2.4.2 Effects on subjective discomfort rating 31 2.4.3 Effects on forearm muscle activities 32
2.4.4 Limitations of the study 33
2.5 Conclusion 34
Chapter 3. Early Effects of Short-Term Vibration and Sustained
Grip on the Hand and Forearm 35
3.1 Introduction 36
3.2 Methods 38
3.2.1 Participants 38
3.2.2 Vibration source 38
3.2.3 Experiment procedure 38
3.2.4 Experiment design 40
3.2.5 Measurements 40
3.2.6 Statistical analysis 44
3.3 Results 45
3.3.1 Hand performance tests 45
3.3.2 Heart rate 46
3.3.3 Subjective discomfort rating 46
3.3.4 Forearm muscle activities 46
3.4 Discussion 48
3.4.1 Effects on fundamental hand functions 48
3.4.2 Effects on heart rate 51
3.4.3 Effects on upper limb discomfort 52 3.4.4 Effects on forearm muscle activities 53
3.4.5 Limitations of the study 55
3.5 Conclusion 56
Chapter 4. Effects of Two Forearm Postures and Grip Force Levels
during Handle Vibration 57
4.1 Introduction 58
4.2 Methods 60
4.2.1 Participants 60
4.2.2 Vibration source 60
4.2.3 Experiment procedure 60
4.2.4 Experiment design 61
4.2.5 Measurements 62
4.2.6 Statistical analysis 65
4.3 Results 66
4.3.1 Transmitted vibration 66
4.3.2 Grip strength reduction 70
4.3.3 Subjective discomfort rating 71
4.3.4 Forearm muscle activities 72
4.4 Discussion 74
4.4.1 Influence of resonant frequency, grip force level, and forearm posture on the vibration transmitted to the wrist
and elbow 74
4.4.2 Potential effects of forearm posture, grip force level, and
vibration exposure time on upper limb fatigue 76 4.4.3 Implications of integrating handle vibration, intense force
exertion, and awkward posture 79
4.4.4 Limitations of the study 80
4.5 Conclusion 81
Chapter 5. Effects of Various Handle Shapes and Surface Profiles
during Vibration Exposure 82
5.1 Introduction 83
5.2 Methods 86
5.2.1 Participants 86
5.2.2 Vibration source 86
5.2.3 Handle grip designs 87
5.2.4 Experiment procedure 87
5.2.5 Experiment design 88
5.2.6 Measurements 89
5.2.7 Statistical analysis 92
5.3 Results 93
5.3.1 Transmitted vibration 93
5.3.2 Grip strength reduction 95
5.3.3 Two-point discrimination test for finger sensitivity 95
5.3.4 Subjective ratings 96
5.3.5 Forearm muscle activities 98
5.4 Discussion 100
5.4.1 Effects of implementing a handle grip 100
5.4.2 Effects of handle shape 101
5.4.3 Effects of handle surface profile 102 5.4.4 Implications of implementing various handle shapes and
surface profiles during exposure to vibration, sustained
moderate grip force, and awkward arm posture 104
5.4.5 Limitations of the study 105
5.5 Conclusion 106
Chapter 6. General Discussion and Conclusion 107
6.1 Summary 108
6.2 Implications 111
6.2.1 Effects of handle vibration 111
6.2.2 Effects of grip force level 112
6.2.3 Effects of forearm posture 113
6.2.4 Effects of handle grip design 114
6.2.5 Summary of findings 116
6.3 General recommendation 118
6.4 Limitations and future studies 119
6.5 Conclusion 120
References 121
List of Tables
Page Table 2.1. Hand anthropometric data of the participants (mean ± SD). 20 Table 2.2. Finger dexterity and pinch strength comparison (mean ± SD)
(n = 7). 26
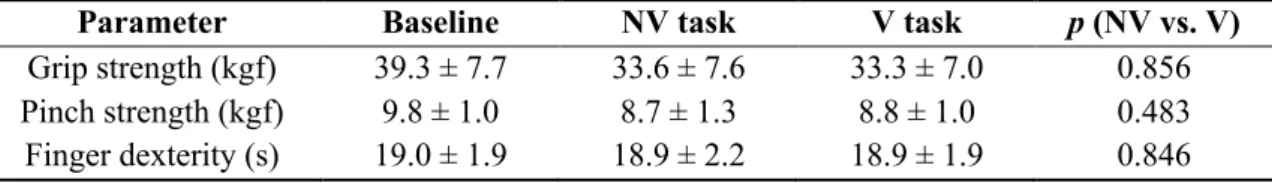
Table 2.3. Finger sensitivity comparison (in mm, mean ± SD) (n = 7). 26 Table 3.1. Comparison between post NV and V task grip strength, pinch
strength, and finger dexterity values (mean ± SD) (n = 14). 45 Table 3.2. Comparison between post NV and V task perceived two-point
distances (mean ± SD) (* p < 0.05; # p < 0.10; n = 14). 45 Table 4.1. Average peak total vibration acceleration (in m/s2) measured at
baseline and on the handle, wrist, and elbow of 16 participants
within the three major frequency bands. 68 Table 4.2. Mean percentage of vibration transmitted to various
measurement locations. 68
Table 5.1. Dimensions (in mm) of the handle grip designs examined in this
study. 87
Table 5.2. Average peak total vibration acceleration (in m/s2) measured at baseline and on the hand and wrist of 14 participants within the
three major frequency bands. 93
Table 5.3. Mean percentage of vibration transmitted to the hand and wrist. 94
List of Figures
Page Figure 1.1. Measurement of vibration acceleration on the engine, wrist, elbow,
and shoulder during actual hand tractor operation. 12 Figure 2.1. Experiment set-up of the preliminary study: (a) vibration source and
(b) front view and (c) semi-side view of the hand-arm posture during
task performance. 22
Figure 2.2. Task flow of the preliminary experiment. 22 Figure 2.3. Discomfort rating comparison (* p < 0.05). 27 Figure 2.4. Forearm muscle activities during grip strength test (* p < 0.05). 27 Figure 2.5. Forearm muscle activities during the tasks. 28 Figure 2.6. Illustration of the wrist in a (a) flexed and (b) slightly ulnar
deviated posture during task performance. 30
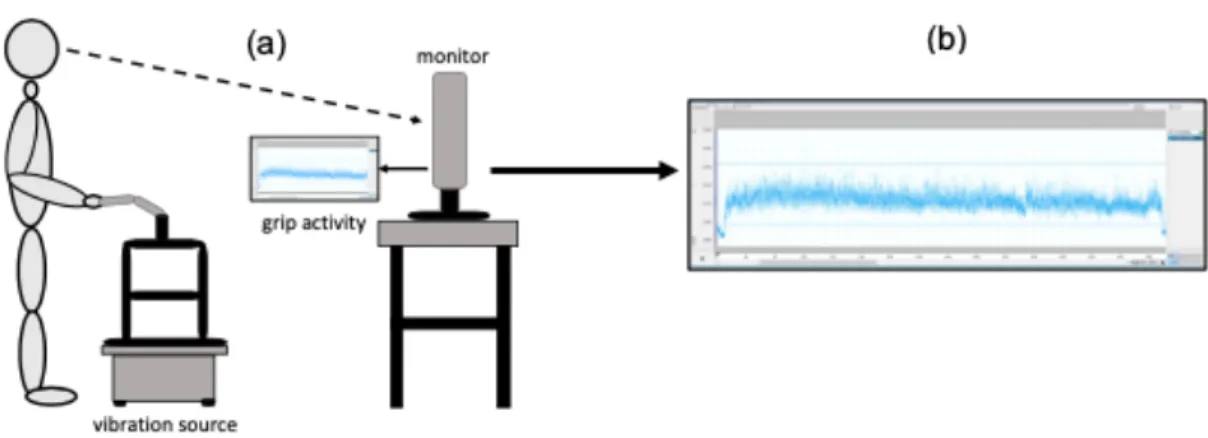
Figure 3.1. Experiment set-up of the first study: (a) schematic diagram of the task performance and (b) a sample target window for monitoring
grip exertion. 39
Figure 3.2. Comparison between post NV and V task subjective discomfort
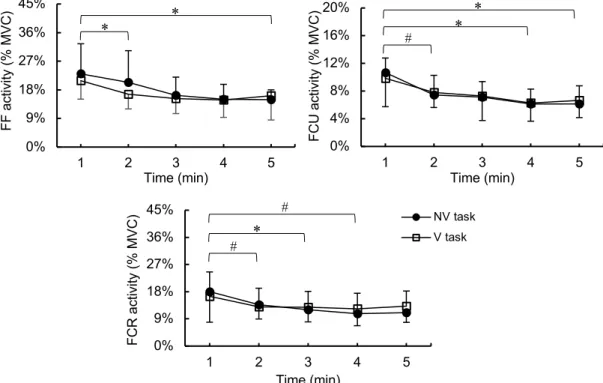
ratings (* p < 0.05; # p < 0.10; n = 14). 46 Figure 3.3. A time plot of ECR activity during NV and V tasks. 47 Figure 3.4. A time plot of forearm muscle activities during NV and V tasks
(* p < 0.05; # p < 0.10). 47
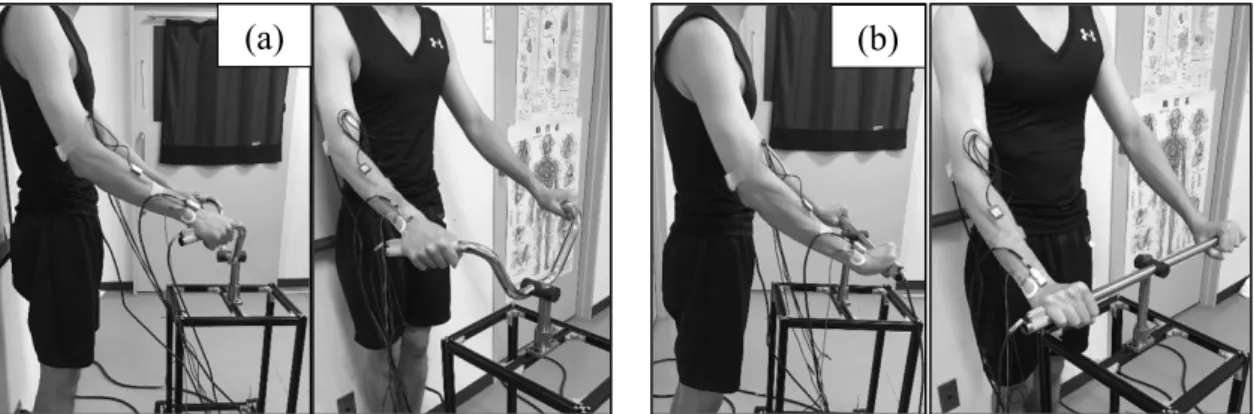
Figure 4.1. Experiment set-up of the second study: demonstration of a
(a) neutral forearm and (b) pronated forearm with elbow and upper
arm angles of 120°–160° and 10°–40°. 61
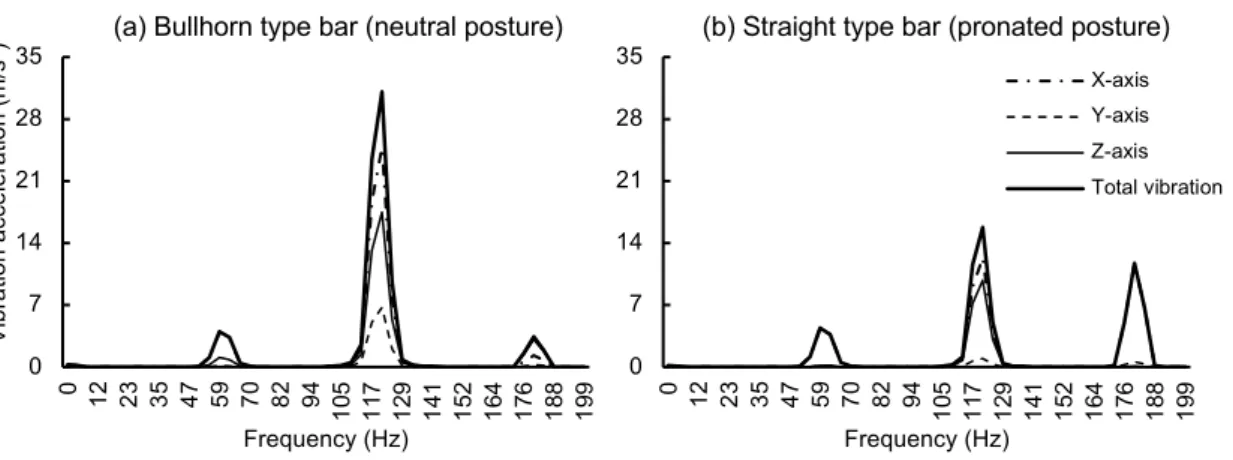
Figure 4.2. Frequency spectra of the baseline vibration value with peak accelerations present within three frequency bands: (1) 58~63,
(2) 117~124, and (3) 177~182 Hz. 62 Figure 4.3. Frequency spectra of the total vibration acceleration measured on
the handle. 66
Figure 4.4. Frequency spectra of the total vibration acceleration measured on
the wrist. 67
Figure 4.5. Frequency spectra of the total vibration acceleration measured on
the elbow. 67
Figure 4.6. Illustration of the mean percentage of vibration transmitted to
various measurement locations during each task condition. 69 Figure 4.7. A time plot of the mean percentage of vibration transmitted to the
(a) wrist and (b) elbow during a 5-min handle vibration exposure. 70 Figure 4.8. Mean percentage of grip strength reduction after performing each
condition (* p < 0.05). 70
Figure 4.9. Mean subjective discomfort ratings on the upper limb after
performing each condition (** p < 0.01; * p < 0.05; n = 16). 71 Figure 4.10. A time plot of ECR activity on each condition during a 5-min
handle vibration exposure. 72
Figure 4.11. A time plot of forearm muscle activities on each condition during
a 5-min handle vibration exposure. 73
Figure 5.1. Experiment set-up of the third study: (a) vibration source and (b)
hand-arm posture during task performance. 86
Figure 5.2. Illustration of smooth and patterned surface profile for: (a)
circular, (b) double-frustum, and (c) elliptic-shaped handles. 87 Figure 5.3. Baseline vibration frequency spectrum with peak accelerations
present within three major frequency bands: (1) 58~63,
(2) 117~124, and (3) 177~182 Hz. 89 Figure 5.4. Illustration of the mean percentage of vibration transmitted to the
hand and wrist: (a) comparison between none and with circular- shaped handle and (b) - (c) effect of various shapes and surface
profiles (** p < 0.01). 94
Figure 5.5. Mean percentage of grip strength reduction on various handle
shapes and surface profiles (# p < 0.10). 95 Figure 5.6. Mean perceived two-point distance on various shapes and surface
profiles: (a) comparison between none and with circular-shaped handle and effect on the (b) ring finger and (c) small finger
sensitivity (** p < 0.01; n = 14). 96
Figure 5.7. Mean subjective discomfort ratings on various shapes and surface profiles: (a) comparison between none and with circular-shaped handle and effect on the (b) fingers and (c) hand perceived
discomfort (* p < 0.05; # p < 0.10; n = 14). 97 Figure 5.8. Mean grip comfort rating: (a) comparison between none and with
circular-shaped handle and (b) effect of various shapes and
surface profiles (**p < 0.01; n = 14). 97
Figure 5.9. Mean ECR activity: (a) comparison between none and with circular-shaped handle and (b) effect of various shapes and
surface profiles. 98
Figure 5.10. Mean forearm muscle activities: (a) comparison between none and with circular-shaped handle and (b) effect of various shapes
and surface profiles. 99
Figure 6.1. Illustration of the hand and handle contact area on: (a) circular, (b)
double-frustum, and (c) elliptic-shaped handles. 115 Figure 6.2. Relevant findings contributing to the progression of HAVS, based
on grip force level and forearm posture, from least (Q I and II) to
most impactful (Q VI). 116
Figure 6.3. Major implications of the relevant findings on the development of
HAVS. 117
List of Abbreviations
ANOVA Analysis of variance EAV Exposure action value ECR Extensor carpi radialis ELV Exposure limit value EMG Electromyography FCR Flexor carpi radialis FCU Flexor carpi ulnaris FF Finger flexors HAV Hand-arm vibration
HAVS Hand-arm vibration syndrome HTV Hand transmitted vibration MVC Maximum voluntary contraction WBV Whole-body vibration
List of Publication
Chapter 2
Josefa Angelie D. Revilla, Ping Yeap Loh, & Satoshi Muraki. (2019). Exploratory study on the impacts of handle vibration on the hand and forearm. Industrial Engineering &
Management Systems, 18(4), 591–599. doi: 10.7232/iems.2019.18.4.591
Abstract
Hand-guided powered equipment is a common source of occupational hand-arm vibration (HAV). In the Philippines, a hand tractor has been found to transmit excessive level of vibration to the farmers. Extended exposure to such vibration can have serious and permanent effects on fundamental hand and arm functions commonly known as the hand-arm vibration syndrome (HAVS). The general objective of this dissertation is to provide new and holistic insights on the physiological stress caused by the cumulative effects of HAV, sustained grip force levels, and two forearm postures commonly applied when operating a dual-handle guided equipment. The main objectives are to characterize the effects on physiological responses and hand functions of short-term HAV: (1) with unmonitored and self-imposed grip force and neutral forearm, (2) with sustained moderate grip force and neutral forearm, and (3) with mild and hard grip forces on two forearm postures. The final objective is to determine the influence of implementing various handle shapes and surface profiles on reducing the harmful effects of HAV.
A preliminary study exploring short-term HAV with unmonitored and self- imposed grip force demonstrated declined forearm muscle activities during grip strength test and higher shoulder discomfort. Nonetheless, to clearly determine the distinctive contribution of vibration, grip level, and posture, the succeeding studies monitored and imposed constant force exertion and forearm posture for each task duration. The first study found that 5-min vibration exposure with sustained moderate grip and neutral forearm leads to temporary reduction of middle finger sensitivity, hand-arm discomfort, and reduced ability to grip consistently. The second study discovered that the cumulative effects of consistently gripping hard on pronated forearm instigates higher wrist transmitted vibration, higher proximal arm discomfort, and lower finger flexors activity through time than hard grip on neutral forearm or mild grip on either forearm posture.
Finally, the third study demonstrated that circular and double-frustum handles prompt lower transmissibility and lower grip strength reduction than elliptic handle, while patterned surface profile on elliptic-shaped reduces ring and small finger sensitivity, increases hand area discomfort, and decreases grip comfort.
These findings imply that: (1) short-term HAV exposure can stimulate the onset of peripheral neuropathy and musculoskeletal disorders that may result to temporary grip impairment, (2) grip force level can directly influence the progression of HAVS seen on reduced grip strength and increased upper limb discomfort, (3) poor forearm posture combined with forceful movement can instigate early development of upper limb musculoskeletal injuries, and (4) handle shape can influence vibration transmissibility and force exertion while surface profile can affect sensation and comfort. In conclusion, the development of HAVS can be controlled through preventing intense force exertion even during short-term HAV exposure, consideration of appropriate forearm posture in cases that require forceful hand-arm movements, and implementation of smooth-textured handle grip that reduces the hand and handle contact stress.
Chapter 1. General Introduction
1.1 Vibration in the workplace
In the recent years, vibration in the workplace has been prevalent due to industrial mechanization (Shen & House, 2017; Trotto, 2015). In production management perspective, integrating machine and human capabilities primarily aimed for higher productivity and work efficiency. However, this also steered to continuously convert basic tools and equipment into powered machineries that generate vibration.
Transportation, agriculture, forestry, fisheries, construction, mining, and manufacturing are some of the common industries that exposed workers to occupational vibrations (Krajnak, 2018). Generally, there are two common means of vibration exposure: whole- body vibration (WBV) and HAV, which can affect different parts of the human body depending on the contact point. WBV is commonly transmitted to the lumbar spine that can continuously flow to the upper back, shoulders, and neck while HAV is absorbed by the hand before it eventually flows to the upper limbs.
The transportation and warehousing industries utilized various types of transport vehicles to deliver goods and passengers. Due to different road pavements, workers are exposed to random and intermittent WBV while driving. In agriculture, forestry, fisheries, construction, and mining industries, workers are exposed to ride-on machineries like tractors, fishing vessels, and large earth moving equipment such as bulldozers and dump trucks, which also transmit WBV. In general, vibration is a necessary physical factor in all ride-on machineries and the vibration frequency in most vehicles is within 3 to 7 Hz (Harrison et al., 2000; Kuiper et al., 2005; Zamanian et al., 2014). On the other hand, HAV from powered equipment like chainsaws, hand tractors, jackhammers, drills, grinders, and sanders are also present in the above-mentioned industries. The harmful effects of WBV and HAV intensify when integrated with extended period of forceful movements and awkward postures (Giannini et al., 1999; Morgan & Mansfield, 2014;
Smets et al., 2010; Thompson et al., 2010; Yung et al., 2017).
1.2 Whole-body vibration
Apart from occupational settings, WBV is also found in sports training and is used as medical intervention especially in physical rehabilitation. It can stimulate muscle activity (Eklund & Hagbarth, 1966), enhance muscle strength and power (Issurin et al., 1994; Issurin & Tenenbaum, 1999; Rehn et al., 2007), and rehabilitate chronic neurological diseases (Chanou et al., 2012), specifically when moderately applied.
Vibration frequency, amplitude, and application method are WBV characteristics that can affect muscle strength. In addition, exercise protocols like training type, intensity, and volume can also influence the development of muscular power (Luo et al., 2005).
Nonetheless, the uncontrolled use of and chronic exposure to WBV is consistently stated to have harmful effects on the human body (Buckle & Devereux, 2002;
Gerhardsson et al., 2005; Nishiyama et al., 1998). From minor disorders like headaches and dizziness caused by motion sickness to severe neck and back pains from long hours of driving were reported (Boshuizen et al., 1991; Bovenzi, 2005; Bovenzi & Hulshof, 1999; Kumar et al., 1999). As listed in one study, the common sources of occupational WBV are cars, vans, lorries, tractors, buses, forklift trucks, and loaders (Palmer et al., 2000). One of the standard parameters that can be used to quantify vibration exposure is the estimated vibration dose value (eVDV), which is calculated using the frequency, magnitude, exposure duration, and direction of the imposed vibration. The exposure action value (EAV) and exposure limit value (ELV) are also frequently used parameters to classify safe exposure. EAV is the daily amount of exposure in which employers must take act to control contact, while ELV is the maximum level that an unprotected operator may be exposed to in an 8-h period. For WBV, the suggested EAV and ELV is 0.5 m/s2 and 1.15 m/s2 (Palmer & Bovenzi, 2015). Furthermore, according to the International Organization for Standardization (ISO 2631-1, 2007), a 10 min/day of WBV training is potentially harmful to the body. Hence, exposure must be regulated within this period.
1.3 Hand-arm vibration
Hand-held powered tools and hand-guided powered equipment such as sanders, drillers, grinders, pneumatic hammers, chainsaws, jackhammers, and hand tractors usually used in the workplace are the primary sources of HAV. These tools and equipment create a wide range of vibration frequency that are transmitted to the hand and arm of the users. The Health and Safety Executive provided a summary of vibration magnitudes of these machines. For instance, hand drills have a vibration magnitude of 2–5 m/s2, grinders generate 3–10 m/s2, sanders have 6–14 m/s2, pneumatic hammers generate 10–29 m/s2, and chain saws have 3–14 m/s2 (HSE, 2013). Leisure activities such as cycling and tennis are also other sources of HAV (Chiementin et al., 2013; Cross, 2015; Taylor et al., 2018).
Similar to WBV, the International Organization for Standardization (ISO 5349-1, 2001) has set two threshold values for safe HAV. The recommended EAV and ELV is 2.5 m/s2 and 5 m/s2 (Palmer & Bovenzi, 2015).
The Canadian Center for Occupational Health and Safety stated that for hand tools generating vibration, the ideal way to limit transmissibility is during the tool design stage through making ergonomically designed handles. However, for existing machineries, which failed to consider this on their design phase, several control measures to reduce the amount of transmitted vibration like anti-vibration gloves for personal protective use (Budd & House, 2017; Hewitt et al., 2016), inclusion of grip support and engine mounts (Binarao et al., 2017; Layaoen et al., 2015; Yap et al., 2016), and redesigning the handlebar structure (Mojica et al., 2016) were investigated. In addition, some guidelines based on common exposure patterns were suggested. For instance, the use of hammer tools for more than 1 h/day or rotary tools for more than 2 h/day may likely surpass ELV while EAV may be exceeded if exposed to certain hammer tools for as little as 15 min/day (HSE, 2005). Thus, exposure duration must be limited within these periods.
1.4 Hand-arm transmitted vibration
Vibration is typically measured using accelerometers, which are attached to the source in various ways. With the help of data analysis software, vibration parameters such as amplitude and acceleration can be calculated and analyzed through using appropriate formulas and equations. In most cases, time-based signals are converted into frequency- based data using Fast Fourier Transform (FFT) because this form of data can provide a more meaningful information such as the frequency bands where peak vibration amplitudes occur and what causes them to happen. In addition, vibration signals can also be measured using tri-axial accelerometers, which record the vibration along the x-, y-, and z-axes. This type of accelerometer can provide a more substantial information about the vibration source. Generally, the total vibration acceleration is computed as:
𝐴𝑇! = %𝐴𝑥! #+ 𝐴𝑦! #+ 𝐴𝑧! # (1.1)
where ATi is the total vibration acceleration, Axi, Ayi, and Azi are the vibration acceleration measured along the x-, y-, and z-axes on measurement location (i).
Aside from ATi, another meaningful vibration parameter is the amount transmitted from the source to various locations connected to it. Fundamentally, transmitted vibration is the ratio between the total vibration acceleration measured on the desired measurement location and on the source. For hand-arm transmitted vibration (HTV), the common measurement locations are the hand, wrist, forearm, elbow, upper arm, and shoulder (Layaoen et al., 2015; Revilla et al., 2015; Wen et al., 2019; Xu et al., 2017). The magnitude of effects of vibration on humans depend on the amount transmitted to the body. ISO 5349-1 (2001) enumerates the factors that influence the effects of HTV during working condition. These include the frequency spectrum and magnitude of vibration, exposure duration per working day, and cumulative exposure to date. Theoretically, frequency (in Hz) is the movement of vibration per second that affects the amount being
absorbed by the body; magnitude (in m/s2) is the peak-to-peak distance reached by the movement or the peak distance from some central value to the maximum displacement;
daily vibration exposure duration is the time span that the hands are exposed to vibration;
cumulative exposure or daily vibration exposure is calculated from the magnitude of vibration and daily exposure duration (ISO 5349-1, 2001). However, the amount of HTV is not just based on the characteristics of the vibration source but also on the coupling of the hand to the source, nature of tasks, and physiological differences such as age, hand volume, and palm thickness (Burström, 1994a; Burström, 1994b; Burström & Lundström, 1994; Carlsöö, 1982; CEN 15350, 2013).
Grip force and arm posture are the most common studied biomechanical factors that influence HTV. Previous studies stated that strong grip force significantly led to higher vibration transmissibility because as force exertion increases, the stiffness of the arm and effective mass of the palm and hand also increase (Burström, 1994a; Carlsöö, 1982; Pan et al., 2018). This makes the vibration to dissipate easily along the hands and arms. However, grip exertion, specifically at maximum level, is influenced by hand-arm posture (Fan et al., 2019; Mogk & Keir, 2003; Richards et al., 1996). The forearm rotation from pronation to supination has distinct effects on grip exertion because these movements affect the position of the finger flexors and other muscles responsible for gripping (Brand & Hollister, 1993). One study suggested that forearm pronation with mild grip force can inversely influence the effects of HAV (Shibata & Maeda, 2008).
To date, there have been no clear investigations about the combined effects of HAV, forceful movements, and awkward postures on some physiological responses and hand functions when operating a dual-handle moving equipment. Although it has been established that continuous exposure to any of these external stressors can lead to serious illnesses and injuries on the upper extremity commonly known as HAVS.
1.5 Hand-arm vibration syndrome
Prolonged and extensive exposure to high level of HAV leads to neurological, vascular, and musculoskeletal injuries, which is commonly known as HAVS (Lundström et al., 2018; Shen & House, 2017; Ye & Griffin, 2011). High frequency vibration from drills, chisels, cutting and milling machines, and chainsaws, is directly transmitted to the fingers and hands and seemed to be the principal cause of neurological and vascular symptoms (House, 2010). Meanwhile, low frequency vibration that is typically transmitted up to the arms and shoulders could be associated with the musculoskeletal discomforts along these areas (Shen & House, 2017). The prevalence among exposed individuals is approximately 50%, which varies by intensity and extent of exposure (Bernard et al., 1998). Some studies also mentioned that HAVS symptoms increased in temperate and cold climates (Burström et al., 2010; US DHHS NIOSH, 1989; US DHHS NIOSH, 1997).
The neurological aspect causes entrapment of median or ulnar nerves that leads to nerve damage and carpal tunnel syndrome (World Health Organization, 2007). It is also characterized by peripheral neuropathy with symptoms such as numbness of the fingers, loss of manipulative dexterity, and reduced sensory perception of vibration, cold and warm sensation, and pain (Lundström, 2002; Nilsson, 2002). The effects of HAV on thermotactile impairment are more common on cold than warm environment (Burström et al., 2008; Hirosawa et al., 1992) and the neurophysiological symptoms seen on affected workers vary from minor to severe within a few years of exposure (Lundström et al., 2018). Basically, the sensorineural effects of HAVS are classified into stages: 0SN–
exposed to vibration but no symptoms, 1SN–intermittent numbness, with or without tingling, 2SN–intermittent or persistent numbness, reduced sensory perception, and 3SN–
intermittent or persistent numbness, reduced tactile discrimination and/or manipulative dexterity (Brammer et al., 1987).
Meanwhile, the primary effect of HAVS on the vascular system includes vasospasm of digital capillaries, which results to tingling and numbness of the hands and fingers and may lead to vibration white finger (World Health Organization, 2007). In addition, this causes discoloration, pain, and hyperemia of fingers due to poor blood circulation (Herrick, 2012; Shen & House, 2017). Consequently, in some rare cases, the affected fingers may become permanently discolored and they may develop gangrene (Gemne et al., 1987). The Stockholm Workshop scale (previously, the Taylor-Pelmear scale) has been used to classify the severity of vibration white finger. The stages are: 0–
no attacks, 1–mild, occasional attacks affecting only the tips of one or more fingers, 2–
moderate, occasional attacks affecting distal and middle (rarely also proximal) phalanges of one or more fingers, 3–severe, frequent attacks affecting all phalanges of most fingers, and 4–very severe, as in stage 3, with trophic skin changes in the fingertips (Gemne et al., 1987; Litherland, 1986; Taylor, 1988).
Finally, musculoskeletal injuries caused by HAV include chronic pain on the joints, ligaments, muscles, and tendons of the upper limb (World Health Organization, 2007). Occupational vibration exposures are significantly linked to the development of severe hand, wrist, elbow, shoulder, and neck pain, although the risk is higher on the distal sites like the hands and wrists (Charles et al., 2018; Palmer et al., 2001). These symptoms seem to occur due to direct vibration-induced damage to muscle tissues and local nerves (Necking et al., 2004). Eventually, fundamental hand functions such as grip strength and pinch strength become impaired (Necking et al., 2004; Widia & Dawal, 2011).
Furthermore, musculoskeletal disorders are also highly associated with the nature of tasks, which may involve awkward postures, high hand forces, highly repetitive movements, repeated impacts, and heavy and frequent liftings (Bao, 2015).
The tendency to fully develop vibration-related injuries takes several years. For instance, loggers and mechanics are likely to develop HAVS after 17 years and 24 years of continuous exposure to chainsaws and vibrating tools (Youakim, 2012). In general, the latency period is from one year to 40 years depending on the extent of vibration exposure (Shen & House, 2017). In addition, the ISO standard stated that 10% of workers constantly exposed at the EAV may acquire vibration-related disorders over a period of 12 years. Given that it may take years to develop these injuries, once it is acquired, its effects are irreversible especially if neglected (Druga et al., 2007). The impact and severity of HAVS can affect work-related tasks and even daily life activities. Hence, investigating the effects of immediate exposure, particularly during extreme conditions, is deemed necessary so it can be prevented.
1.6 Immediate effects of short-term exposure to HAV
The early effects of short-term exposure to handle vibration are evident on temporary neurological, vascular, and musculoskeletal disorders such as reduction on finger sensitivity, lower grip strength, symptoms of vasoconstriction, higher muscle contraction, and discomfort along the upper extremity. With regards to the neurological aspect caused by HAV, previous research showed that a 30-min exposure caused the vibration perception threshold to increase and numbness and paresthesia to develop (Malchaire et al., 1998; Thonnard et al., 1997). Meanwhile, even a 2-min handle vibration exposure led to a significant reduction on the index and middle finger sensitivity and a significant increase on finger skin temperature, which are early signs of neurological abnormalities (Forouharmajd et al., 2017). In a profound level, HAV was also found to reduce peripheral blood flow and cause vasoconstriction (Egan et al., 1996; Thompson &
Griffin, 2009), which may lead to reduced sensitivity and eventually, vibration white finger. Neurological symptoms seemed to be more commonly developed on short-term exposure than vascular symptoms (Bylund, 2004). On the other hand, the onset of musculoskeletal illnesses can be observed on the reduction of hand strength and perceived discomfort caused by muscle fatigue. In one study, it was found that a 5-min and 15-min exposure to handle vibration led to reduced grip strength and increased forearm muscle activity (Widia & Dawal, 2011), which are immediate signs of fatigue development.
Considering the studies of Forouharmajd et al. (2017) and Widia and Dawal (2011), this dissertation set a 5-min exposure duration since the onset of HAVS symptoms seemed to be visible around this period. Moreover, hand tools or hand-guided equipment requiring strong force exertion are commonly operated in bouts or repetitions of a few minutes followed by a certain amount of rest. Overall, a short-term HAV exposure can start to affect fine hand motor performance, which implied that continuous exposure may lead to more serious and permanent illnesses that can ultimately reduce the quality of life.
1.7 Hand tractor in the Philippines
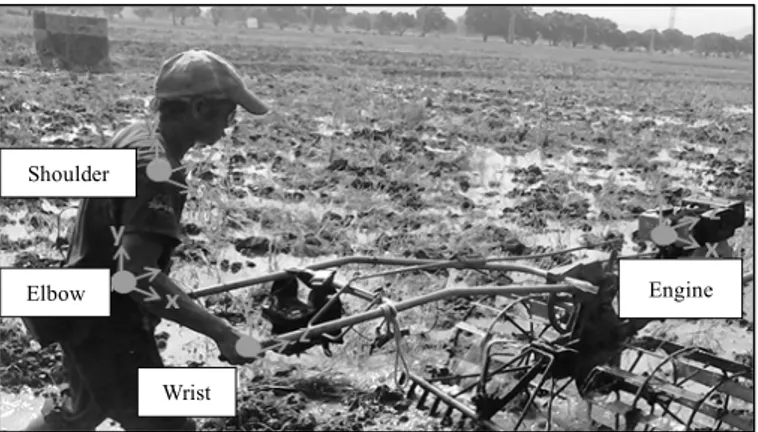
This dissertation was motivated by previous research about hand tractor vibration conducted in the Philippines (Binarao et al., 2017; Layaoen et al., 2015; Mojica et al., 2016; Revilla et al., 2015; Yap et al., 2016). The Philippines is a tropical country and agriculture is one of the major sources of livelihood. According to the Food and Agriculture Organization of the United Nations, from 1999 to 2014, 25–30% of the total labor force were under the four sub-sectors of agriculture (FAO, 2019). In turn, around 17% of the 30-million-hectare Philippine land area are arable land devoted to farming crops (FAOSTAT, 2014). Among the top agricultural commodities, rice and paddy had the highest production value (FAOSTAT, 2015a) and second in terms of production quantity (FAOSTAT, 2015b). Generally, rice farming can be done manually, but land preparation is performed with the help of carabaos or farming machineries. A common farming machinery is the hand tractor, which is a hand-guided powered equipment used to cultivate small and medium-sized farmlands. Normally, operators forwardly guide and push the hand tractor, at a slow pace, to break-up the soil (shown in Figure 1.1). In some rare cases in which the soil is dry and hard, an added downward force is necessary.
A typical hand tractor engine has a speed ranging from 2,400 to 3,600 revolutions per minute or 40 to 60 Hz, which generates vibration. This vibration is transmitted to the upper limb of operators. Some important points that the previous studies in the Philippines focused on include: (1) determining the amount of vibration transmitted to the hand-arm system during actual farming operations using a tri-axial accelerometer attached to the tractor engine, metacarpal, olecranon, and acromion of the subjects (Revilla et al., 2015), (2) investigating the reduction in HTV when a variety of commercially-available handle grips (bicycle or motorcycle handle grips), substitute grip straps (recycled rubber or cloth), and engine mounts were placed on the handle and engine cage during indoor idling set-up (Binarao et al. 2017; Layaoen et al., 2015; Yap et al., 2016), and (3) redesigning
and fabricating a new handlebar structure inspired by the initial designs of Bureerat and Kanyakam (2007) to minimize HTV (Mojica et al., 2016). The series of investigations were able to reduce HTV by a significant amount, specifically under laboratory set-up.
However, the influence of hand-arm biomechanics during hand tractor operation was yet to be investigated and found on other related studies. Moreover, the cumulative physiological effects of HAV, changes in grip force exertion, and various forearm posture when using dual-handle equipment were not considered because of resource limitations.
Figure 1.1. Measurement of vibration acceleration on the engine, wrist, elbow, and shoulder during actual hand tractor operation.
In addition, there have been no public reports or records in the Philippines, concerning people who acquired or experienced any symptoms of HAVS. While 40% of Filipino workers are involved in agricultural works (CIDA-LGSP, 2003) and several more percentage are working in manufacturing firms, exposure to vibration is prevalent and related injuries are likely to happen. Exposing the workers to prolonged and extreme vibration may reduce their productivity and ability to work efficiently, especially since crop cultivation involved manual activities such as seedbed preparation, pulling and bundling of seedlings, picking of snails or crop pests, and harvesting (BAS, 2004) that require effective hand movements. Essentially, these made way to this dissertation, which focused on the human aspect and the effects of extreme conditions on the physiology and functionality of the hand and arm. Furthermore, this dissertation investigates the influence of various handle grip designs when subjected to a similar pre-imposed condition.
Shoulder
Elbow
Wrist
Engine
1.8 General objectives and research plan
The long-term impact of HAV has been massively established and various preventive measures, specifically for affected individuals, have been introduced. It is apparent that the hazard and seriousness HAVS poses can greatly affect the daily life activities of an exposed individual. Moreover, the influence of various grip force levels on the amount of HTV and the effects of short-term exposure on hand and arm disorders have also been well-documented. While these studies focused on various hand-arm biomechanics when using single-handle powered hand tools, there are no studies that considered grip force levels and arm postures when operating dual-handle and power- guided machineries. Unlike powered hand tools that mainly require strong grip and flexed or extended elbow for proper handling and control, hand-guided powered machineries involve various grip force levels and slightly bent elbow depending on how to maneuver and guide the equipment as they move. In addition, the combined effect of handle vibration, various grip force levels, and forearm postures during short exposure duration has yet to be explored on either equipment type.
The cumulative effects of these three factors at the early stages of exposure is necessary to identify the onset of HAVS symptoms on various work conditions, especially when involving dual-handle vibrating machineries. Thus, this dissertation aimed to determine the immediate effects of short-term HAV exposure and how they can be controlled through implementing various handle grip designs.
The main objective of this dissertation is to provide new and holistic insights regarding the physical stress caused by the compounding effects of constant handle vibration, sustained grip force levels, and two forearm postures and how various handle shapes and surface textures can influence the effects. The objective of the first study is to explore how short-term handle vibration affects hand performances and forearm muscles when sustained moderate grip force and neutral forearm posture were applied. The second
objective is to investigate the effects of two forearm postures and grip force levels on the amount of vibration transmitted to the wrist and elbow, grip strength reduction, forearm muscle activities, and perceived discomfort along the upper extremity. Finally, the third objective is to determine the influence of various handle shapes and surface profiles on transmitted vibration to the hand and wrist, grip strength reduction, finger sensitivity, forearm muscle activities, perceived discomfort along the upper extremity, grip comfort perception, and perceived strength of vibration.
1.9 Structure of the dissertation
Chapter 2 is a preliminary study that examines the short-term effect of handle vibration, with unmonitored and self-imposed grip force and neutral forearm posture, on the hand and forearm muscles. This chapter is an initial investigation that directs Chapters 3, 4, and 5 to further examine the distinctive contribution of handle vibration, grip force level, and forearm posture on the development of HAVS symptoms.
Chapter 3 explores the early effects of short-term handle vibration on the hand and forearm when sustained moderate grip force and neutral forearm posture were employed.
This chapter aims to determine the effects of a 5-min vibration exposure on grip strength, pinch strength, finger dexterity, finger sensitivity, perceived discomfort on the upper limb, and activity of forearm muscles namely the extensor carpi radialis (ECR), finger flexors (FF), flexor carpi ulnaris (FCU), and flexor carpi radialis (FCR). To determine the exclusive effects of vibration, two experiment conditions, with the same grip force level and forearm posture, were compared: no vibration task and with vibration task.
Chapter 4 investigates the effects of two forearm postures and grip force levels on transmitted vibration, grip strength reduction, forearm muscle activities (similar to Chapter 3), and perceived discomfort along the upper extremity. Two common arm posture, neutral and pronated forearm, when using a hand-guided vibration equipment paired with mild or hard grip force were examined. This chapter aims to determine which forearm posture poses less harmful effects during tasks requiring mild and hard grip.
Chapter 5 focuses on determining the influence of various handle shapes and surface profiles on transmitted vibration, hand strength and sensation, forearm muscle activities (similar to Chapter 3), perceived discomfort on the upper limb, grip comfort, and vibration strength perception. This chapter aims to determine how three handle shapes: circular, double-frustum, and elliptic with distinct surface profiles: smooth and
patterned influenced the cumulative effects of handle vibration, sustained moderate grip force, and awkward forearm posture on the aforementioned parameters.
Chapter 6 is a synthesis of Chapters 2 to 5. This chapter summarizes the findings and provides a holistic discussion based on the individual and cumulative results of the previous chapters. It also includes areas for further study and future plans about this research.
Chapter 2. Exploratory Study on the Impacts of
Handle Vibration on the Hand and Forearm
2.1 Introduction
Physical exposure to vibration has been proven to have desirable and undesirable effects on humans (Carlsöö, 1982; Egan et al., 1996; Fuermaier et al., 2014; Schuhfried et al., 2005). For instance, moderately employed WBV can stimulate and improve muscle activities which is widely applied in various sports training and medical field (Cardinale
& Wakeling, 2005; Fuermaier et al., 2014; Schuhfried et al., 2005; Torvinen et al., 2002).
Although, when too much vibration is transmitted to the human body, vibration-related injuries can manifest. The hand-arm area is one of the most common parts that is being exposed to such vibration level, specifically with the integration of industrial and other modernized machineries in the workplace. The International Organization for Standardization set a threshold (of 1 m/s2), action (of 2.5 m/s2), and exposure (of 5 m/s2) limit value of handle vibration that can be referred to when using vibration machineries (ISO 5349-1, 2001). The exposure limit value is the maximum daily exposure that an unprotected operator may be exposed to (Stellman, 1998), and any amount greater than this gives higher health and safety risks.
Individuals who have been exposed to jackhammers, chainsaws, drillers, and even some dental tools are those who are prone to HAVS. In Europe alone, 25 million workers are exposed to vibration at work and are at risk to the said injuries. While in the US, 2 million workers are exposed to HAV and 50% of them are likely to develop HAVS (Trotto, 2015). Furthermore, 72,000 to 144,000 cases of HAVS have been reported in Canada as of 2017 (Shen & House, 2017). The Health and Safety Executive (2017) stated that there are approximately 3,000 cases of vibration white finger being reported per year.
These numbers show that many people have high chances of acquiring vibration-related injuries from their line of work.
Agriculture is one work sector that is known to have significant risk factors when it comes to exposure from vibration equipment such as tractors, lawn mowers, harvesters,
chainsaws, and rice-planting equipment (Vallone et al., 2016). Hence, in an agricultural country like the Philippines, where 17% of the 30-million-hectare land area is devoted for agriculture, a significant number of people are exposed to such risks. For instance, research showed that hand tractor operators are constantly exposed to vibration greater than the exposure limit value (Revilla et al., 2015) and this may lead to injuries commonly known as HAVS (Youakim, 2012). HAVS is defined as injuries in the fingers, hands, and arms resulting to numbness, impaired sensitivity, limited dexterity, impaired grip force, and reduced mobility. These are significant hand functions that are necessary to perform daily life activities and work-related tasks, impairing any of them can lead to low quality life.
The tendency to fully develop vibration injuries takes several years. For instance, loggers may develop it after 17 years of exposure while mechanics may develop it after 24 years of exposure (Youakim, 2012). The ISO 5349-1:2001 described it as: chances are, 10% of workers with 8-h of daily exposure to 2.5 m/s2 of vibration magnitude for 12 years are going to acquire vibration white finger. Aside from the mechanical source of vibration and exposure duration, the amount of vibration transmitted to the body is also influenced by biomechanical factors such as grip strength and possibly other hand-arm posture (Burström, 1994a; Carlsöö, 1982). In the study of Burström and Lundström (1994), they concluded that tight grip and high vibration frequency (> 60 Hz) elicited high vibration absorption.
Although it may take a few years for HAVS to completely manifest, its effects are irreversible once acquired. Thus, it is extremely important to detect its immediate effects in the early stages of exposure. As an initial step, this study explores the effects of vibration on the hand-arm area when a specified grip force is employed. Specifically, it aims to investigate the impacts of a 5-min handle vibration on hand functions, upper limb discomfort, and forearm muscle responses during hand grip strength test and exposure to task with and without vibration.
2.2 Methods
2.2.1 Participants
This study recruited seven young male adults (23.6 ± 2.1 years old) without any long-term exposure to vibration and have not had any recent injuries in the hand-arm area.
Mean height and weight are 175.3 ± 5.5 cm and 71.9 ± 7.4 kg, respectively, while hand measurement is presented in Table 2.1. All participants were right-hand dominant based on Edinburgh Handedness Inventory test (Oldfield, 1971).
Table 2.1. Hand anthropometric data of the participants (mean ± SD).
Variables (in mm) Right Left
Hand length 186.4 ± 6.8 185.4 ± 6.8
Hand width 81.9 ± 2.7 80.9 ± 2.5
Thumb 59.1 ± 2.6 59.6 ± 2.6
Index finger 69.6 ± 3.9 69.7 ± 4.0
Middle finger 78.0 ± 2.9 77.7 ± 3.2
Ring finger 72.4 ± 2.3 73.0 ± 2.8
Small finger 57.7 ± 2.8 58.9 ± 2.9
Forearm length 254.3 ± 10.5 255.0 ± 8.9
Upper arm length 358.7 ± 11.2 355.7 ± 14.0
2.2.2 Vibration source
A custom-made vibration machine (Sinfonia Technology Co., LTD., Japan) installed with a bicycle handlebar was used as vibration source. The vibration table has a vibration frequency of 60 Hz and can have a maximum load of 10 kg while the bicycle handlebar is made up of iron, has a dimension of 550 x 270 x 100 mm (width, length, and height), and has a mass of 580 g with pipe diameter of 22.2 mm. The bicycle handlebar was attached to the vibration table through the handlebar attachment, which is composed of aluminium as frames, c-clamps as fixtures, and device mounting stand with round brace clamp as handlebar stand (shown in Figure 2.1 (a)).
2.2.3 Experiment procedure
The experiment was conducted in an indoor laboratory set-up. First, the participant was introduced to the objectives of the study, test procedures, equipment to be used, experiment tasks, and experiment duration. After changing to experiment clothing and measuring the height, weight, hand anthropometry, and handedness, electrodes of surface EMG were placed on the FCR, FF, FCU, and extensor digitorum (ED) of the dominant side. Then, pre-task hand tests mainly: (1) forearm muscle responses during maximal grip strength test, (2) 9-hole peg test for finger dexterity, (3) pinch gauge test for pinch strength, and (4) two-point discrimination test for finger sensitivity were performed to assess baseline hand functions (for further details about the hand tests, see pages 23 and 24).
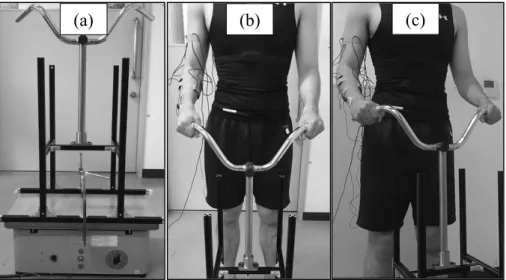
After the pre-task tests, the participant was instructed to rest for 5 min in a sitting position to allow the hands and forearm muscles to relax before the actual task. Then, he was led to stand in front of the machine for 1 min while being instructed on how to grip the handlebar and how to position the arms during the task. The task was to grip the handlebar in a specified arm posture using 50% strength for 5 min under two task conditions: (1) with handle vibration (V) and (2) without handle vibration (NV). There was no specific elbow or wrist angle during task performance and instead, the participant was just asked to position his arm in the manner shown in Figure 2.1 (b) wherein the upper arm was closed to the trunk, the elbow was approximately angled at 145°, the forearm was in neutral position, the wrist was slightly in ulnar deviation and in flexion, and the hand held the handlebar at 50% perceived grip force. The participant was not encouraged to pull up, push down, or apply any force to the handlebar during task performance instead he was only instructed to hold it in static position. This hand-arm posture was employed since it is closely identical as to how two- wheel tractor operators hold the equipment during farming operation.
Figure 2.1. Experiment set-up of the preliminary study: (a) vibration source and (b) front view and (c) semi-side view of the hand-arm posture during task performance.
During both task conditions, the responses of FCR, FF, FCU, and ED were transmitted and recorded in PowerLab (ADInstruments, New Zealand) and LabChart software (Version 7.3.8). After the 5-min V task, a 1-min adjustment period was given to the participant as he remained standing in front of the vibration machine while he was asked to rate discomfort felt on the hand, forearm, upper arm, and shoulder. He was also instructed not to rub or wipe his hands because this might affect the results of the succeeding hand tests. Forearm muscle responses during maximal and 50% grip strength test were measured and recorded again, and the other hand tests were performed immediately after. Afterwards, a 5-min complete rest was given before performing the exact same sequence for NV task. The schematized experiment procedure is presented in Figure 2.2.
Figure 2.2. Task flow of the preliminary experiment.
5-min exposure
5-min exposure Baseline
measurements
(N = 7) V task NV task End
Post task measurements and 7-min rest
(a) (b) (c)
2.2.4 Measurements
Data were recorded and categorized into three: pre-task, post V task, and post NV task; while three major tests were analysed: hand tests, forearm muscle responses during grip strength test, and forearm muscle activities during task performance. However, the baseline data were not used for comparison. Instead, only the post-task data were compared since these data can give a clearer indication on the impact of handle vibration.
The dependent parameters were finger dexterity from the 9-hole peg test, lateral pinch strength, finger sensitivity from the two-point discrimination test, subjective discomfort rating, and forearm muscle activities during grip strength test and task performance. On the other hand, the presence and absence of handle vibration was the independent variable.
Hand performance tests
Finger dexterity: A cardboard 9-hole peg panel from The Agency of Design was used to assess finger dexterity of both hands. The participant was instructed to sequentially put the pegs in the designated hole which were numbered from 1 to 9 then remove each of them starting from 9 to 1, as fast as he could. Three actual trials were made for the right hand first, followed by three trials for the left hand and each trial was timed using a stopwatch. If a peg fell on the floor, the trial was stopped and repeated but when it only fell on the table (where the peg board was placed), the time and trial was continued.
Pinch strength: Lateral pinch strength was measured using a B&L Engineering (USA) pinch gauge. Initially, the participant was instructed to have a proper arm posture wherein the elbow was angled at 90° and placed beside the trunk while the forearm was in neutral position, hanging, and not anchored on a table. A lateral pinch using 100%
strength was performed three times for the right hand first, and another three trials for the
left hand. The researcher supported the opposite side of the gauge as the participant pinched. A rest period of 10 s was given in between trials.
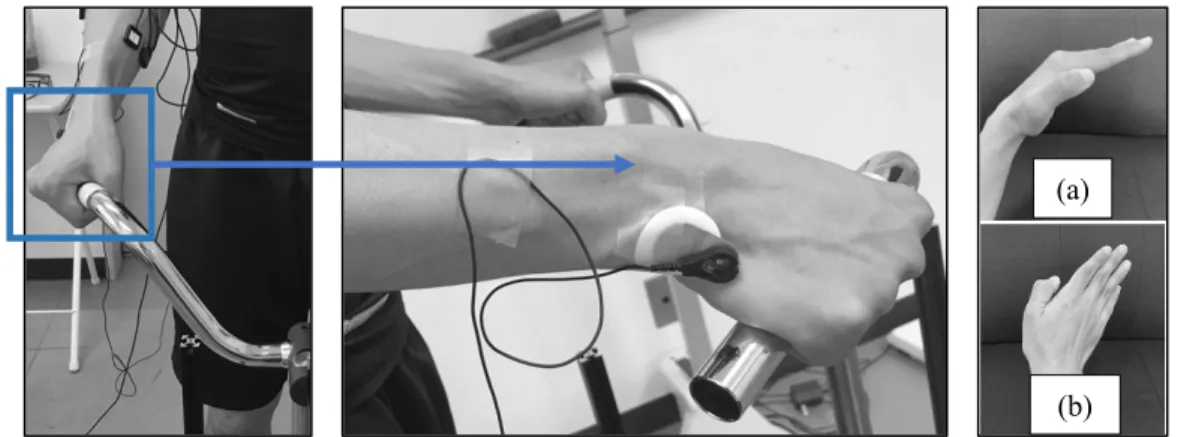
Finger sensitivity: The last hand test was the two-point discrimination test for finger sensitivity. Firstly, the participant was asked to close his eyes and lend his right hand to the researcher. Then, the researcher randomly selected between a single point or any two-point (with 2 to 4 mm distance) from the Touch Test® Two-Point Discriminator (Exacta Precision & Performance, China). A finger (starting from the thumb up to the small finger, one at a time) was poked with these points randomly for seven times and the participant was asked if he felt one or two points. If at least four out of seven times were determined correctly, the next finger was tested. Else, gradually increase two-point distance until the participant correctly determined the number of points being pinned on his finger. The minimum two-point distance that was consistently determined correctly was recorded for that specific finger. Ideally, the greater the two-point distance the lesser tactile sensitivity that finger has. This was repeated for all the fingers on the left hand.
Forearm muscle activities during hand grip test, V task, and NV task
Forearm muscle activities were measured during pre-task-, post V task-, and post NV task-hand grip strength test and during both V and NV task performance. After the placement areas namely the FCR, FF, FCU, and ED of the dominant hand side were located and cleaned, surface EMG electrodes were carefully placed on these forearm muscles. Then, the MVC was measured to normalize the muscle activity data across all participants.
For the grip strength test, the participant was initially instructed to have a proper arm posture wherein the elbow was angled at 90° and placed beside the trunk while the forearm was in neutral position, hanging, and not anchored on a table. It was ensured that the base of the T.K.K.5710B Dynamometer (Takei, Japan) was rested on the heel of the palm and the handle was rested on the middle of the four fingers before the participant
squeezed with 100% strength for 10 s. This was done once for the dominant hand then a rest period of 1 min was given. He was again asked to squeeze the dynamometer for 10 s, but this time with 50% strength which was done to practice and familiarize him on how he should hold the handlebar during task performance. During both grip tasks, the participant was instructed to maintain the same force for the 10-s span by looking at a real-time digital value of his grip force. Forearm muscle responses were recorded during the test.
Subjective discomfort rating
After performing each task, a subjective discomfort rating of the hand, forearm, upper arm, and shoulder was asked. Using the Wong-Baker FACES Foundation (2019) pain rating scale, discomfort was ranked from 0 (no discomfort) to 10 (worst possible discomfort). The dominant side was always the main reference during the assessment.
2.2.5 Statistical analysis
Paired t-test was used to compare post V task and post NV task for finger dexterity, pinch strength, subjective discomfort rating, and forearm muscle responses during grip strength test. It was also used for comparing forearm muscle activity during V and NV task. Meanwhile, post V task and post NV task for the two-point discrimination test was compared using Wilcoxon signed-rank test. A non-parametric analysis was used for this hand test since it failed normality (via Shapiro-Wilk test). Lastly, all hand tests for the right and left hand were compared separately between post-task periods and no statistical comparison was made between the two since a natural difference in strength and efficiency was expected between the dominant and non-dominant hand which can cause a misleading contribution to the effects of handle vibration. The level of significance used in the study was 0.05.
2.3 Results
2.3.1 Post-task hand performance tests
Finger dexterity, pinch strength, and finger sensitivity
Paired t-test revealed that finger dexterity and pinch strength did not vary significantly after V task and NV task. This was true for both the right and left hand, although a slightly faster performance in the 9-hole peg test was observed and expected on the dominant hand as compared to the non-dominant hand (shown in Table 2.2).
Table 2.2. Finger dexterity and pinch strength comparison (mean ± SD) (n = 7).
Parameter Hand side NV task V task p (NV vs. V) Finger dexterity (s) Right 16.8 ± 1.2 17.1 ± 1.0 0.359
Left 18.0 ± 2.0 18.2 ± 2.0 0.496
Pinch strength (kgf) Right 9.5 ± 1.3 9.3 ± 1.5 0.186
Left 9.7 ± 1.1 9.3 ± 1.3 0.115
Note: NV = no vibration; V = vibration.
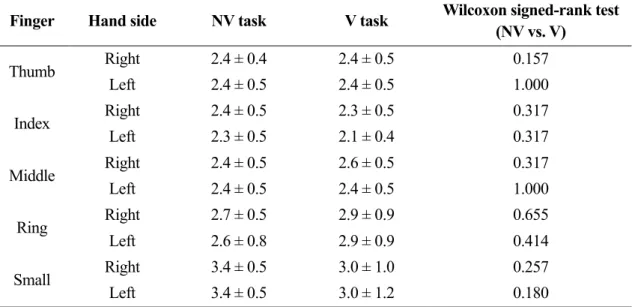
On the other hand, Wilcoxon signed-rank test revealed that the mean perceived two-point distance of all fingers did not vary (p > 0.05) between post V task and post NV task. Although, the distance of each finger in both post-task periods were within the normal range of less than 10 mm (Moberg, 1990), as presented in Table 2.3.
Table 2.3. Finger sensitivity comparison (in mm, mean ± SD) (n = 7).
Finger Hand side NV task V task Wilcoxon signed-rank test (NV vs. V)
Thumb Right 2.4 ± 0.4 2.4 ± 0.5 0.157
Left 2.4 ± 0.5 2.4 ± 0.5 1.000
Index Right 2.4 ± 0.5 2.3 ± 0.5 0.317
Left 2.3 ± 0.5 2.1 ± 0.4 0.317
Middle Right 2.4 ± 0.5 2.6 ± 0.5 0.317
Left 2.4 ± 0.5 2.4 ± 0.5 1.000
Ring Right 2.7 ± 0.5 2.9 ± 0.9 0.655
Left 2.6 ± 0.8 2.9 ± 0.9 0.414
Small Right 3.4 ± 0.5 3.0 ± 1.0 0.257
Left 3.4 ± 0.5 3.0 ± 1.2 0.180
Note: NV = no vibration; V = vibration.
2.3.2 Post-task subjective discomfort rating
There was a significant difference in discomfort perceived on the shoulder between post V task and post NV task, t(6) = 2.838, p = 0.03. Moreover, it was observed that the hand had the highest discomfort (moderate to severe) among all upper limb area, followed by the forearm (mild to moderate), upper arm (mild to moderate), and shoulder (none to mild), as presented in Figure 2.3.
Figure 2.3. Discomfort rating comparison (* p < 0.05).
Note: NV = no vibration; V = vibration.
2.3.3 Responses of forearm muscles during grip strength test, NV task, and V task
Paired t-test showed that FCR (t(6) = -3.057, p = 0.022), FF (t(6) = -2.656, p = 0.038), and ED (t(6) = -2.512, p = 0.046) activities on post V task grip strength were significantly lower than that on post NV task (shown in Figure 2.4).
Figure 2.4. Forearm muscle activities during grip strength test (* p < 0.05).
Note: NV = no vibration; V = vibration.
0 2 4 6 8 10
Hand Forearm Upper arm Shoulder Perceived discomfort rating
Part of the upper limb
NV task V task
0%
20%
40%
60%
80%
100%
FCR FF FCU ED
% MVC
Forearm muscles
NV task V task
*
* * *
On the other hand, although activities of FCR, FF, and ED were relatively higher while FCU activity was slightly lower during V task than NV task (shown in Figure 2.5), no significant differences were found between both tasks.
Figure 2.5. Forearm muscle activities during the tasks.
Note: NV = no vibration; V = vibration.
0%
10%
20%
30%
40%
FCR FF FCU ED
% MVC
Forearm muscles
NV task V task
2.4 Discussion
2.4.1 Effects on hand performance
There were no significant differences found between post V and post NV task for all the hand tests. Specifically, an insignificant minimal improvement in the 9-hole peg test performance and an insignificant difference between pre and post V task pinch strength and two-point disk assessment were observed.
The minimal increase in the 9-hole peg performance might have been influenced by another factor such as the human capacity to adapt and learn when subjected to repeated task for a certain period. Since the same simple pattern was assigned for each hand and repeated three times, participants might have memorized the sequence well making it easier to place and remove the pegs, without putting much thought as to where and how to put and remove each of them. Generally, the concept of learning states that as a task is performed repeatedly over time, performance improved because of acquired familiarity and gained knowledge on how to do the task more efficiently. This is most especially applicable when the interval period between each trial is considerably small, similar to the 9-hole peg test performed in this study.
Meanwhile, the insignificant difference in pinch strength after performing V task and NV task might indicate that a 5-min exposure to handle vibration had no effect on finger strength. Post-task pinch strength was within the normal values of 9.8 ± 0.3 kgf (Imrhan, 1991) and 9.6 ± 1.8 kgf (Fernandez et al., 1991) indicated by previous studies.
The lack of effect might be due to the differences in muscle group used to perform lateral pinch and hand grip. Intrinsic muscles of the hand are commonly activated during precision-pinch grip, while forearm muscles are used during hand grip. Hence, the lack of engagement of these hand muscles during task performance led to unaltered finger strength.