Kyushu University Institutional Repository
強磁性金属薄膜における熱スピンダイナミクスに関 する研究
山野井, 一人
https://doi.org/10.15017/1806812
出版情報:Kyushu University, 2016, 博士(理学), 課程博士 バージョン:
権利関係:Fulltext available.
Study on interplay between heat and spin dynamics
in ferromagnetic metal thin films
A thesis submitted for the degree of Doctor of Philosophy
at
Kyushu University
by
Kazuto Yamanoi
@: January, 2017
Abstract
Investigation of magnetization dynamics in patterned magnetic structures is indispens- able for deepening understanding of the fundamental spin-related physics as well as for controlling ultrafast magnetization processes. Moreover, the magnetization dynamics is found to produce a flow of spin angular momentum, namely spin current. This is known as the dynamical spin injection. This dynamical spin injection is attractive method for generating and controlling the spin current without using electrical method. So far, the mechanism of the dynamical spin injection is attributed to the spin pumping induced by the resonant precessional motion of the magnetization in the ferromagnetic material (FM) /non-magnetic material (NM) bilayer structure. In my PhD study, the heating effect during the resonant precessional motion of the magnetization in the ferromagnet is intensively investigated. When the temperature gradient exists at the FM/NM in- terface, the thermal spin injection occurs because of the spin-dependent Seebeck effect.
From this point of view, in this thesis, the magnetization dynamics with a large preces- sion angle and the interplay between the heat and magnetization dynamics have been investigated.
First, the magnetization dynamics under the radio-frequency (RF) magnetic field
i
with a strong intensity has been investigated by using the originally developed modulation- resistance measurement. The standing spin waves with various wave lengths stabilized in the ferromagnetic film were sensitively detected. A nonlinear relationship between the RF magnetic field intensity and the oscillation amplitude was also found, which can be explained by considering the heating effect on the ferromagnetic film. This finding indicates that the resonant precessional motion of the magnetization induces the heating effect on the ferromagnetic film because of the energy dissipation through the damping torque.
To understand the aforementioned heating effect more quantitatively, a new method for detecting the temperature of the ferromagnetic film during the ferromagnetic reso- nance (FMR) has been developed. The temperature due to the FMR is simply monitored by detecting the resistance of a Cu film in contact with the ferromagnetic film. As ex- pected, the temperature of the ferromagnetic film increases significantly with the FMR.
The temperature increase is found to be as high as 13 K under the strong RF magnetic field.
Based on these knowledge, the possibility for the thermal spin injection due to the
resonant magnetization motion in a FM/NM bilayer system, namely the dynamical
thermal spin injection, was investigated experimentally. Here, a dynamical spin injection
in a CoFe-based alloy/Pt bilayer was investigated by using the inverse spin Hall effect in
the Pt film. A clear and large spin Hall voltage was founded to be induced by exciting
the FMR. To distinguish the main mechanism of the induced voltage, the stacking-
order dependence and the microwave-frequency dependence have been investigated. The
obtained results strongly suggested that the mechanism of the dynamical spin injection
iii in this system is based on the thermal spin injection due to the FMR heating effect.
Thus, in this thesis, the heating effect due to the resonant magnetization motion was
found and was quantitatively evaluated. By extending the FMR heating effect to the
FM/NM bilayer film, the dynamical thermal spin injection was found to be induced in
addition to the spin pumping. I believe that this innovative and unique demonstration
provides consistent description for the problematic issues in dynamical spin injections,
and opens a new avenue for wireless spin devices and its application.
Contents
Abstract i
1 Introduction 1
1.1 Introduction and Motivation . . . . 1
1.2 Outline of the chapters . . . . 4
2 Theoretical Background 7 2.1 Magnetization dynamics . . . . 7
2.1.1 Landau-Lifshitz-Gilbert equation . . . . 8
2.1.2 Resonant precessional motion of magnetization . . . . 8
2.2 Anisotropic magnetoresistance effect . . . . 12
2.3 Dynamical spin injection (Spin pumping effect) . . . . 15
2.4 Thermal spin injection (Spin-dependent Seebeck effect) . . . . 18
3 Experimental method 21 3.1 Sample-preparation process . . . . 21
v
3.1.1 Magnetron sputtering system . . . . 21
3.1.2 Joule-heating evaporation system . . . . 23
3.1.3 Electron-beam lithography system . . . . 24
3.1.4 Scanning electron microscope . . . . 24
3.2 Measurement technique for magnetization dynamics . . . . 27
3.2.1 VNA-FMR measurement . . . . 27
3.2.2 Homodyne detection . . . . 27
4 Magnetization dynamics under strong RF magnetic field 29 4.1 Introduction . . . . 29
4.2 Sample structure and fabrication evaluation method . . . . 31
4.3 Measurement result and spectra analysis . . . . 32
4.4 dc current dependence of resonance characteristics . . . . 35
4.5 Power dependence of resonance characteristics . . . . 36
4.6 Summary . . . . 40
5 Heating effect due to resonant magnetization motion 41 5.1 Introduction . . . . 41
5.2 Sample structure and evaluation method . . . . 43
5.3 FMR property of the fabricated sample . . . . 45
5.4 Detection of FMR heating and its power dependence . . . . 47
5.5 Relationship between resonance frequency and FMR heating effect . . . . 50
5.6 Summary . . . . 54
CONTENTS vii 6 Dynamical spin injection based on FMR heating 55
6.1 Introduction . . . . 55 6.2 Sample structure and evaluation method . . . . 57 6.3 Demonstration of dynamical thermal spin injection . . . . 60 6.4 Structural dependence of dynamical thermal spin injection in the CoFeB/
Pt bilayer structure . . . . 61 6.5 Frequency dependence of dynamical thermal spin injection due to FMR
heating effect . . . . 63 6.6 Summary . . . . 67
7 Conclusion 69
Bibliography 73
Acknowledgement 89
Research Activities 91
List of Figures
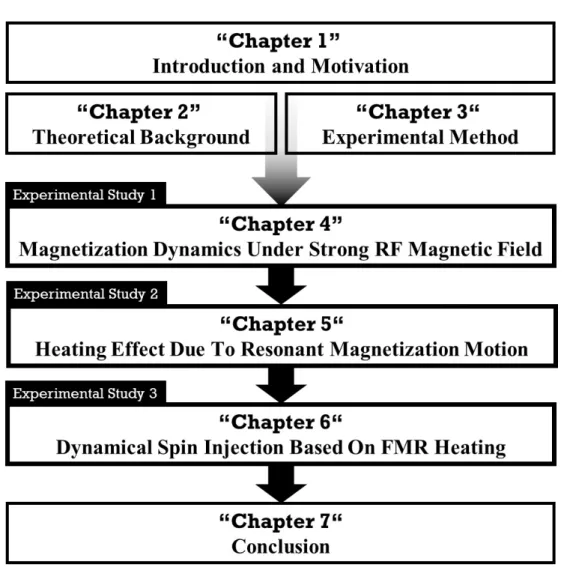
1.1 Flow chart of chapters in this thesis. . . . . 6
2.1 Schematic diagram of the magnetization dynamics. . . . . 8 2.2 (a) Schematic illustration of the coherent magnetization dynamics around
the direction of the applied magnetic field in the ferromagnetic thin film.
(b) Demagnetization dependence of FMR frequency calculated from the Kittel equation. Here, the saturation magnetization is 1T. (c) Calculated real and imaginary parts of the magnetic susceptibilities as a function of the microwave frequency. . . . . 11 2.3 (a) Illustration of the measurement method for the typical anisotropic
magnetoresistance in the ferromagnetic metal. (b) Schematic image of the resistivity changes due to the s-d scattering. (c) Resistance of the NiFe thin film as a function of the external magnetic field. (d) Resistance of the NiFe narrow wire as a function of the magnetic filed under the microwave irradiation with the power of the 100 mW and the schematic image of the resistivity change at the resonance state. . . . . 14 2.4 Populations of up- and down-spin bands during magnetization dynamics. 15
ix
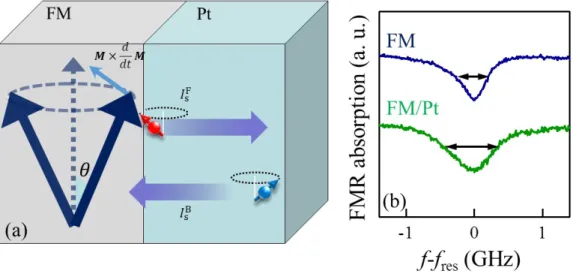
2.5 (a) Schematic illustration of the spin pumping effect in the ferromagnet/non- magnet bilayer structure. (b) Frequency dependence of the ferromagnetic resonance spectra using by the VNA measurement for the ferromagnetic CoFeB film and the ferromagnetic CoFeB/Pt bilayer structure, respec- tively. . . . 17 2.6 Schematic illustration of thermal spin injection in the ferromagnet/non-
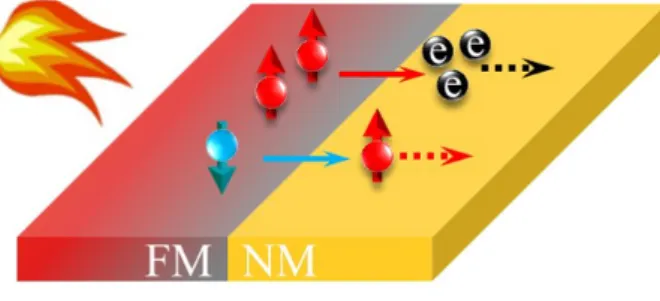
magnet bilayer structure under the temperature gradient. . . . 19
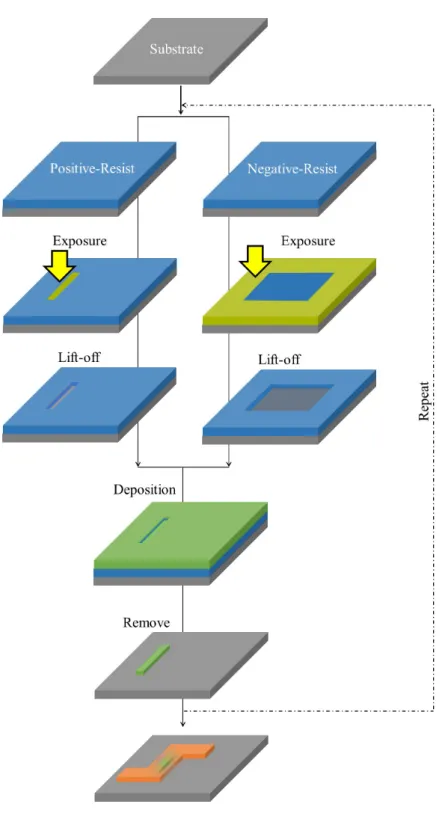
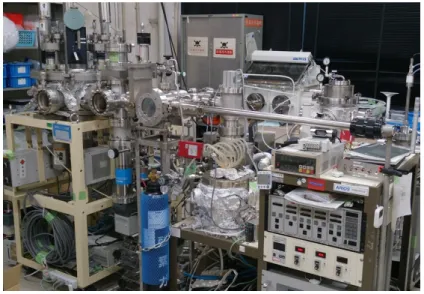
3.1 Schematic process of sample fabrication method using positive and nega- tive resists, resistively. . . . . 22 3.2 A photograph of our sputtering system. . . . 23 3.3 A photograph of Joule-Heating Deposition System. . . . . 24 3.4 A photograph of ELIONIX ELS-7500 electron beam lithography system. 25
3.5 (a) A photograph of Scanning Electron Microscope(Hitachi : S-4800). (b) SEM image of the fabricated Cu coplanar wave guide. (c) SEM image of the fabricated NiFe narrow wire. . . . 26
3.6 A photograph of the RF transports measurement system using a vector network analyzer (E5071C) and a micro probe station which capable of applied in-plane static magnetic field. . . . . 28
4.1 Schematic illustration of the fabricated MSSW device together with the
circuit diagram for the spin-wave excitation and detection. . . . . 32
LIST OF FIGURES xi 4.2 (a) Field dependence of the voltage for NiFe film under the microwave
magnetic field with the magnitude of 10 mW. (b) Numerical curve repro- duced by superimposing several Lorentzian curves with different resonant magnetic fields. . . . . 33 4.3 (a) Theoretical dispersion relationship between the FMR and the MSSW
frequencies and the external magnetic field together with the experimen- tally obtained values (Solid circle). Here, we assume λ = 2L/n. (b) Schematic illustration of standing MSSWs with the different n stabilized by periodical Cu electrodes. . . . . 35 4.4 (a) Voltage spectra for various dc currents. (b) Resonant fields for FMR
and MSSWs as a function of the dc current. (c) Saturation magnetization estimated from the experimental results with Eq. 4.1 as a function of the bias current. . . . 37 4.5 (a) Resistance spectra for radio frequency (RF) currents with various
input power. (b) Resonant fields for the ferromagnetic resonance and the standing MSSW as a function of the input RF filed power and the dashed lines is the resonance fields estimated from the M S = 1T. . . . 39
5.1 (a) Circuit diagram for the resistance measurement under the microwave magnetic field application together with the conceptual image of the FMR heating. (b) Temperature dependence of the resistivity for our Cu film. . 44 5.2 Image plots for the FMR spectra for (a) FZ-Si substrate sample and (b)
glass substrate sample together with the representative spectra for various
magnetic fields. . . . . 46
5.3 Field dependences of the electrical resistances for the Cu strip lines on (a) FZ-Si substrate and (b) glass substrate. During the resistance measure- ments, the microwave signal with the power of 100 mW was superimposed. 48
5.4 Temperature change due to the FMR heating of the CoFeAl on the glass substrate as a function of the input microwave power. The inset shows the representative field dependence of the resistance with the definition of ∆R M . The scale bar of the inset is 0.1 Ω. . . . . 49
5.5 (a) Maximum resistance change ∆R M due to the FMR heating effect as a function of the resonance frequency ω 0 /2π. The inset shows the resistance spectra due to the FMR heating effects under various microwave frequen- cies. (b) Frequency dependences of the absorption power ratio defined by P ABS /P IN due to the FMR excitation estimated from the |∆S 11 | 2 . . . . . 53
6.1 Circuit diagram for the resistance measurement under RF current injec- tion together with schematic illustration of FMR heating effect. . . . . . 59
6.2 Representative result of the field dependence of the electrical voltage in-
duced by the inverse spin Hall voltage under microwave irradiation. The
inset shows the angular dependence of the overall signal change due to
the inverse spin Hall signal. . . . 60
LIST OF FIGURES xiii 6.3 (a) Field dependence of electric voltage induced in the CoFeB/Pt/FZ-Si
sub. sample under the microwave irradiation. (b) Separation of symmet- ric and anti-symmetric contributions to the induced electric voltage in the CoFeB/Pt/FZ-Si sub. sample. (c) Field dependence of electric voltage induced in Pt/CoFeB/FZ-Si sub. sample under the microwave irradia- tion, (d) Separation of symmetric and anti-symmetric contributions to the induced electric voltage in the Pt/CoFeB/FZ-Si sub. sample. . . . . 64 6.4 (a) Frequency dependence of the absorption power ratio defined by the
P ABS /P IN due to the FMR excitation estimated from the VNA measure- ment for the spin Hall device. (b) FMR line width ∆f in the spectra of the P ABS /ω as a function of the resonant frequency. (c) Field dependence of the inverse spin Hall spectra under the various microwave frequency.
(d) Overall change due to the inverse spin Hall effect as a function of the
resonance frequency. . . . 66
Chapter 1
Introduction
1.1 Introduction and Motivation
Recent developments in production technology of semiconductor-integrating circuits make it possible to fabricate nano–scale metallic multi–layer films without deteriorating material quality. This enabled us to provide ideal platform for the study on transport and magnetic properties in ferromagnetic/non-magnetic hybrid structures with keeping high qualities. Owing to these developments, various phenomena in nano–sized ferromagnetic multi–layered systems have been investigated intensively.
One of the most important discoveries in this research field is the giant magnetoresis- tance (GMR) effect in ferromagnetic/non-magnetic multi-layered structures by A. Fert et al.[1] and P. Grunberg et al.[2], who are the Nobel Prize winners in 2007[3]. After the discovery of the GMR effect, many scientists have studied magnetoresistance effect in various metallic multi-layered system in order to find the large resistance change[4, 5].
Especially, S. S. P. Parkin demonstrated reading head application in the hard disk drive
1
based on the GMR effect[6]. Therefore, the research on the metallic multi-layer film has been strongly developed[7, 8].
Independently of GMR effects, a tunnel magnetoresistance (TMR) effect was discov- ered in a multi-layer structure consisting of two ferromagnetic electrodes sandwiching a thin insulating layer[9]. Thus, the magnetoresistance effect is still actively investigated at the present[10–14]. Especially, S. Yuasa et al. carried out an innovative demonstration that the ratio of the resistance change exceeds 100 % at the room temperature by using a MgO barrier[14]. This innovative demonstration opens up high performance magnetic random access memory and highly sensitive magnetic field sensor.
Apart from the magnetoresistance effects, there is another important phenomenon
related to the spin current and/or spin dependent transports. When a spin current en-
ters a ferromagnet, a transfer of the spin angular momentum between the conduction
electrons and the magnetization of the ferromagnet occurs because of the conservation of
the spin angular momentum. This is known as a spin transfer effect. The concept of the
spin transfer effect in a magnetic domain wall is introduced by L. Berger[15]. J. C. Slon-
czewski predicted that the magnetization can be reversed by the spin transfer effect in
the magnetic multi-layered system[16]. This phenomenon has attracted much attention
for a novel manipulation technique of the magnetization especially after the first experi-
mental demonstration that the magnetization reversal due to the spin transfer effect has
been achieved by using a Co/Cu/Co sandwich structure[17]. This magnetization switch-
ing due to the spin transfer effect can be an attractive alternative to the conventional
field induced switching in nano–scaled magnetic devices. Moreover, with the develop-
ment of the high–frequency measurement techniques, the magnetization dynamics such
1.1. INTRODUCTION AND MOTIVATION 3 as the steady state precession is found to be controlled by the spin transfer effect[18, 19].
Thus, the spin transfer effect opens up a new paradigm for magneto–electronic device applications as well as for understanding the fundamental spin physics.
As an opposite effect of the steady state precession due to the spin transfer effect, the spin current is found to be produced by the steady state precession. This is known as the spin pumping effect[20–26]. Since the steady state precession can be induced by the microwave irradiation with an appropriate frequency, the spin current can be generated from the microwave irradiation via the spin pumping effect. The method for generating the spin current based on the spin pumping effect is known as the dynamical spin injection. One of the most important advantages of the dynamical spin injection is that the spin current can be generated without flowing an electric charge current.
Moreover, the microwave irradiation can be performed wirelessly. So, this technique is an innovative way for creating spin current and has great potential in wireless power transmission.
On the other hand, recent studies on the spin-related physics pointed out that the
heat can produce the spin current[27–30]. Especially, in the magnetic multi-layered
structure, if the temperature gradient exists at the ferromagnetic metal/non-magnetic
metal interface, the spin current can be injected due to the spin-dependent Seebeck
coefficients[28, 30]. This is known as the thermal spin injection. Of course, I know that
the magnetization dynamics produces the heat because of the dissipation during the
magnetization damping although this heat is believed to be negligibly small. However,
if the temperature gradient across the ferromagnetic metal/nonmagnetic metal interface
is induced by this heating effect, the spin current could be generated. As a result, the
phenomena based on the spin pumping should be reconsidered. From this point of view, in this thesis, I focus on the interplay between the magnetization dynamics and heat.
Then, I investigate the influence of the heat on the dynamical spin injection.
1.2 Outline of the chapters
This thesis was carried out to clarity the influence of the heating effect during the magnetization dynamics and the dynamical spin injection. The experimental results consists of the chapters from 4 to 6 as shown in Fig. 1.1. A brief summary of each chapter is shown below,
• Chapter 1 presents an introduction and motivation of this thesis.
• Chapter 2 describes the theoretical background for this thesis.
• Chapter 3 provides the fabrication techniques and experimental methods for our samples.
• Chapter 4 show the excitation RF magnetic field intensity dependence of the res- onance properties during the ferromagnetic resonance (FMR) mode and the spin wave (SW) mode. As a result, I found that the magnetization precessional motion causes the warming of the ferromagnet. Moreover, the heat generation in the FMR mode was found to be larger than one in the SW mode.
• Chapter 5 proposes a quantitative evaluation method of the FMR heating effect
using the resistivity of the Cu electrode. The temperature increase ∆T due to the
FMR heating effect increases with increasing the FMR frequency because of the
1.2. OUTLINE OF THE CHAPTERS 5 suppression of the inhomogeneous broadening.
• Chapter 6 investigates the dynamical spin injection in the CoFeB/Pt bilayer struc- ture, in order to clarify the difference between the spin pumping effect and the thermal spin injection. From the analysis of the experimental results, I clarified that the thermal spin injection is dominant on the dynamical spin injection in our device.
• Chapter 7 gives conclusion in this thesis.
Figure 1.1: Flow chart of chapters in this thesis.
Chapter 2
Theoretical Background
2.1 Magnetization dynamics
By defining the magnetic moments in the ferromagnet as classical macro-spin vector M , namely magnetization, the time-dependence of the magnetization dynamics can be described by considering the torque T = M × H eff to the magnetization M caused by the effective magnetic field H eff , which could be written as following[31–33, 35–37]
dM
dt = γM × H eff . (2.1)
Here, γ =ge/2mc is the absolute value of the gyromagnetic ratio, g is the Lande g-factor. However, the magnetization dynamics attenuates in the finite time because of the damping torque. Therefore, the new equation was provided by adding the damping term to Eq. 2.1, the so-called a Landau-Lifshitz-Gilbert (LLG) equation[31–34]. A LLG equation is explained in the next section.
7
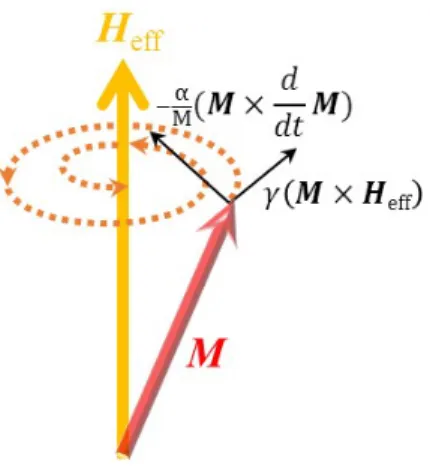
Figure 2.1: Schematic diagram of the magnetization dynamics.
2.1.1 Landau-Lifshitz-Gilbert equation
A phenomenological LLG equation could be described as following[31–34]
dM
dt = γ(M × H eff ) − α
M S (M × d
dt M ), (2.2)
where M S is the saturation magnetization and α is the dimensionless Gilbert damping constant, which depend on the ferromagnetic metal[40]. Equation 2.2 represents the relaxation process of the magnetization dynamics, where the first term and the second term are the precession term and the damping term for the attenuation process of the magnetization dynamics as shown in Fig. 2.1, respectively.
2.1.2 Resonant precessional motion of magnetization
A resonant precessional motion of the magnetization is one of the most well known
physical phenomena in the ferromagnetic metal. This phenomenon is called the co-
herent magnetization precession, namely ferromagnetic resonance (FMR) [33–37]. As
shown in Fig. 2.2, I consider the case of applying radio frequency (rf) magnetic field
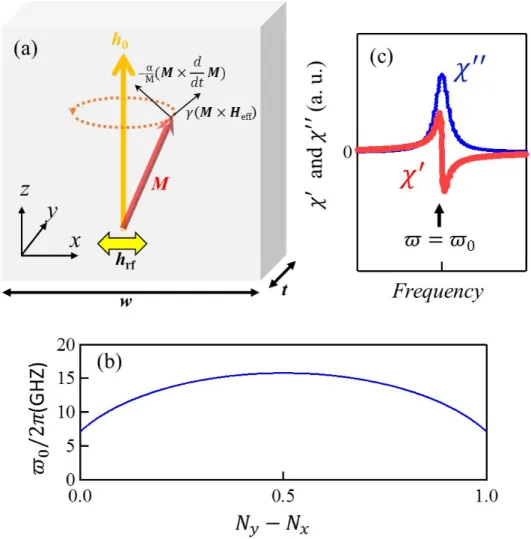
2.1. MAGNETIZATION DYNAMICS 9 h rf with an angular frequency ω (ω = 2πf : f is the frequency of the rf magnetic field irradiation) to the perpendicular direction to a static magnetic field h 0 applied to fix the magnetization direction. Components of the effective magnetic field are H eff = (h rf − N x m x , −N y m y , h 0 − N z m z ). Here, N x , N y and N z are the demagnetization factors, which depend on the shape of the ferromagnetic thin film and N x +N y +N z = 1.
If the ferromagnetic shape is the thin film as shown in Fig. 2.2(a), the N z can be ne- glected, then N x can be approximated by the N x ≈ t/w. Here, t and w is the thickness and the width of the ferromagnetic thin film, respectively. In the case of the magneti- zation precessional motion with the small cone angle, I can describe the time derivative of the magnetization dynamics M(t) as M (t) = (m x (t), m y (t), M S ). Substituting that into Eq. 2.2, I obtain
−iωm x = γm y (h 0 + N y M S ) − iωαm y .
−iωm y = γ(−m x (h 0 + N x M S ) + M S h rf ) + iωαm x .
(2.3)
Here, Eq. 2.3 can be rewritten using matrices.
−iω γ(h 0 + N y M S ) − iωα
−γ(h 0 + N x M S ) + iωα −iω
m x m y
= −γM S
0 h rf
. (2.4)
Setting h rf = 0 and α = 0, namely coherent precessional motion, I can obtain the Kittel equations[35],
ω 0 2 = γ 2 (h 0 + N x M S )(h 0 + N y M S ). (2.5)
ω 2 0 = γ 2 (h 0 + (1 − N y )M S )(h 0 + N y M S ). (2.6)
These give the resonance angular frequency ω 0 during steady magnetization pre-
cessional motion, namely FMR. Here, I noticed that the FMR frequency f res can be
controlled by the shape of the ferromagnetic metal because of the demagnetizing field.
Figure 2.2(b) shows the theoretical result of the demagnetizing factor N dependence of the FMR frequency f res in the NiFe thin film. In addition, it has also been experimen- tally proved by several reports[41–43]. This means that the FMR frequency f res can be controlled without the applied external magnetic field.
From Eq. 2.6, I can obtain the magnetic susceptibility tensor χ defined by m = χh rf and χ = χ
0+ iχ
00. The real part χ
0and the imaginary part χ
00of the magnetic susceptibility can be calculated by the following equation, respectively[44, 45],
χ
0= ω B ω M (ω 2 0 − ω 2 )
(ω 2 0 − ω 2 ) 2 + α 2 ω 2 (ω H + ω B ) 2 . (2.7) χ
00= αωω M (ω B 2 + 2ω 0 2 − ω 2 )
(ω 2 0 − ω 2 ) 2 + α 2 ω 2 (ω H + ω B ) 2 . (2.8) Here, α is the dimensionless damping constant. ω = 2πf , ω M = γµ 0 M S , ω H = γh 0 , ω B = ω H +ω M and ω 0 = √
ω B ω M . At the resonant condition (ω = ω 0 ), when the magnetic field is much smaller than the saturation magnetization (ω M ω H ), χ 00 ≈ (2ω M )/(αω 0 ).
Figure 2.2(c) show the real and imaginary part of the magnetic susceptibilities as a
function of the microwave frequency.
2.1. MAGNETIZATION DYNAMICS 11
Figure 2.2: (a) Schematic illustration of the coherent magnetization dynamics around
the direction of the applied magnetic field in the ferromagnetic thin film. (b) Demagne-
tization dependence of FMR frequency calculated from the Kittel equation. Here, the
saturation magnetization is 1T. (c) Calculated real and imaginary parts of the magnetic
susceptibilities as a function of the microwave frequency.
2.2 Anisotropic magnetoresistance effect
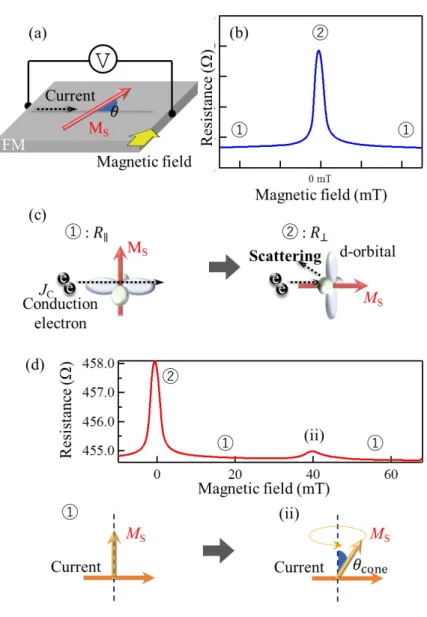
The band structures of the typical ferromagnetic metal, such as the Co or Fe, consist of the superposition of a degenerate 3d bands over a 4s band, and the density of states (DOS) at the Fermi level coexists with the 3d electrons and the sp-like electrons. The sp-like electrons, which are not polarized, are responsible for conduction around the Fermi level because of the small effective mass and the long mean free path. However, in the 3d band, since the up- and the down-spin bands are polarized, the DOS on the electrons are different. Therefore the conduction electrons are affected by the spin polar- ized 3d band. This is called the s-d scattering[46, 47]. The orbital of 3d-electron can be described by the wave function as shown in the Fig. 2.3(c). Moreover, it is changed with the magnetization direction of the ferromagnetic metal. As a result, the electrical resis- tance in the ferromagnetic metal changes with the magnetic field. This is a well-known effect called an anisotropic magnetoresistance (AMR) effect[48–51]. I demonstrated the conventional AMR measurement of NiFe thin film as shown in Figs. 2.3(a) and (b), re- spectively. Relative angle θ is defined as the angle between the magnetization M S and the conduction currents J C . I can clearly see the resistance increases around the zero field because the magnetization direction was changed from 1 state to 2 state as shown in Fig. 2.3(c). In addition, the magnetization dynamics can be easily detected using the AMR effect[52–56]. The resistance change due to the AMR effect of the ferromagnetic metal during the FMR is given by the following equation,
ρ(θ) = ρ k + ∆ρ cos 2 θ, (2.9)
where, ρ k is the resistivity of NiFe, when the conduction current is a parallel to the
2.2. ANISOTROPIC MAGNETORESISTANCE EFFECT 13 magnetization, and ρ ⊥ is the resistivity of a perpendicular state. The ∆ρ = ρ ⊥ − ρ k and the θ cone = π/2 − θ is the precessional cone angle of the magnetization dynamics.
As shown in Fig. 2.3(d), I demonstrated that ferromagnetic resonance can be detected
by measuring the external magnetic field dependence of electric resistance of the NiFe
narrow wire under the microwave irradiation. From the resistance change by FMR, the
precessional cone angle θ cone of FMR was estimated to be about 10 degrees.
Figure 2.3: (a) Illustration of the measurement method for the typical anisotropic mag-
netoresistance in the ferromagnetic metal. (b) Schematic image of the resistivity changes
due to the s-d scattering. (c) Resistance of the NiFe thin film as a function of the exter-
nal magnetic field. (d) Resistance of the NiFe narrow wire as a function of the magnetic
filed under the microwave irradiation with the power of the 100 mW and the schematic
image of the resistivity change at the resonance state.
2.3. DYNAMICAL SPIN INJECTION (SPIN PUMPING EFFECT) 15
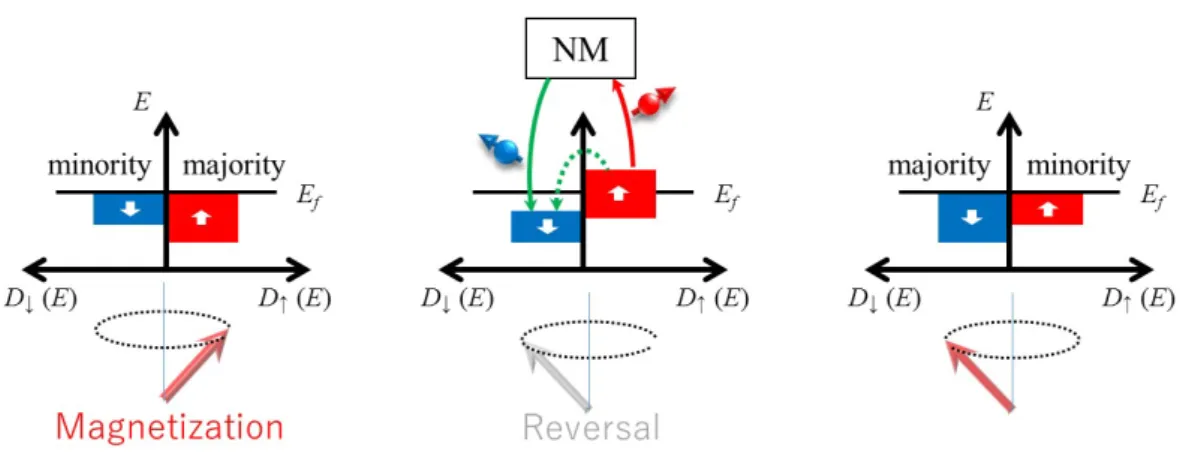
Figure 2.4: Populations of up- and down-spin bands during magnetization dynamics.
2.3 Dynamical spin injection (Spin pumping effect)
Recently, the spin pumping effect means the generation of the spin current by the mag-
netization dynamics from the ferromagnetic metal into the non-magnetic metal. This
effect described by J. C. Tserkovnyak et al.[24, 22]. Figure 2.4 schematically shows the
simple image of the mechanism for spin current generation due to the spin pumping
effect in the ferromagnet/non-magnet bilayer structure. In the ferromagnetic metal,
the magnetism is caused by the larger population of the spin (majority spins) and the
small population of the spin (minority spins). If the magnetization direction is suddenly
switched, the bands shift in the energy momentarily. However, in order to return to the
equilibrium situation, there have to be a spin transfer from on spin population to another
one (spin relaxation)[56]. If the ferromagnet is attached to the non-magnetic metal, spin
relaxation occurs through the non-magnetic metal. Thus the spin-relaxation process of
the ferromagnetic metal is modified when it is contact with an adjacent non-magnetic
metal, and depends on the spin-relaxation properties on the non-magnetic metal. More- over, this means that when a ferromagnetic metal is attached to a non-magnetic metal during the ferromagnetic resonance (FMR), an oscillating spin current is emitted into the non-magnetic metal. J. C. Tserkovnyak et al.[24, 22] found that dc spin current is also generated in addition to the oscillating spin current by numerically analyzing the spin pumping effect in the ferromagnet/non-magnet bilayer structure during the FMR. As shown in Fig. 2.5(a), the spin current is accumulated at the ferromagnet/non- magnet junction due to the resonance precessional motion of the magnetization dynam- ics, and then the spin current is diffused into the non-magnetic metal. According to the reference[24, 56, 57], the generated spin current into non-magnetic metal by the spin pumping effect is simply described by the following equation.
I s F = ~
4π g ↑↓ (M × d
dt M), (2.10)
where, g ↑↓ is the real part of the mixing conductance[58, 59]. Equation 2.10 indicates that the spin current I s F induced by spin pumping effect, which goes into the non- magnetic metal, is perpendicular to both the magnetization direction M and change in dM/dt. The spin current I s F has ac- and dc-components, however, the time-average of the spin current I s F given by R
1 f