Working Paper
FACULTY OF ECONOMICS UNIVERSITY OF TOYAMA
3190 Gofuku , Toyama 930-8555 JAPAN
Tulip Bulb Industry in Japan since 1988
Yasutaka Niisato
Working Paper No.239 December 2008
1
Tulip Bulb Industry in Japan since 1988
Yasutaka Niisato
∗Abstract
The plant quarantine measures for tulip and lily bulbs were abolished in 1988. A removal of the quarantine made Japanese bulb growers face international competition in the markets. Since then the imports of bulbs, mainly from Holland, increased rapidly and bulb prices tended to decline gradually, while the Japanese production of bulbs did not decrease. The imports also introduced new varieties of bulbs to Japan. The demand for tulip bulbs increased greatly until the late 1990s, but in the 2000s the Japanese bulb markets stagnated. Bulb prices decreased, and the domestic production of bulbs decreased sharply, which caused a great reduction in the number of bulb farmers. Consequently, the rate of self-sufficiency for producing tulip bulbs in Japan decreased from 80% in 1988 to 20 % in 2006, even though the volume of imported bulbs decreased in the 2000s. This paper analyzes the demand and supply conditions of tulip bulbs, and reports estimates of the Japanese demand and supply functions of tulip bulbs by regression analysis. Demand depends upon the real price (in terms of consumption goods) of tulip bulbs negatively and the real national income positively, and shows that the demand curve shifted forward until 2001, and then shifted backwards. Domestic supply depends upon the prices of tulip bulbs and the rice prices positively.
Keywords: flower bulb, production, import, consumption, demand, supply, price JEL Classification: Q11
∗
Faculty of economics, University of Toyama, 3190 Gofuku, Toyama 930-8555, Japan,
e-mail: [email protected]
2 INTRODUCTION
The plant quarantine measures for tulip and lily bulbs were abolished in 1988.
Since then the imports of tulip bulbs, mainly from Holland, increased rapidly and bulb prices tended to decline gradually. Japanese demand for flower bulbs increased greatly until the late 1990s, but in the 2000s the Japanese bulb markets stagnated. Bulb prices decreased, and the domestic production of bulbs decreased sharply, which caused a great reduction in the number of bulb farmers. In fact, the rate of self-sufficiency for producing tulip bulbs in Japan decreased from 80% in 1988 to 20 % in 2006, even though the volume of imported bulbs decreased in the 2000s.
In this paper, I will review the statistical data and examine the demand and supply conditions of tulip bulbs. I will estimate the Japanese demand function for tulip bulbs by regression analysis. Demand depends upon the real price (in terms of consumption goods) of tulip bulbs negatively and the real national income positively, and shows that the demand curve shifted right-forward until 2001, and then it shifted backwards. I will estimate the supply function and show that domestic supply depends upon the prices of tulip bulbs and the rice prices positively.
As Ohkawa (2005) stated, tulips and lilies are very important for Japanese bulb plants. He described their brief histories and developments until 2001. Table 1 shows the current status of Japanese bulb production in 2005, while Ohkawa showed the same table in 2001. In 2005 the production area of all bulbs is around 600 hectares (ha), which has reduced by more than about 200 ha since 2001. The tulip area is around 300 ha, which has reduced by more than about 100 ha. The lily area is 100 ha, which is just half of the space that lilies occupied in 2001. The turnover of all bulbs is 2,900 million yen, which has reduced by 1,800 million yen since 2001. The turnover of tulip and lily bulbs has also reduced considerably.
Buschman (2005) gave a general view of global trade and production of flower bulbs all over the world. Niisato (1999) made a comparative study of the flower bulb industries in Japan and Holland. This paper focuses on the Japanese tulip bulb industry, and analyzes its development and changes since 1988.
TRENDS OF PRODUCTION, IMPORT AND CONSUMPTION
In 1988, the plant quarantine measures for tulip bulbs were abolished. The aim of the quarantine was to keep the country’s own bulb-growing industry free from diseases.
After 1988 the inspection of plants was to be conducted in the Netherlands. A removal of the quarantine made Japanese bulb growers face international competition in the markets.
Many bulbs came from the Netherlands because Dutch tulip bulbs were very cheap. At that time it was assumed that the Japanese production of tulip bulbs would decrease and disappear in a few years because the Dutch bulb cost was one- third of the Japanese cost.
However, in the early 1990s the Japanese production did not decrease as much as expected. Moreover, the bulb price did not decrease but increased. ‘Green wave’ and
‘gardening boom’ came into Japan, whereas the Japanese economy was under depression after the ‘bubble economy’. However, the long depression that resulted after the ’bubble’
burst stopped the flower and bulb boom and the bulb price decreased and the imports of bulbs declined.
Fig.1 shows trends of domestic production, import and consumption of tulip bulbs in Japan. In 1988, the Japanese domestic production of tulip bulbs was around 130 million in volume and increased to 135 million in 1993. After 1993, it decreased year after year and decreased to about 50 million in 2006. This is about 40% of the production during 1993, the peak year.
The trend of production area of tulip bulbs shows almost similar to the
3 production (see Fig.2). The production area was 449 ha in 1988, increased to 565 ha in 1993, and decreased to 261 ha in 2006. Important production areas are Toyama and Niigata prefectures. They have more than a 95% share of the total production area and the volume of tulip bulbs produced (see Table 2).
1n 1988 the volume of tulip bulbs imported was 34 million bulbs, which was one-fourth of the domestic production. Since then the volume of tulip bulbs imported increased and exceeded the domestic production in 1995. Moreover, it amounted to 277 million in 2001, which was 8 times of that in 1988. But in 2006, it declined to 205 million.
Tulip bulbs were imported from the Netherlands (99% of the imported bulbs) and New Zealand (1%) in 2006. The imports from New Zealand started in 2001.
As shown in Fig.3, the number of tulip bulb growers was 1,480 farms in 1988.
This number decreased steadily to 421 farms in 2006, which is one-third of the 1988 level.
The average area of the cultivation in tulip bulbs increased steadily from 0.3 ha, but it is stable at around 0.6 ha in the 2000s.
As shown in Fig.1, Japanese consumption of tulip bulbs, which was defined as a sum of the domestic production and import volume, increased until 2001 and amounted to 360 million from 160 million in 1988. In 2006, it declined to 255 million. Moreover, the self-sufficiency rate of tulip bulbs decreased to 20 % in 2006 from 80% in 1988.
The development of the average price of Japanese tulip bulbs, at the wholesale level, is shown in Fig.4. The average price increased to about 23 yen until 1992. After 1992, although the average price recovered a little in 1996, it decreased to 15 yen (i.e.
35% decrease from the peak) in 2002 and was almost stable in the 2000s.
DEMAND CONDITIONS
In general, demand for goods depends upon own price, the prices of substitutes and complements, and consumers’ incomes as well as their preferences. Preference means their attitude of consumption, life style and culture. Flowers and bulbs are luxury goods and their income elasticity is more than one.
In the late 1980s, the Japanese economy was in a boom: what we called ‘Bubble economy’. At this time people spent money on floricultural products in excess of their increasing incomes. Furthermore, the Japanese were in a new stage of consumption, and the life style and culture of young Japanese were changing at that time.
In 1988, the abolition of quarantine rules regarding tulip and lily bulbs caused a drastic increase in tulip and lily bulb imports and also introduced new varieties of flower bulbs to Japan. In 1990, the International Garden and Greenery Exhibition in Osaka was held successfully. From 1988 to 1991, the imported bulbs increased sharply. After 1990, the ’green wave’ and ‘gardening boom’ came to Japan, whereas the bubbles of stock and land prices burst and the Japanese economy was under the depression of the ‘lost 10 years’. At that time, it was assumed that the Japanese economy went in mutuality and the Japanese culture of flowers had changed, and most people bought more flowers and bulbs on several occasions. The prices of flowers and bulbs were cheap and stable owing to an increased number of imports. However, the stagnation of the Japanese economy as a whole became more serious after 2001 and people stopped spending money on flowers and bulbs.
Fig.5 shows a configuration of the real price, P, (in terms of consumption goods)
and consumption quantity, C, of tulip bulbs during 1988 to 2006. In the figure, lnX means
natural logarithm of X. The source of the price index of consumers’ goods is the Ministry
of Internal Affairs, Japan Statistical Yearbook 2008. I will analyze the demand side. Until
1992, the price and the transacted quantity of tulip bulbs increased. From 1992 to 1994,
the quantity did not change much and the price decreased. From 1994 to 1998, the real
4 price was relatively stable and the quantity increased. From 1998 to 2001 the price declined and the quantity increased. From 2001 to 2006, the real price was stable at the low level and the quantity decreased.
Fig.6 shows a time series of Japanese real national income, Y (defined as the nominal national income at factor cost deflated by consumers’ price index). Considering the movement of real national income, in a broad sense, the demand curve for tulip bulbs moved right-forward with increasing income. From 1992 to 1994, the real income stagnated and the demand curve stopped moving. From 1994 to 1997 the income recovered a little and the demand curve moved again. From 1997 to 2001, the real income decreased and the demand curve remained constant. From 2002 to 2005 the real income recovered a little but the demand decreased. In those years, the ‘Koizumi Structural Reform’ (from April 2001 to Sep 2006) might have led to such pessimistic expectations that decline in future income would pull back the demand curve.
The demand function over the period 1988 to 2005 is estimated by regression analysis as follows:
lnC = - 1.819lnP + 4.803lnY - 0.337DM
1- 50.54 (- 6.19) (4.83) (- 3.41) (- 4.04) R
2= 0.733 DW = 1.47
where DM
1: dummy variable for years from 2002 to 2005.
This equation means that the price elasticity is around 1.8 and the income elasticity is around 4.8. Therefore, a 10% decrease in the price makes a 18% increase in consumers’ bulb demand (in volume) and a 8% increase in their expenditure (in monetary terms) on tulip bulbs. A 10% increasing income accounts for a 48% increase in bulb demand. In addition, the demand curve for tulip bulbs moves with the real national income, Y. Broadly speaking, the demand curve shifted right-forward from D
1to D
2from 1988 to 2001 and shifted backwards to D
3after 2001.
SUPPLY CONDITIONS
In this section, I will analyze the supply side. The supply of tulip bulbs in the Japanese market comes from the domestic production and imports. The trading companies are Japanese and Dutch companies. More than half of the imported bulbs are forced bulbs for cut-flower growers. The imports of forced bulbs depend upon the expected demand and production conditions of cut-flowers of tulips as well as the imported price. The imported price depended on the guilder-yen exchange rate until 2001, and after that on the euro-yen exchange rate as well as the international price. Japanese yen was appreciated with respect to Dutch guilder until 2000 (around 70 yen per guilder in 1988 to 40 yen per guilder in 2001). The Japanese yen depreciated steadily with respect to the euro during the 2000s (around 100 yen per euro in 1999 to 160 per euro in 2006). The recent exchange rate trend raised the imported price and was apt to reduce the imports.
Japanese imports of tulip bulbs are a small portion of the world’s trade (likely to be less than 10%). Therefore, we can assume that Japanese consumers accept the international prices given and import bulbs according to their demand.
Fig.7 shows a configuration of the real price, P, (in terms of consumption goods)and the domestic production , Q, of tulip bulbs. The figure shows that the domestic supply curve is upward sloping, like the S line. The supply obviously depends upon the other factors also: weather conditions, labour wages, capital costs and rice prices, especially in the case of Japanese agriculture.
According to Tachi and Niisato (2007), in 1999 a farmer in Toyama had three
growers: the farmer, his wife and his mother. He employed part-time workers for 1,700
man-days a year. He had 12.7 ha of cultivation area and rented 11.4 ha of the area. He
5 cultivated tulip bulbs in 6.8 ha and rice in 5.5 ha. He had four tractors for bulb and rice growing, and planting, and sprayer and harvesting machines for the bulbs. He produced 1,400,000 tulip bulbs, and the sales value was 30,000,000 yen. He was a specialized bulb farmer. Most of the Japanese bulb growers are such family managers and rice producers.
The domestic supply curve for tulip bulbs is estimated by regression analysis over the period 1988 to 2006 as follows:
lnQ = 1.667lnP + 0.763lnRP + 0.379DM
2- 3.970 (5.94) (3.037) (6.31) (- 5.98) R
2= 0.942 DW = 1.36
where RP: rice price (in the previous year) in terms of consumption goods and DM
2: dummy variable for years from 2000 to2002. The source of the rice prices is MAFF, Statistics on Agricultural Prices.
Basically, domestic suppliers reduce their production according to the decreasing bulb price. The price elasticity of the supply is around 1.7, which means a 10% price decrease cause a 17% decrease in domestic production. Cross elasticity to rice prices is 0.76, which means a 10% rice price decrease causes a 7% decrease in bulb production.
Excellent weather conditions in the spring of 2000 caused an ample harvest, adverse weather conditions during the planting season in autumn of 2002 caused a poor harvest in the spring of 2003. Therefore, the dummy variable is introduced.
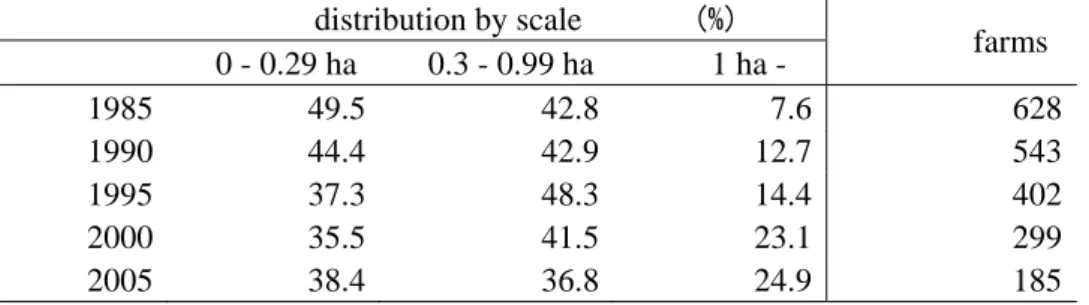
The numbers and scale distribution of bulb farms in Toyama is shown in Table 3 (more than 90% farms grow tulip bulbs).The total number of farms declined dramatically, such that the number of farms in 2005 was less than one-third of the number in 1985. The large farm’s share shows signs of increasing. But during the 2000s, the number of large farms did decrease, which means that even large farms did not earn enough income to grow tulip bulbs. Because of the decreasing price of tulip bulbs, some of these farms have shifted to cut-flower production, and some have given up producing tulip bulbs.
CONCLUDING REMARKS
From our estimated Japanese demand function for tulip bulbs, it is clear that the demand basically depends upon the price of tulip bulbs and the national income. The demand curve moves with the current national income, but the expected future income is also important. The reduction of the demand during the 2000s might have been due to the Japanese consumers’ pessimistic expectations of the future Japanese economy.
According to our estimation of the domestic supply curve of Japanese tulip bulbs, Japanese bulb production clearly depends upon bulb prices and rice prices positively. The bulb prices are greatly affected by the international market price and the foreign exchange rate. We discussed neither the determination of the international price of bulbs, nor the competitiveness of the Japanese tulip bulb industry. This would require more detailed information about the production cost conditions of the Japanese and Dutch bulbs.
ACKNOWLEGMENTS
I would like to thank Mr. A. Fujioka at Toyama Bulb Growers Association, Mr.
M. Toyoshima at Niigata Flower Bulb Growers Cooperative Association, and Mr. O.
Urashima and Mr. Y. Ban at Agricultural, Forestry and Fishery Division of Toyama prefecture for useful information of bulb growers.
Literature Cited
Busuchman, J.C.M. 2005. Globalisation – Flower – Flower Bulbs- Bulb Flowers. Acta Hort. 673: 27-33.
Ministry of Agriculture, Forestry, and Fisheries (MAFF). Statistics on Production and
6 Shipment of Flowers and Plants (Kaki Seisan shukka Toukei).
www.tdb.maff.go.jp/toukei/a02smenu?TouID=F007
Ministry of Agriculture, Forestry, and Fisheries (MAFF). Statistics on Agricultural Prices (Nougyou Bukka Toukei).
www.tdb.maff.go.jp/toukei/a02smenu?TouID=E013
Ministry of Internal Affairs. Japan Statistical Yearbook (Nihon Toukei Nenkan), 2008.
www.stat.go.jp/data/nenkan/
Ministry of Treasury. Trade Statistics (Boueki Toukei).
www.customs.go.jp/toukei/info/index.htm
Niisato, Y. 1999. Flower Bulb Industry in Japan and Holland: Trade and Production.
Working Paper.188. Faculty of Economics, Toyama University.
Ohkawa, K. 2005. Production of Flower Bulbs and Bulbous Cut Flowers in Japan- Past,Present, Future. Acta Hort. 673: 35-43.
Tachi, S. and Niisato, Y. 2007. Time Budget of Tulip Bulb Farmers in Japan and Holland:
in Busy Season. Working Paper.215, Faculty of Economics, University of Toyama.
Toyama prefecture. Horticulture of Toyama (Toyama no Engei), 2007.
7 Tables
Table 1. Current status of Japanese bulb production (2005).
Item All Bulbs Lily Tulip
Production Area(ha) 597 100 282
Turnover(
×100 million yen) 29 5 9
Number of Producers 1,660 422 464
Number of Bulb Produced(
×10,000) 17,100 1,340 5,350
Average Production Area(ha) 0.360 0.237 0.608
Number of Bulb Exported(
×10,000) 189.7
Number of Bulb Imported(
×10,000) 53,648 16,849 21,726 Source: MAFF, Statistics on Production and Shipment of Flowers and Plants.
Ministry of Treasury, Trade Statistics.
Table 2. Tulip Bulb Production of Toyama and Niigata (2005).
Item Toyama Niigata
Production Area(ha) 141 129
Turnover(
×million yen) 459 440
Number of Producers 149 264
Number of Bulb Produced(
×1,000) 27,223 25,200
Average Production Area(ha) 0.946 0.489
Source: MAFF, Statistics on Production and Shipment of Flowers and Plants.
Table 3. Distribution and number of farms in Toyama.
distribution by scale (%)
farms 0 - 0.29 ha 0.3 - 0.99 ha 1 ha -
1985 49.5 42.8 7.6 628 1990 44.4 42.9 12.7 543 1995 37.3 48.3 14.4 402 2000 35.5 41.5 23.1 299 2005 38.4 36.8 24.9 185
Source: Toyama prefecture, Horticulture of Toyama.
Figures
0 50 100 150 200 250 300 350 400
1988 1990 1992 1994 1996 1998 2000 2002 2004 2006
bulbs (x million)
consumption import production
Source: MAFF, Statistics on Production and Shipment of Flowers and Plants.
Ministry of Treasury, Trade Statistics.
Fig.1. Production, import, and consumption.
8
0 100 200 300 400 500 600
1988 1991 1994 1997 2000 2003 2006
ha
Source: MAFF, Statistics on Production and Shipment of Flowers and Plants.
Fig.2. Production area of tulip bulbs.
0 200 400 600 800 1000 1200 1400 1600
1988 1990 1992 1994 1996 1998 2000 2002 2004 2006
men
0.00 0.10 0.20 0.30 0.40 0.50 0.60 0.70 growers average area ha
Source: MAFF, Statistics on Production and Shipment of Flowers and Plants.
Fig.3. Growers and average area.
0 5 10 15 20 25
1988 1990 1992 1994 1996 1998 2000 2002 2004 2006
yen
Source: Toyama Bulb Growers Association.
Fig.4 . Average price of Japanese tulip bulbs.
9
2.60 2.70 2.80 2.90 3.00 3.10 3.20
5.00 5.10 5.20 5.30 5.40 5.50 5.60 5.70 5.80 5.90 6.00
lnC lnP
88
90
92
94 96
98
01 06
D
1D
2D
304
Fig.5. Price, consumption and demand curves for tulip bulbs (1988-2006).
lnY
12.65 12.70 12.75 12.80 12.85
1988 1990 1992 1994 1996 1998 2000 2002 2004
Source: Ministry of Internal Affairs, Japan Statistical Yearbook.
Fig.6. Real national income.
lnP
2.60 2.70 2.80 2.90 3.00 3.10 3.20
3.50 3.70 3.90 4.10 4.30 4.50 4.70 4.90 5.10
lnQ
06
02 98
92
S
88