九州大学学術情報リポジトリ
Kyushu University Institutional Repository
能動的デブリ除去ターゲットの時間効果のある選択 のための基準
メリッサ, ゼムラ
https://doi.org/10.15017/1866314
出版情報:Kyushu University, 2017, 博士(工学), 課程博士 バージョン:
権利関係:
PhD. Graduation Thesis
Criteria for a Time-effective Selection of Active Debris Removal Targets
Mélissa Zemoura
September 2017
Kyushu University, Fukuoka, JAPAN Graduate School of Engineering,
Department of Aeronautics and Astronautics,
Space Systems Dynamics Laboratory
Nomenclature & Abbreviations ………. 4
1. Introduction ………. 5
a. Background & Motivations ……… 5
b. Structure of the study ………. 8
2. Tools used to conduct the study ………... 10
a. Environment evolutionary model ……… 10
i. Initial population in year 2009 and Assumption on launch traffic ………. 10
ii. Collision probability and Settings for occurring events in the simulations …... 12
b. Statistical analysis concerning the number of MC runs for the study …. 16 c. Tracking program for the identification of debris’ origins ………... 18
3. Identification of removal targets to secure future Earth-Moon trajectory mission in 2045 ……….. 22
a. Presentation of general identification procedure ………... 23
b. Detailed scheme for origin’s identification in one-case simulation …….. 24
c. Average of all Monte-Carlo simulations ………. 29
d. Results from the average of the 100 Monte-Carlo simulations …………. 30
e. Assimilation to existing objects (objects catalogued with their International designator) ……….. 32
f. Suggestion for possible improvements to strengthen the reliability of the study ………. 34
g. Conclusive part ……….. 34
4. Preliminary observations that motivated the study concerning
ADR target selection and classification ……….. 35 a. Explanation of the whole research approach ………. 35 b. Motivations under the orientation of the whole research
(preliminary study) ………... 35
5. Selection and classification of ADR targets according to the resulting
impacts of their removal on long-term evolution of LEO population ………….. 37
6. Selection and classification of ADR targets according to the resulting
impacts of their removal on short-term evolution of LEO population ………… 41
7. Selection and classification of ADR targets according to the resulting
impacts of their removal on mid-term evolution of LEO population ………….. 47
8. Comparative study between short, mid and long terms to define
adequate criteria for an efficient targets’ selection at each period ……….. 54
9. Conclusion and perspectives ……… 59
Appendices ………... 61 Appendix A: Identifying the origin of collision fragments
– example case of the 90
thMonte-Carlo simulation ………... 61
Appendix B: Complementary analysis through a brief reflection on the stability of the ranking criterion among the simulations (complement for
Parts 4 to 8 concerning target-selection studies) ……….………... 63 Appendix C: Main improvements and corrections made for the environment evolutionary model NEODEEM (programming and description) ………... 64
Bibliography ……..……… 70
Acknowledgments..……… 72
Nomenclature & Abbreviations
ADR Active debris removal
DEB Debris (either from on-orbit collisions or explosions)
ESA European Space Agency
Expl. Explosion
GEO Geostationary orbit
IADC Inter-agency Space Debris Coordination Committee
ID International Designator (number attributed to an object after launch in order to identify it all over its period of presence in space)
Incl. Inclination of the orbit (in degrees) JAXA Japan Aerospace Exploration Agency
LEO Low-Earth orbit
MC Monte-Carlo
MRO Mission related object (complementary object within the launch, that is excluding payload and rocket’ upper stage)
NASA National Aeronautics and Space Administration
Nb. Number
NEODEEM Near-Earth Orbit Environment Evolutionary Model
ODQN Orbital Debris Quarterly News (magazine that records all events occurring in space within three months, at each publication - provided by NASA) PMD Post-mission disposal
RAAN Right ascension of the ascending node (one of the 6 orbital elements, expressed in degrees)
R/B Rocket body
S/C Spacecraft (either payloads, or space shuttles)
TLE Two Line Elements (characteristics of a catalogued object’s orbit)
1. Introduction
a. Background & Motivations
Since the launch of Soviet Sputnik satellite in 1957, the number of objects in orbit around the Earth has kept increasing. With time, many objects have become non operational anymore, but have remained on their orbit. Now, the proliferation of these debris appears as a real problem for human missions in space, due to higher collision risks with operational spacecrafts and threats for astronauts’ life. In this context, it has become necessary to proceed to remediation activities in order to keep a control on the future population of objects around the Earth before the situation reaches a non-return state. Mainly, this whole research, dealing with the understanding of removal conditions, has been triggered and oriented both by previous own observations and by space agencies’ previous studies and requirements, as detailed from now.
First, the progressive growth of the population has led to a congestion of mostly used orbits, mainly the LEO-altitude orbits and GEO-altitude orbits. Together with this phenomenon linked to the formation of high- density zones, the risk of on-orbit collisions is rising more and more everyday in these highly populated areas.
This fact has been recently observed through the record of collisions that occurred between catalogued objects.
The first recorded collision happened in 1991 (see Table 1 for the references). This is the first time such an event could be identified, which proves that the space environment has recently become critical, with the increase of the objects present in near-Earth orbits. From this date, the number of on-orbit accidents due to collision events has kept increasing, reaching the number of nine events until 2013. Table 1 gathers information about the collision events that could be recorded from 1991 until now. Data have been updated as of August 2016, mainly concerning the number of remaining debris on orbit. Furthermore, the number of catalogued debris includes the colliding objects’ parts and the fragments on their original orbit.
Table 1. Information on recorded collisions Two main concerns can be raised from the information provided in Table 1.
First, from the first collision in 1991, the frequency of the catalogued events has become higher until 2013, occurring at closer dates along the period since an event occurred at a rate of one per 6 years, whereas this rate is nowadays at one per 2 years: 1991, 1996, 2002, 2005, 2009, 2011 and 2013. In addition, the number of collisions per year has also increased, from “only” one event at the first dates (1991, 1996, 2005) to two events nowadays (2002, 2009, 2013). This is a dramatic observation since the more the collision rate increases, the more the number of fragments increase, leading to higher risks of new collisions through the phenomenon of chain collisions.
Then, it should be noticed that the most impactful collision occurred in February 2009 between COSMOS 2251 and IRIDIUM 33 satellites, generating more than a thousand fragments in space; as specified in Table 1, most of them are still present in orbit today, increasing the risk of new possible collisions in the future. Moreover, this collision contributed to rank COSMOS 2251 and IRIDIUM 33 respectively at the second and the fourth positions in the Top 20 list of objects generating debris during a breakup event.
The consideration of this new phenomenon, well known now as the Kessler syndrome, represents thus a first trigger to this study, by underlying the necessity to build and start immediately a precise process that will enable to provide a safer space environment.
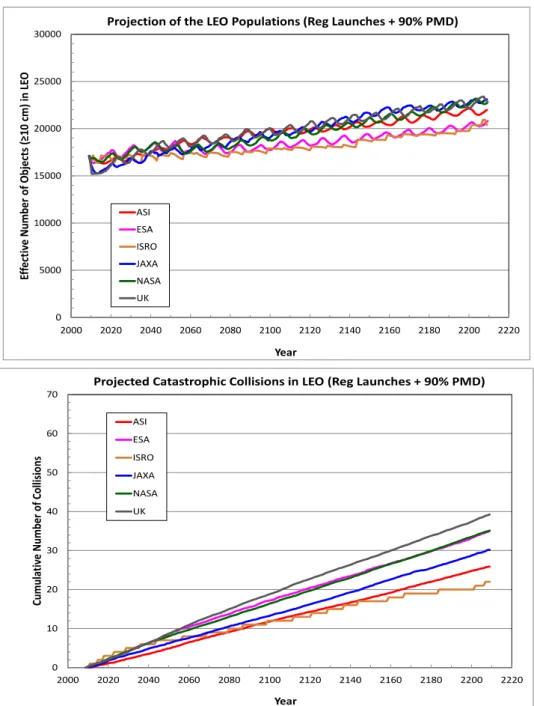
Secondly, and taking as basis, inter alia, the previous observations, all space entities are aware of the threat due to the growth of debris population. Until now, major work has been done to encourage the development of passivation methods such as PMD on payloads or rocket upper stages [1, 2]. However, in view of the rapid degradation of the space environment, performing remediation processes, like active debris removal, appears necessary [3] to complement the efforts of passivation processes; mainly Liou et al. [4] compared three different scenarios for the evolution of LEO environment: PMD only; combination of PMD and ADR of 2 objects per year; combination of PMD and ADR of 5 objects per year. Their results are represented through the well-known graph of Fig. 1 [4].
Figure 1. Comparison of three different scenarios for the evolution of LEO environment (PMD 90%
assumed): PMD only; combination of PMD and ADR of 2 objects per year; combination of PMD and ADR of 5 objects per year
This graph shows that performing only a post mission disposal (PMD), even in the best case at a 90% success rate, is not enough to control the growth of the future population [3, 5]. Performing a complementary active debris removal appears therefore as a requirement, and the number of objects to be removed also enters into consideration since it is noticeable that the future population is expected to remain stable from a rate of at least five removed objects per year, under the consideration of a very high PMD rate (90 %), which is an optimistic scenario, but not necessarily the most realistic one [6, 7, 8].
Now the emergency to proceed to ADR has been underlined, and since the technology to do so is under development and nearly at disposal as explained by Wormnes et al. [9], or as it can be seen through technology demonstration by entities such as D-Orbit Srl., Astroscale PTE. LTD., Surrey University (see ESA website about e.Deorbit [10]), the importance is then to identify and select the targets that would enable the most efficient removal process in terms of time and objects’ number. Therefore, using as a base support the results from these previous researches, the aim of this study is to take consideration of the number of removed objects, the importance of their on-orbit location, and various parameters presented later in order to point out which objects should be chosen so as to perform an efficient removal in terms of impact on the future LEO population.
To choose the appropriate targets, it was first necessary to better understand the lying phenomenon under the predicted change in the evolution of the future space environment. To do so, a preliminary study was conducted over 200 years, considering the best PMD case scenario of 90% success rate in order to focus on the impacts of a combined ADR process. Precisely, the IADC Working Group 2 - Action Item AI27.2 – conducted this study in 2012, using an initial population recorded on May 1st 2009 (see [3, 14] for more details). The projections were performed by all the agencies under the same assumptions: a PMD rate set as 90%, a continuation of launch traffic (based on a 2001-2009 traffic cycle) and no explosions in the future. Figure 2 shows the results gathered by the six participating agencies, known as ASI (Italian space Agency), ESA (European Space Agency), ISRO (Indian Space Research Organization), JAXA (Japan aerospace Exploration Agency), NASA (National Aeronautics and Space Administration) and UK (United Kingdom Space Agency) [3].
Through Figure 2 [3], Liou et al. provided results coming from all the 6 agencies’ models concerning the projection of LEO population and the number of catastrophic collisions in LEO.
Figure 2. Evolution of future LEO population (up) and cumulative number of collisions (down) according to 6 agencies’ models under no ADR assumption and PMD 90% success rate
By looking at Fig. 2, it is obvious that all the 6 agencies’ models predict the same behaviour for the LEO population in the future, showing an increase of the number of objects, and clearly linked this trend to the continued increase of catastrophic collisions between on-orbit objects, leading to more and more fragments in the future. The fact that each agency was free to use its own evolutionary model proves that these conclusions are independent from the model. In other words, the problem of collision events lying under the increase of the future population is a reality that has been put in evidence, which fully justifies the orientation and the motivation of this research.
Now the motivation and the process of this study are underlined, a more detailed presentation of the tools used to conduct it, together with the methodology adopted, is done in the next sections, after a brief explanation concerning the structure of this paper in the following sub-section.
b. Structure of the study
This thesis is structured within nine parts, including the present introduction and the conclusion. The structure is summarized in Figure 3.
Figure 3. Structure of the thesis paper
The contents of each chapter, including this introduction, are now independently presented.
The introductive Chapter 1 presents the background that motivated the whole study detailed in this thesis. The aim in this part is both to underline the necessity to conduct such a research focusing on removal conditions and taking great care to improve the future space environment; and to define the structure of the present paper in order to make the difference between the two studies that were conducted as clear as possible.
Chapter 2 presents the tools necessary to conduct the whole study. It is divided in two sub-sections, each dedicated to one tool. The first tool is the space environment evolutionary model called NEODEEM; it is described together with the settings adapted to the different conditions, the inputs and the outputs required for its use. The second tool is the debris’ origin tracking program, and a particular care is given to its description since this tool was developed entirely during this Doctoral research for the purpose of the different studies conducted inside. Examples of use are also provided.
Concerning the following parts, this Doctoral research is divided in two main general studies, as it is represented in Figure 3. The two studies can be considered independently, however they are gathered in this
thesis because they follow the same motivation by looking for an adequate remediation way to secure a targeted future. Therefore, in the structure of this paper, Chapter 3 should be considered independently from the block of Chapters 4 to 8.
Chapter 3 presents the study jointly conducted with Astroscale PTE. LTD. It deals with the evaluation of collision risks for a lunar spacecraft on its trajectory to the Moon. After calculating the probability of collision with any space objects around the Earth, a ranking of the most probable collision-inducing objects was set up in order to determine the current targets prior to be removed in the context of the mission.
Chapters 4 to 8 present another study, jointly conducted with JAXA. These chapters are linked together and show the evolution of the whole research through the results obtained at each step (and presented in each corresponding chapter) until the final comparison analysis.
Chapter 4 can be considered as the introductive part of the whole study dealing with the determination of adequate criteria for a removal targets’ selection to match a given period of observation. It mainly presents the motivations that triggered this study, conducted through a very particular orientation. The whole study tries to evaluate the role of criteria such as altitude of objects, number of removed targets, and the implication in chain-collision phenomena, according to different periods of observation. Indeed, it will be demonstrated that one given future requires an adequate and particular criterion to select the best removal scenario in terms of efficiency on its population.
Chapter 5 focuses on the long-term period of the whole study, by looking at criteria that induce major impacts over 100 years in the future (until year 2109). To do so, the evolutionary model NEODEEM is used to simulate the future environment, then the tracking program is applied to find out the origins of the fragments detected in this 100-year future. A ranking list concerning the objects generating the more fragments is set up, and simulation scenarios concerning the removal of selected targets among the list are run once again to verify the effectiveness of the process.
Chapter 6 presents exactly the same approach as in Chapter 5, but focuses on the short-term period of the whole study. NEODEEM and the tracking program are used in the same way, and the remediation effects are evaluated over 20 years in the future (until year 2029) to look for the best matching selection criteria corresponding to this short-term future.
Chapter 7 presents again the same approach as in Chapter 5 and 6, but focuses on the mid-term period of the whole study. NEODEEM and the tracking program are used in the same way, and the remediation effects are evaluated over 50 years in the future (until year 2059) to look for the best matching selection criteria corresponding to this mid-term future.
Chapter 8 gathers the results obtained through the studies of Chapters 5, 6 and 7 to propose a comparative analysis between the three different time scales. The aim is to understand the differences in the nature of the selection criteria and to find out a possible removal scenario suitable for all periods of observation. This Chapter also helps to summarize and clarify the criterion that must be adopted in order to choose the best matching removal scenario according to the future that is considered.
Finally, Chapter 9 concludes the entire Doctoral research by summarizing both the lunar-mission study and the study concerning the targets’ selection criteria. It gathers all the results and tries to propose new perspectives to continue this study, mainly by underlying the possible adequacy of the “double-check”
process (using the tracking program) to other researches dealing with the problem of space debris.
2. Tools used to conduct the study
In this study, the near-Earth environment has been simulated to evaluate the possible future evolution of the debris population under different conditions. Simulations have been performed using the analytical evolutionary model NEODEEM, and have been checked with the help of a back-in-time process available through a complementary event-track tool.
a. Environment evolutionary model
In order to simulate the space environment as it may be in a defined epoch, a debris environment evolutionary model from low-Earth orbits to geostationary orbit is used. The model used for this study is called NEODEEM (Near-Earth Orbit Debris Environment Evolutionary Model), and is jointly developed at Kyushu University and JAXA. NEODEEM is provided with five projection modes, defined as Historical mode, Future mode, Target mode, Removal mode and Propagation mode. The user can choose the simulation mode according to the results he/she wants to get. The Historical mode is dedicated to predict the current state in space through the modelling of historical trends. To do so, this mode does not implement events like explosions or collisions, but focuses only on orbital insertions and the propagation of each object’s orbit; the orbital insertions (new launches) are made here every day. The Future mode is used for the prediction of the future environment by taking into consideration various selected events (according to the user’s goal) like collisions, explosions, orbital insertions, and by propagating each object’s orbit from an initial year to a final year. In this mode, orbital insertions are made every year. The Target mode focuses on one designated object (target). By concentrating on this particular object’s orbit, this mode enables to evaluate the probability of collision with all other objects present in the model at the same year, as well as the cumulative collision probability, and calculates the expected value of the number of fragments generated by each collision event. It should be noted that this mode performs neither collision decision nor new debris generation. The Removal mode performs calculation to decide on the target object to be removed according to selection criteria for removal. Lastly, the Propagation mode is used only for orbital calculation.
In the two main studies included in this Doctoral research, the various simulations aim to evaluate the environment of all space objects in the future, for each year from the initial year until the final year (in case of the study concerning removal’s impacts on the evolution of LEO population) or until the insertion of the target vehicle (in case of the Earth-Moon trajectory study). Therefore, the mode defined as future mode in NEODEEM is the best matching mode for this research, and has been selected to perform the different projections. In the particular case of the lunar-mission study, the target mode has also been used in complement to focus on the lunar spacecraft.
i. Initial population in year 2009 and Assumption on launch traffic
To start a simulation, the knowledge of the initial population is required as a baseline for the environment to be propagated then in the model. This baseline file lists all the objects that are present in orbit around the Earth as of May 1st, 2009. It has to be noted that only objects bigger than 10 cm in size are recorded; and all over the years, in any scenario, the evolutionary model enables the user to propagate and simulate the environment only for objects superior to 10 cm in size. Smaller objects are not taken into account, in any occurring event, due to a lack of knowledge and data for this category of object. This is one of the limits in this modelling (it is currently the black point of many models over the world), and should be considered as a point to be improved in order to raise the accuracy of the results in the future. This task was not done in this research both because of a lack of time (gathering all data concerning small objects could consist in one full research study) and because the purpose of this research is to underline the events at the origin of risk generation for space mission and at the origin of the increase of future space population. The focus was therefore made on the development of useful tools and processes in order to enable such works.
In this Doctoral research, two separated studies have been conducted for different purposes according to the requirements of the collaborating entities. Therefore, it has to be underlined that, in the followings, the initial population is different between the study concerning the Earth-Moon trajectory presented in Section 3, and the study linked to the effects of ADR on the evolution of future population presented in Sections 4, 5, 6, 7, 8. The reason is that the research aiming to evaluate the impacts of
removal process is made in collaboration with JAXA, thus the credits to use the initial population file created by ESA for IADC Working Group 2 - Action Item AI27.2 - have been received. In this provided file, 20 788 objects are listed, gathering all space-crafts, rocket bodies, mission related objects, previous explosion fragments and collision fragments catalogued in May 2009 for IADC members. It must be underlined that neither the name of the objects nor their International identification number are provided, therefore in the related studies, some objects could not be identified with current existing objects. The reader is therefore expected to understand that the targets selected for some removal cases are only presented through their mass and orbital characteristics, rather than their name, when the identification could not be done manually. The author apologizes for this inconvenient. To represent the population in its initial state, and as a comparison for the results on the choice of removal scenarios that will be presented in next sections, the following graph illustrates the orbital regions of the baseline population:
Illustration. Introducing illustration of orbital areas for the initial population However, this file of initial objects is not accessible to any other entities (out of IADC members), therefore, it has been necessary to create our own baseline file for the study concerning the Earth-Moon trajectory, conducted for Astroscale PTE. LTD. In this case, the name of the objects is therefore known, and the previously underlined problem of identification does not exist here. For this Earth-Moon- trajectory study, the initial file was created by tracking all catalogued objects for this year, including launched space-crafts, rocket bodies, mission related objects and fragments. Fragments are issued from either explosions or collisions in space. Therefore, the resulting environment of year 2009 after all events and launches has been retraced as precisely as possible. This thorough task was done thanks to the use of Agencies’ databases, reference books [11, 12, 13], as well as results from simulation. In the case of this 2009 baseline file, 20 788 objects have been listed. The nature of the data concerning the objects is the only difference between the two initial files; their format remains the same in input of the model.
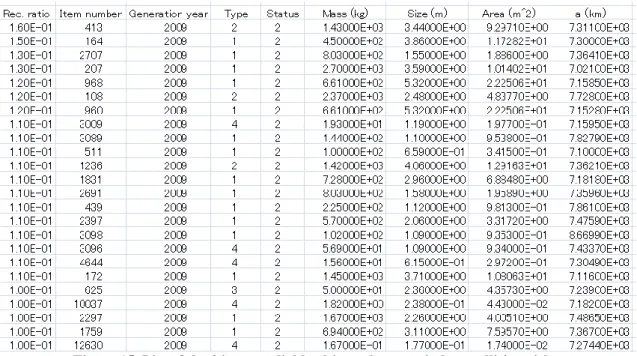
The baseline file is a 13-column by X-line file (where X represents the number of objects in the file), presenting the following data for each object: the item number (from 1 to X); the type of the object (1 for a spacecraft, 2 for a rocket body, 3 for a mission related object, 4 for a fragment due to an explosion, 5 for a fragment due to a collision); the mass in kilograms; the size (diameter) in meters; the cross-sectional area in square meters; the six orbital elements, i.e. the semi-major axis in kilometres, the eccentricity of the orbit, its inclination, the right ascension of the ascending node, the argument of perigee, the mean anomaly; the status of the object (under control or not); and the lifetime of the object in space. In the case the object exists well before 2009, a long lifetime is attributed in order to differentiate it from objects created during 2009 or that will be generated later during the simulation.
In addition to the initial population, the knowledge of launch frequency is also necessary in order to bring more precision to the propagation mode of the model. Indeed, from a given population of objects, the model predicts the evolution of each object’s orbit, the interactions that may happen between different objects, the possible events that occur, as well as the insertion of new objects. This last point is difficult to predict since there is no precise idea of the nature and frequency of future launches. This depends on various needs and resources of Space agencies and companies, as well as possible space regulations that might be imposed according to the evolution of the environment around the Earth. Therefore, to overcome this difficulty, it has been decided to use past launch traffic data that were recorded from year 2003 to year 2010. For each of these years, all the launches announced by governments and agencies have been gathered, including rocket bodies (last stages that remain in orbit), the payload satellites and shuttles, and all objects related to the launches (known as mission related objects). This launch file forms an 8 year-cycle database that can then be repeated every eight years, starting from January 1st, 2010. An explanation for the use of this launch cycle in the propagation mode is provided in Figure 4. It is quite obvious that this proposal to simulate future launches is not accurate, in the sense that future launch traffic has a great chance to differ from the past one due to the above explanations. However, new launches will have a strong impact on the space environment, therefore it is necessary to simulate them and consider them in the model for more accuracy of the results. In this way, a constant traffic launch over eight years has been assumed, which allows predicting the evolution of the environment in the case that human activities remain the same. This launch file lists 699 launched objects between 2003 and 2010, presenting data for each launched object during this period, as follows:
the item number (from 1 to 699), the insertion year, the type of the object, its mass, its size, its average cross sectional area, and the six orbital elements.
Figure 4. Launch-cycle propagation
For the study dealing with the safety of Earth-Moon trajectory mission (Section 3), all events must be taken into consideration in order to evaluate all collision risks as precisely as possible.
Therefore, the assumption of new launches in the future has been made, and the launch cycle has been used in input. However, in the studies linked to the evaluation of impacts from removal process (Sections 4, 5, 6, 7), the focus has been set on the current existing objects only, thus the simulations have been performed under the conditions of no new launch, and the launch cycle is not used in these cases.
ii. Collision probability and Settings for occurring events in the simulations
During the projections, spacecrafts are assumed to have an 8-year mission lifetime. After this time, if the spacecraft is still present in the NEO environment, its status is moved to drifting object. As for the rocket upper stages, they are left in their target original orbit after payload liberation. Concerning the LEO environment, a PMD can be performed in order to limit the long-term presence of spacecraft and launch vehicle upper stages after the end of their mission, keeping in mind the completion of the 25-year rule required by the IADC Space Debris Mitigation Guidelines [1, 14]. Moreover, in order to simulate the evolution of space environment by assuming current configuration as a baseline scenario, no removal is performed, except in the removal-case studies of course.
In addition to defining the future launch traffic, the propagation mode also aims to update the parameters of the existing objects in orbit for each year of the simulation. To predict the orbit, the evolutionary model calculates the perturbations of the orbital elements through Lagrange and Gauss Planetary equations. The main perturbation physical forces considered in the equations are the effects of Sun gravitation, Moon gravitation, Solar radiation pressure (for LEO), atmospheric drag (for low altitudes), and the non-spherical parts of the Earth gravitational attraction with J2, J3 and J4 terms.
Furthermore, explosions in the future have been set to zero since previous study has shown that their impact on object population was negligible [14, 15, 16] (IADC Working Group 2, 2013; Ariyoshi, 2012; Hanada and Yasaka, 2004). Therefore, the future environment is evaluated without taking into account the potential fragments generated by explosions of existing objects after year 2009. However, at the opposite of explosions, collisions between objects are evaluated since their resulting fragments are supposed to have the more important impact on the growth of the population. Collisions between two objects are evaluated through the calculation of collision probability. The calculation method proceeds in two steps, and is fully detailed by Hanada and Yasaka [16], and Ariyoshi [15]. The following description simply gives a general image of the process.
The first step of the algorithm consists in evaluating whether the existence spheres defined around each of the two objects are overlapping each other. If they do not overlap, the objects will never collide, so the corresponding probability is set to zero. If they overlap, a second step consists in calculating the probability of collision between the two objects. The calculation uses the volume of the overlapping region of the spheres, the sum of the cross-sectional areas of the objects, their relative velocity, together with their probability of existence in the overlapping portion and density. In NEODEEM, all spacecraft larger than 10 cm in size and all rockets are tracked individually, which enables this model to calculate a one-by-one collision probability. Two filters are adopted to reduce calculation time. Any pair of objects that pass the filters are only judged for the further collision analysis.
The first filter compares the apogee and perigee radius. This filter provides a rough cut to determine if close approaches are possible. If the difference between the larger perigee and the smaller apogee is positive and greater than the desired distance tolerance (set at 20km in NEODEEM), the two satellites will never approach one another.
The second filter compares the minimum distance between the orbits and the desired distance tolerance.
This filter provides a precise cut to determine if collisions are possible. If the minimum distance is greater than the desired distance tolerance, the two satellites will never collide with one another.
Assuming that the orbits are in different planes, the minimum distance between the orbits should be on the nodal line of the two orbit planes; and the nodal vector between the orbit planes is along the crossing line of the two orbital planes. Orbits that satisfy this second filter need no further processing. It is assumed that the object can exist inside the sphere uniformly. If two spheres overlap each other, then the two objects can collide with one another inside the overlapping portion. The time that the object spends in the sphere can be approximated, which enables the calculation for the probability that the object will be in the sphere during one revolution. The knowledge of the probability that the primary object will be inside the overlapping, together with the density of the secondary object finally lead to the collision probability between the two objects inside the overlapping portion. At the end, if the collision is estimated to happen, it is determined to be catastrophic or not according to the definition of the NASA standard breakup model, 2001 revision [21].
The main assumptions and conditions for the simulations conducted for the Earth-Moon- trajectory study and the research concerning the impacts of removal are presented respectively in Table 2 and Table 3.
Event Status in the simulation
New launches Yes
Objects’ removal No
Future explosions No
Collisions Yes
Performed PMD 30% success rate
Event Status in the simulation
New launches No
Objects’ removal No
Future explosions No
Collisions Yes
Performed PMD Not applicable Table 2. Settings in NEODEEM
(Earth-Moon-trajectory study)
Table 3. Settings in NEODEEM (Removal-impacts study)
In the study concerning the safety of Earth-Moon trajectory mission, a realistic case (closer to reality) has been selected through the value of the PMD (30%) in order to fit as possible the current status of space-crafts. In parallel, the study underlying the impacts of ADR aims to warn about the necessity to perform efficient removal strategies and does not take into account new launches so as to show the emergency to perform removal even in an ideal scenario; since PMD is a process applied for new launched objects, it is not used in this second study. With the above settings that are summarized in Tables 2 and 3, the model performs a projection of the environment from year 2009 until the selected target year, depending on the study.
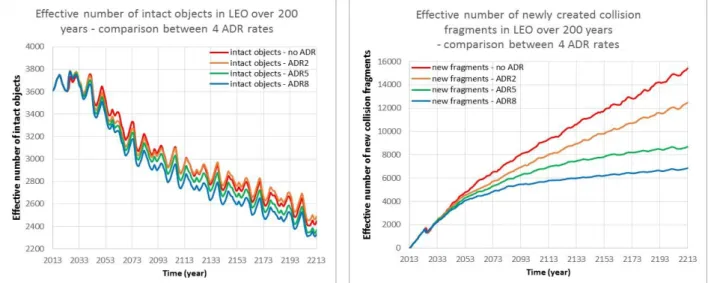
As explained above in this part, events linked to explosions have been neglected in the rest of the study due to conclusions made by previous work [14, 16]. To complement this conclusion and better understand the lying phenomenon under the predicted change in the evolution of future space environment, a study was conducted within the IADC Working Group - Action Item AI31.5 - in 2014, by propagating the initial population of all objects catalogued as of January 1st 2013 and provided by ESA. This population was propagated over a 200-year simulation time. It was divided in three sub- studies, each considering one of the three different PMD rates (30%, 60%, and 90%), in order to focus on the impacts of a combined ADR process. The results were obtained through the mean of one hundred Monte-Carlo simulations, with the assumptions of no explosions, but a continuation of launch traffic (based on a 2005-2013 traffic cycle), and four ADR scenarios: no ADR performed, 2 objects removed per year, 5 objects removed per year, and 8 objects removed per year. If ADR is performed, the removal process starts from year 2025 until the final year 2213. During the projections, space-crafts are assumed to have an 8-year mission lifetime. After this time, if the spacecraft is still present in the near-Earth- orbit environment, its status is moved to drifting object. As for the rocket upper stages, they are left in their target original orbit after payload liberation. Concerning the execution of the PMD inside the model, it is performed only regarding the 25-year rule for all the objects that require it. No other options, such as transfer to graveyard orbits or other processes, are considered. This remark is applicable to all the studies presented in this article when the simulations are performed with the evolutionary model NEODEEM.
The following figures 5 and 6 present results only in the case of a 90% PMD success rate, so the best PMD case scenario, in order to fully concentrate on ADR effects. The two other studies, where 30%
PMD and 60% PMD rates were respectively implemented, led to a degradation of the future environment as the rate is higher. However, the cases of 30% PMD rate and 60% PMD rate are not presented in this article since the related observations and conclusions raised about the evolution of the future debris population were similar in terms of relative impacts between ADR rates and determination of main causes for the population growth. This one-case presentation has therefore been decided to avoid redundancy in the explanations of the phenomena.
Figure 5. Evolution of the future LEO population (mean effective number on 100 MC runs) after simulating 4 different ADR scenarios under assumptions of 90% PMD and no explosion:
no ADR; ADR at 2 objects/year; ADR at 5 objects/year; ADR at 8 objects/year
Figure 6. Evolution of LEO intact objects (left) and fragments generated by collisions (right) (mean effective numbers on 100 MC runs) for each of the 4 ADR scenarios
under assumptions of 90% PMD and no explosion:
no ADR; ADR at 2 objects/year; ADR at 5 objects/year; ADR at 8 objects/year
Leaving aside the obvious observation that high ADR rates lead to a more positive impact on the evolution of the population, this section tries to analyse the evolution of space objects relatively to the general population inside each ADR scenario. The above Figures 5 and 6 clearly show the same behaviour in the evolution of the different kinds of objects in the LEO population independently of the considered rate for ADR. Indeed, in low ADR rate scenario (ADR0, ADR2), the predicted increase of the LEO population all over the simulation period (200 years) appears to be totally linked to the huge increase of the collision events that are expected to occur during the same period, as shown on the right part of Fig. 6. At the opposite, even under new launch assumption, the population of intact objects (space-crafts, rocket bodies) follows a decreasing trend, due to ADR, PMD, and natural re-entry phenomena. As for high ADR rates (ADR5, ADR8), the predicted decrease of LEO population seems to
be supported by a stabilisation in the creation of collision fragments, combined with the decrease of intact objects. Looking at the scales, newly generated fragments are presented in dozens of thousands, whereas intact objects are expected to remain below 4000. Therefore, both the behaviour of the respective populations and the difference in the number of each kind of objects invite to raise the same conclusion: the strongest phenomenon lying under the evolution of future LEO population consists in the generation of new fragments by collisions, which strengthens previous study concerning the analysis of explosion fragments [14, 16]. Furthermore, by looking more particularly at the differences issued from the selection of ADR rates, these graphs contribute to reinforce the discussion concerning the necessity of ADR to improve the stability of future space environment. Keeping in mind the conditions of this study, once again it should be noted that this behaviour and these conclusions come from projections without explosion events. According to the explosion rates, the results may vary, but the trend given by collision phenomena may be still observable.
The above results, obtained for IADC Working Group - Action Item AI31.5 - in 2014, also strengthens conclusions from previous studies of IADC Working Group 2 - Action Item AI27.2 - made in 2012 using an initial population recorded on May 1st 2009 (see [14] for more details) and presented in Introduction as the background that triggered this Doctoral research.
Together with IADC studies that gather results from various and independent evolutionary models of space agencies, these observations underline the main effect of collisions as an explanation for the evolution of LEO environment, and fully justify the orientation and the motivation of this Doctoral research. In this way, the creation and the implementation of a program able to detect collision events and track their origin back in time until the generation year appears as necessary to support this research and is then fully justified. This program is presented later in sub-section c.
b. Statistical analysis concerning the number of MC runs for the study
The evolutionary model has been used through 100 Monte-Carlo simulations to conduct the whole study and the preliminary study. This choice has been done to give the highest accuracy and robustness in the results (mainly based on the arithmetic mean of the parameters returned by the simulations) as possible, regarding the computational power at disposal. The analysis of the minimum required number of Monte-Carlo runs is based on a previous study now detailed in this section ([15], pp. 60-62), as well as the method proposed for the evolutionary model LEGEND of NASA.
For the present study, the evolutionary model uses random numbers to evaluate the future environment, mainly through the prediction of collision events, interactions between space objects, and so on. Therefore it is necessary to perform multiple trials by simulation. To determine the necessary number of runs to be performed, the analysis is based on the Bootstrap method [22] used in LEGEND [6]. The procedure is simply developed here, through four steps:
Step 1: 200 MC runs are performed. Among the 200 trial results, a number N of results are randomly extracted (with N < 100). The Bootstrap method is illustrated as:
Step 2: The mean of the trial results from the N-sample is calculated.
Step 3: Step 1 and Step 2 are performed 200 times.
Step 4: For N varying from 2 to 100, Steps 1 to 3 are iteratively calculated.
Ariyoshi [22] performed the analysis by using an initial population as of January 1st, 2010, and propagated it over 200 years until January 1st, 2210. Moreover, he didn’t consider PMD, debris removal, new launches, neither the generation of fragments from explosions; only collisions were believed to generate new fragments. These settings were chosen to focus on collisions since they are supposed to be the events the most dependent on the generation of a random number.
The convergence of the results was analysed and presented through the graphs G1 and G2 ([22], p.61). Precisely, taking as criterion the mean of the trial results among the 200 runs, these graphs illustrate respectively the number of objects (on the mean of N simulations) and the probability to produce a convergent mean according to the number N of simulations performed. The ranges of +/-5% and +/-10% around the criterion mean are illustrated too.
Graph G1: Comparison between the criterion average among 200 MC simulations and the means calculated in the case of each simulation (from the N performed)
Graph G2: Number of mean values from each simulation number (among the N performed) included within the ranges of +/-5% and +/-10% around the criterion mean of the 200 simulations
As illustrated on the graphs, in NEODEEM, 90% of the samples gather within +/-10% range around the mean in the case of 14 runs, and within +/-5% range around the mean if 42 runs are performed. Therefore, NEODEEM can produce statically meaningful results with 14 to 42 runs performed. However, looking at the graphs, more robust results can be produced from a value of at least 60 simulations, from which the convergence of the mean number of predicted objects is obtained.
Considering the above analysis and the computational power at disposal, it has been decided to perform 100 MC simulations for the completion of the present study. This choice also enables to include statistical statements during the explanation of the results presented inside the different studies. These statistical statements includes a comparison between different removal scenarios MC run by MC run to strengthen the mean analysis with a case- by-case analysis (the scenarios have been compared each against another for each of the MC simulations that were performed).
c. Tracking program for the identification of debris’ origins
The demonstration study presented in Section 2.a. has clearly underlined a strong correlation between the evolution in the number of future collisions and the increase of the predicted NEO population all along the simulations obtained through various evolutionary models. The fact that gathering main agencies’ results leads to these same conclusions invites to give a key role to collision events, and consequently to collision fragments, in the expected increase of near-Earth orbit population. This is also strengthened by the Kessler syndrome theory presented previously in Introduction. It is therefore necessary to better clarify these events that may have a strong impact on the future evolution of near-Earth object population, which justifies the implementation of a program dedicated to find out the origins of collisions back to the past until the identification of “parent” objects in initial year, i.e. at the beginning of a given simulation. This is the tool presented here, specially developed to support the study conducted in the context of this Doctoral research. This tool gave the possibility to think about potential targets for removal processes in a different way than the current one adopted by Space agencies.
Agencies mainly establish their priority list according to the product of the mass of the object and its collision probability at the time of collision (see [17]); thus they don’t take into account the possible evolution and the repercussions in the future. However, in the context of this Doctoral research, the future period is given a major importance in order to determine the objects that may impact it. In other words, the tool that will be presented here enables to anticipate the consequences on the future, according to the time spent from the possible collisions and the scenarios that should be engaged in order to compensate these effects. This is a strong point of this study since it may be considered as a new approach for target selection and thus as a proposal for new considerations in the purpose of securing the near-Earth environment, purpose shared by space agencies and companies.
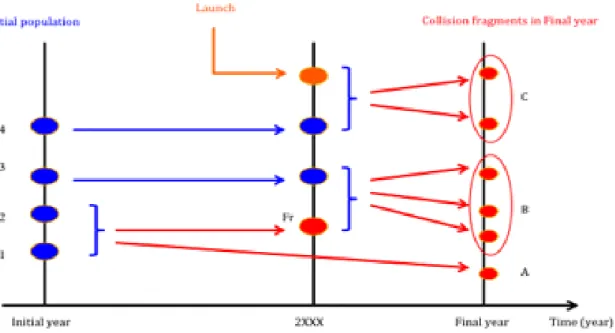
This program uses as inputs the list of all collisions at each year of the simulation, from initial year to a selected final year, as well as the list of the object population at each year. It is then able to give in output the list of debris-inducing objects that are present in the initial year. The methodology adopted to build the program is detailed in Fig. 7.
Figure 7. Origin-tracking function: implementation and methodology
It can be noted that this program is built in particular adequacy with the structure of the evolutionary model NEODEEM. However, it can be easily adapted to the outputs of other models as the lists of the estimated population and occurring events are accessible. A brief example of use is illustrated in Fig. 8.
Figure 8. Process applied inside 1 MC simulation for collision fragments identified in Final year
In Fig. 8, blue dots represent the objects included in the initial population, orange dots represent objects newly launched, and red dots represent fragments generated by a collision event. The groups A, B, C defined in Final year correspond to the groups of the generated fragments, and the numbers 1, 2, 3, 4 defined in the initial year correspond to the identification numbers of the initial parent objects that generate fragments in Final year.
The groups of fragments are defined with respect to the time-closest generative collision, i.e. all the fragments of a same group are generated by the same collision, as shown in Fig. 8. In each group, the information on the mass and the size of every fragment is accessible. Furthermore, at the end of the track, the list of debris- generating parent objects is given in output. In the example, they correspond to objects 1 to 4. In this list, the following data are provided for each of the parent objects: the total number of generated fragments in Final year and the corresponding fragments’ groups. Therefore, thanks to the knowledge of the groups, it is possible to determine the mass and size of the fragments that may be produced in the future Final year. In the example of Fig. 8, initial objects 1 and 2 will generate the fragments of groups A and B; object 3 will generate the fragments of group B; and object 4 will generate the fragments of group C. The advantage of this program is that it tracks non-direct events, known as chain collisions, in order to associate to an original object all its resulting fragments.
For example, the fragments of group B are indirectly created by objects 1 and 2 (through one fragment of their first direct collision), and directly generated by object 3. This process has been explained for a one-case simulation. Then, once all the data from each simulation are obtained, the program is applied to all the simulations, and the resulting list of parent objects is deduced from the mean of all cases, taking into account selected criteria (according to the user’s objectives) such as mean on number of fragments only; mean on number of fragments overpassing a defined mass or size; as well as the recurrence (rate of appearance) in the simulations of the parent objects for example.
In order to concretely illustrate the capacity of the program and give a clear idea of the resulting outputs (nature of the data and format of the output files), the origins’ track has been performed on the baseline scenario, from year 2009 to year 2109 through 100 Monte-Carlo simulations, taking the simplest assumptions of PMD 90% success rate, no new launches and no explosions in the future. Thus, focus can be made on collision events exclusively. First, the process in one particular simulation is presented. Then, the enlargement to the hundred simulations is explained.
Among all the simulations, the 2nd Monte-Carlo simulation has been selected for illustration here due to the complexity of the phenomena that occur during this case: presence of “multi-group” generating objects. The format of the resulting data (as it is given in output of the program) is shown in Figure 9, together with the graphical representation of the occurring events for this particularly interesting phenomena (multi-group generating objects).
Figure 9. Results of the tracking function: output format & illustration of chain events
As presented in Fig. 9 for this particular simulation case, 23 objects of year-2009 population are estimated to be at the origin of 9213 collision fragments in total, divided in 14 groups.
The same process has been applied to all simulations, giving similar output files and analyses for each case.
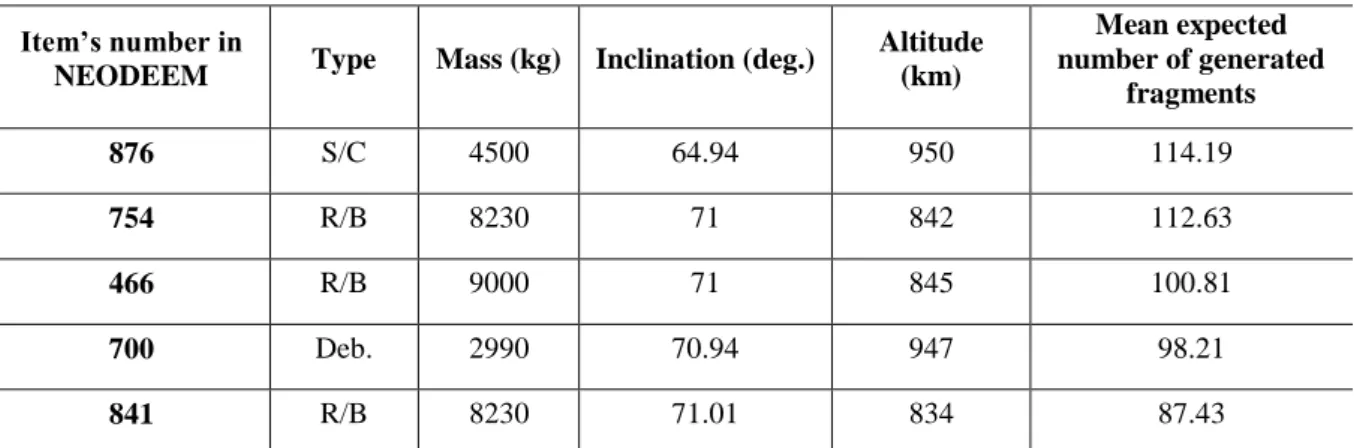
Therefore, to fully complete the investigation, all results have been gathered through the mean on the 100 Monte-Carlo simulations. For a simple example of possible final results, it has been decided to calculate the mean on the number of fragments generated by each parent object of all cases. The format of the final data is given in Table 4 where the beginning of the file (riskiest objects in term of generation of fragments) is detailed.
Item’s number in
NEODEEM Type Mass (kg) Inclination (deg.) Altitude (km)
Mean expected number of generated
fragments
876 S/C 4500 64.94 950 114.19
754 R/B 8230 71 842 112.63
466 R/B 9000 71 845 100.81
700 Deb. 2990 70.94 947 98.21
841 R/B 8230 71.01 834 87.43
Table 4. Example: List of the first five objects expected to generate the more collision fragments in 2109 (mean on 100 MC cases)
As presented in Table 4, the final results concerning the list of objects at the origin of future fragments is given in decreasing order, from the riskiest (here, the object generating the higher number of fragments in the future) to the less dangerous. Information on each object is provided, mainly the internal properties of the object and its orbital characteristics at initial year or year of removal (depending on the user’s objectives).
This tracking program has been applied to the different studies detailed in this Doctoral thesis. It has been a strong support to achieve the purpose of determining the objects, either among the current population or as they are expected to be in a given removal year, that may be the most efficient targets for removal according to a particular time scale. Indeed, since the future period is given a major importance in order to determine the objects that may impact it, this tool helped to anticipate the consequences on the future, according to the time spent from the possible collisions and the scenarios that should be engaged in order to compensate these effects.
This is a strong point of this study since it may be considered as a new approach for target selection and therefore as a proposal for new considerations in the purpose of securing the near-Earth environment, purpose shared by space agencies and companies. This tool, together with the method it enables to use, might be apprehend as a new approach to rank objects with implication in future debris generation; it could appear as an alternative way or a complement to other studies on the same subject, such as ranking proposals from Rossi et al.
[17] or Kebschull et al. [23] who added time considerations in their evaluation of environment criticality.
The application studies are now detailed in Section 3 where the problem is to secure a journey to the Moon from potential collision risks, and in Sections 4, 5, 6, 7, 8 where the goal is to better understand how to classify targets according to criteria such as number, ranking, altitude, time scale, and many others.
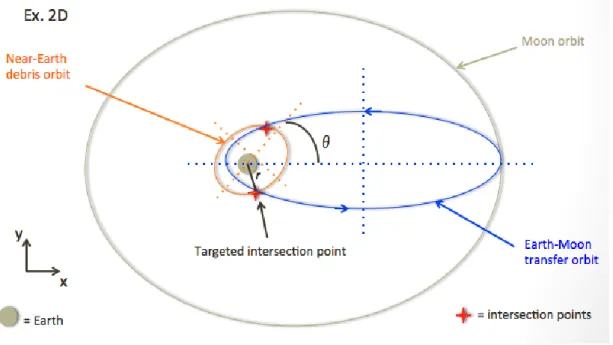
3. Identification of removal targets to secure future Earth-Moon trajectory mission in 2045
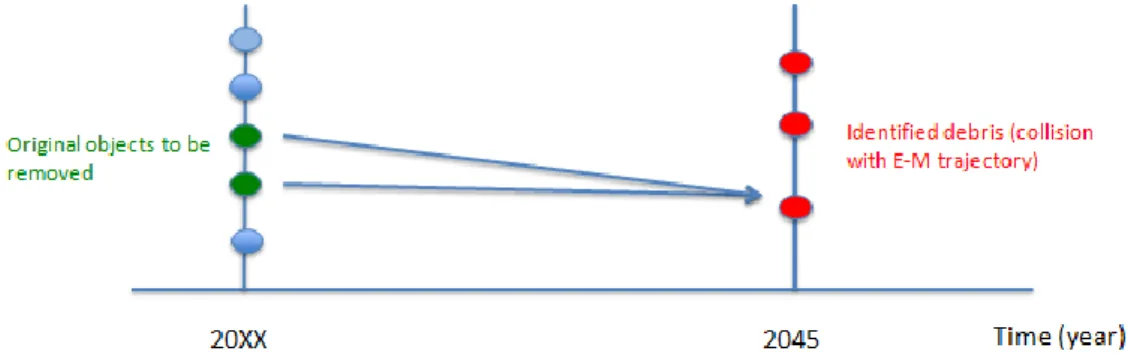
As detailed in general introduction, the number of objects in orbit around the Earth has kept increasing since the very first launch of Soviet Sputnik satellite in 1957. With time, many objects have become non-operational anymore, but have remained on their orbit. Now, the proliferation of these debris appears as a real problem, in particular for human space missions, due to higher collision risks with operational space-crafts and threats for astronauts’ life. In this context, this first study, as a part of the full Doctoral research, aims to secure future Earth-to-Moon commercial space travels starting from year 2045. In order to achieve this objective, precise knowledge of the space environment along this transfer orbit is required. Therefore, this proposal aims to predict the debris environment of both low-Earth and geostationary orbits as it may be in the year 2045. Then, among the predicted debris population, the idea is to identify the objects potentially dangerous for the success of the mission, i.e. the objects that have a high probability to intersect the Earth-Moon transfer orbit, and to determine their origin at an earlier baseline time, set as year 2020. This identification phase is a necessary step so as to perform an effective removal process of the original objects before the generation of the identified debris, which could allow eradicating collision risks. By identifying collision risks in a relatively far future, such a proposed research could give the opportunity from now to elaborate an effective plan for debris remediation, which can be considered as an innovative aspect at a time where debris proliferation inhibition is considered as a priority by worldwide Space Agencies.
The lunar mission for common people has been set during the year 2045, with a baseline for removal of identified objects in 2020. In order to determine the debris environment as it may be in 2045, the debris environment evolutionary model NEODEEM is used. This model takes as initial baseline the list of recorded space objects as of May, 1st 2009. The propagation step is based on launch traffic records from 2003 to 2010, through a repetitive 8-year cycle to simulate future launches, as explained in Section 2. The model propagates the population while evaluating the possible events that could happen in orbit, through multiple Monte-Carlo simulations. In this study, 100 Monte-Carlo simulations have been run. This prediction is made all over the years to be able to evaluate the possible environment of each year, and particularly of year 2045.
Concerning the target object, i.e. the Earth-Moon trajectory spacecraft, an example spacecraft has been inserted inside the environment model. In order to get first results, the current calculation for the translunar trajectory takes as basis Apollo 11th mission data at insertion time. Thanks to the parameters related to the vehicle and its orbit, the probabilities of collision with other objects in near-Earth orbits can be evaluated. The collision probability is calculated for each object simulated by the model and given in the output list of year 2045 objects.
The objects that have been identified as dangerous for the mission (non-zero collision probability) are sorted according to the value of their collision probability. Then, the origin of these identified objects is tracked in the past, by using the catalogue of objects simulated all over the past years. The aim is to determine the event that generated the objects of 2045. This track is done until the origin appears before or in 2020, year of the scheduled removal or remediation process. Indeed, the remediation process should be made before the collision with Earth- Moon trajectory spacecraft happens, and the most effective way is to act before the original debris release the fragments that may intersect this transfer orbit. The full method can be summarized into three main steps as follows:
Determine the objects that may collide with the lunar spacecraft in 2045 (simulation of the space environment until 2045 and calculation of collision probability in the particular year 2045)
Identify the origin (parent object) of the colliding objects in their origin generation year
Assimilate the original (parent) objects to their corresponding International Designator (ID) and name.
The entire process and the results are now explained more in details in the following parts. A reference is also available through [18].
In the same way, the evaluation of collision risks, together with the degree of confidence that can be attributed to such results gotten from the average of multiple simulations are also submitted as discussion points for future work, as explained in the Conclusive part of this Section.
a. Presentation of general identification procedure
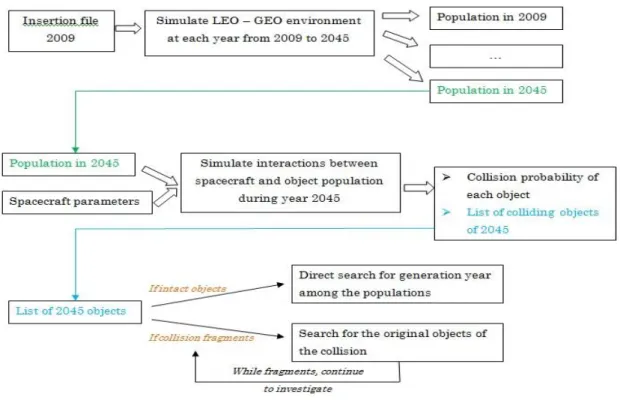
In this sub-section, the process to find out the origins of objects that may induce collision risks with the lunar spacecraft is presented. From the initial population of May 1st, 2009, the evolutionary model estimates the new population at each year until year 2045. In order to increase the precision of the final results, 100 Monte- Carlo simulations have been run, as explained in previous section. The general process can be summarized as follows:
Process for 1 case simulation:
The object environment in LEO and GEO is simulated from the insertion file which sets the initial population in 2009 by taking into account the presence of intact objects1 and fragments, launches and event data, as described in sub-section 2.a.i. The simulation is run until year 2045 (to estimate future environment).
The population simulated in 2045 is taken as a new baseline for this target year, to set the environment while inserting the lunar spacecraft. Another simulation can then be run only for year 2045, including the launch of the spacecraft. With this new simulation, potential interactions between the objects from the population in the baseline file (2045) and the target spacecraft can be evaluated through a calculation of collision probability, as described in sub-section 2.a.ii. Objects are sorted, eliminating those that are not expected to collide with the spacecraft (collision probability equal to zero), and a file of non-zero probability objects only is given in output.
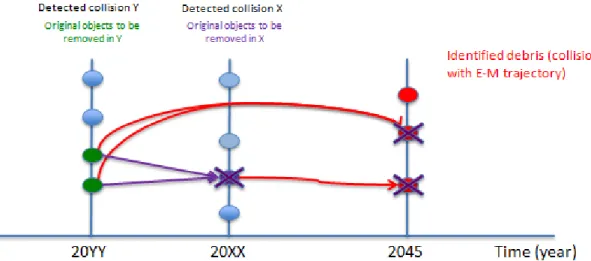
From the above list, the origin of events that generate the identified listed objects in 2045 is tracked. In the case of intact objects, the generation year is found out by using all the population files created by the simulation from 2009 to 2045. In the case of collision fragments after 2020, a particular process is used to find out the parent objects of original collision fragments back in time until 2020 (while there are collision fragments, the same investigation is carried on to track the origin of the origin... of these fragments). The aim is to finally get intact objects only since they are the easiest and the most technologically feasible objects to be removed. All this process is summarized in Figure 10, that is the particular case (for this lunar trajectory study) of the general process explained in sub-section 2.b.
All Monte-Carlo cases process:
The above process, used in a one-simulation case, is entirely repeated as many times as possible in order to increase the precision and the reliability of the results. Indeed, the greater the number of simulations is, the greater the number of results is (one per simulation), and therefore, the wider the range of possibilities is. In this study, 100 Monte-Carlo simulations have been performed.
Mean of Monte-Carlo cases:
The result files issued from each Monte-Carlo case are gathered in order to determine the most reliable objects. The objects are sorted according to their recurrence number (the number of times they appear in a simulation, expressed in percentage), from the highest one to the smallest one. Indeed, the more recurrent (high ratio) an object is, the more reliable its existence is due to the frequency among the simulations. Therefore, the choice of a great number of simulations leads to gather more data, and define a mean on more results, which considerably raises the precision. But limitation by time calculation should also be taken into consideration, which explains the choice of 100 Monte-Carlo simulations.
1 Intact objects are defined as spacecrafts, rocket upper stages, and all mission related objects.
Figure 10. Process for identification of objects’ origin inside one simulation case
Now the general procedure is understood, concrete results and analyses from the study are given in the following sub-sections in order to discuss the emergency to remove some particular objects, as well as the pertinence of the method.
b. Detailed scheme for origin’s identification in one-case simulation
In this sub-section, the main parts of the identification process are presented more in details, through the output files, their format, the results and examples for a particular simulation case.
Simulating the space environment from 2009 to the insertion year 2045
In order to simulate the space environment as it may be in a defined epoch, here at the insertion year of the mission spacecraft in 2045, the environment evolutionary model NEODEEM has been used. To better evaluate all the possible interactions that may occur between the lunar spacecraft and the objects along its trajectory, it is necessary to understand the future population from low-Earth orbit to geostationary orbit (since the Earth-Moon trajectory crosses all this range of orbits), the future mode of NEODEEM is the best matching mode for this case, and has been selected to perform the projection. To do so, all the initial settings and assumptions presented in sub-section 2.a. have been taken into account. Table 5 presents these main settings as a reminder.
Event Status in the simulation
New launches Yes
Objects’ removal No
Future explosions No
Collisions Yes
Performed PMD 30% success rate
Table 5. Settings in NEODEEM for the lunar mission study