魚類における化学物質の生物濃縮性評価に関する研 究
井上, 義之
九州大学生物資源環境科学府
https://doi.org/10.15017/21685
出版情報:Kyushu University, 2011, 博士(農学), 課程博士 バージョン:
権利関係:
By
Yoshiyuki Inoue
A DISSERTATION submitted to
Department of Bioscience and Biotechnology
Graduate School of Bioresource and Bioenvironmental Sciences Kyushu University
in partial fulfillment of the requirements for the degree of DOCTOR OF PHILOSOPHY
Committee:
Professor Yuji Oshima (Academic supervisor) Professor Masaru Kitano
Associate professor Masao Sato
Kyushu University Japan
February, 2012
Dedicated to my parents and
my beloved family, Hitomi, Saki and Tomoka
I hope that this study will contribute to a bright future
for my daughters.
Acknowledgements
本論文の第2章及び第3章については、経済産業省の受託研究である「化学物質 安全確保・国際規制対策推進等(化学物質の試験方法開発等)」の平成 16 年度 から平成22年度までに実施された研究成果によるものである。また、第4章について は、経済産業省の受託研究である「平成 12 年度 化学物質安全対策費補助事業 に係る安全性試験」並びに独立行政法人新エネルギー・産業技術総合開発機構 の受託研究である「平成16年度及び平成17年度 既存化学物質安全性点検事業 の加速化(化学物質総合評価管理プログラム)」及び経済産業省の受託研究である
「平成 17 年度 化学物質安全確保・国際規制対策推進等(化学物質の試験方法 開発等)」において実施された研究成果を中心にまとめたものである。
本研究を遂行するにあたり、御多忙にもかかわらず多大なるご指導を賜り、
暖かく見守って下さいました本論文の主査でもおられる九州大学大学院農学 研究院 大嶋雄治教授に謹んで深甚の謝意を申し上げます。
本論文の副査として本著の内容に関し、多大なる示唆に富んだ御意見を 賜りました明治大学理工学部 北野大教授、九州大学大学院農学研究院 佐藤 匡央准教授並びに島崎洋平助教に深く感謝の意を表します。
化学物質の分子サイズを計算するにあたり、多大な御指導を賜りました 独立行政法人 製品評価技術基盤機構 化学物質管理センター 櫻谷祐企博士に 心より感謝申し上げます。
本研究の実施にあたり、九州大学大学院博士課程への入学を快く承諾して頂き、
長きにわたり寛大な御理解と暖かい励まし、御援助頂きました一般財団法人 化学物質評価研究機構の近藤雅臣名誉理事長、細川幹夫理事長、髙月峰夫専務 理事、大内山直樹理事、久留米事業所の大塚雅則前所長並びに辻敏昭所長、
安全性評価技術研究所の屋形直明課長に心から感謝いたします。また、本研究 を遂行するにあたり、格別のご配慮頂きました久留米事業所の菊島江理奈課長、
実験に御協力頂きました久留米事業所の試験第二課の皆様並びに安定した 試験魚を提供して頂きましたアクアトロンチームの皆様にお礼を申し上げます。
Table of contents
Dedication …...……… I
Acknowledgements …....……….……… II
Table of contents …....………..………... III
List of Tables …....………..………...
List of Figures .……...……….
IV
VI
Chapter 1 General introduction ...…………...…………..………..……... 1
Chapter 2 Comparison of bioconcentration factor and biomagnification factor for poorly water-soluble chemicals using common carp (Cyprinus carpio) ……...……... 14
Chapter 3 Comparison of Nitrofen uptake via water and food and its distribution in tissue of common carp (Cyprinus carpio) …... 50
Chapter 4 Evaluation of bioconcentration for perfluoroalkyl acids based on their physicochemical properties using common carp (Cyprinus carpio) ... 70
Chapter 5 General discussion ...………..………...……….…. 110
References ...………...………... 117
List of Tables Chapter 1
Table 1-1 Definitions of bioconcentration factor (BCF), bioaccumulation factor (BAF), laboratory-based biomagnifications factor (BMF), field-based BMF and trophic magnification factor (TMF) ...………. 9
Table 1-2 Overview of regulatory bioaccumulation assessment endpoints and their criteria ...………...……. 10
Table 1-3 Outline of the Organization for Economic Co-operation and Development (OECD) test guideline 305 ... 11
Table 1-4 Physicochemical properties that have been proposed as screening criteria of bioaccumulation potential ...…. 12
Chapter 2
Table 2-1 Chemical structures of test substances used for the study of the relationship between water solubility and magnitude of bioconcentration factor [BCF] …………...…. 26
Table 2-2 Chemical structures of test substances used for the study of the relationship between BCF and biomagnification factor [BMF]) ………... 27
Table 2-3 Exposure concentration and BCFs of test substances …….……….. 28
Table 2-4 Parameters used for calculation for BMFs of test substances ……… 29
Table 2-5 BCFs and 5% lipid normalized bioconcentration factors (BCFL) of test substances ……….………..…….. 30
Table 2-6 Measured 5% lipid normalized bioconcentration factors (BCFL_measured) and predicted BCFs (BCFL_predicted) …….………..….. 31
Chapter 3
Table 3-1 Chemical structures of test and reference substances used for the study ... 60
Table 3-2 Parameters used for calculation of bioconcentration factors (BCFs) for Nitrofen (NIP) under high- and low-exposure conditions ……...…...…. 61
Table 3-3 Parameters used for calculation of biomagnification factors (BMFs) for Nitrofen (NIP) and hexachlorobenzene (HCB) under high- and low-exposure conditions ...………. 62
Table 3-4 Tissue concentrations and quantity of Nitrofen (NIP) and hexachlorobenzene (HCB) ...………. 63
Chapter 4
Table 4-1 Chemical structures of perfluoroalkyl acids (PFAAs) ...………. 83
Table 4-2 Bioconcentration test conditionsused for for test substances ...…. 84
Table 4-3 Analytical conditions for test substances ...………. 85
Table 4-4 Steady-state bioconcentration factors (BCFss) and physicochemical properties of test substances ...………. 86
Table 4-5 Concentrations of test substances and other type of chemicals, and lipid content in each fish tissue and ratio of the concentrations to that in the head ...………. 87
Table 4-6 Physicochemical properties of fatty acids ...………. 88
List of Figures Chapter 1
Figure 1 Diagram offlow-through bioconcentration test system .……...………... 13
Chapter 2
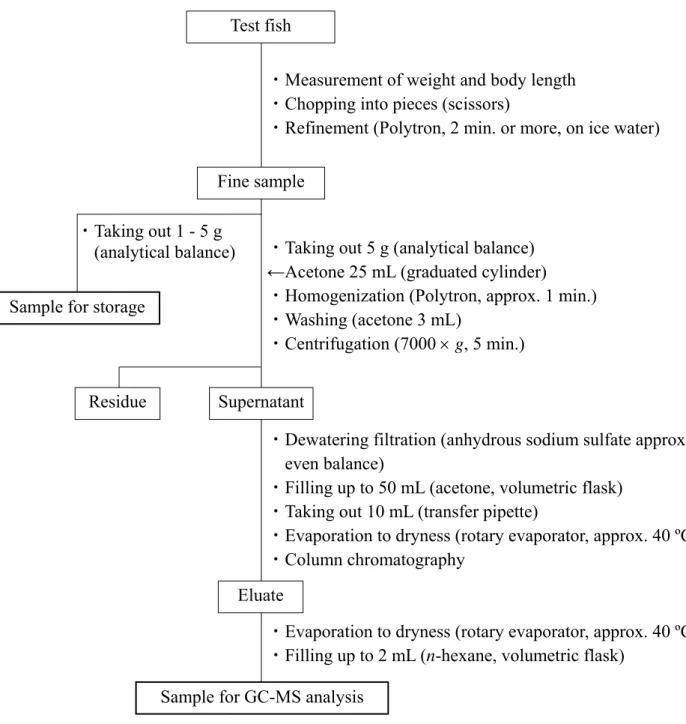
Figure 2-1-1 Pretreatment for analysis of 4,4'-methylenebis (2,6-di-tert -butylphenol) (Binox M), 1,4-bis(isopropylamino) anthraquinone (Solvent Blue 36) and N,N'-di-2- naphthyl-p-phenylenediamine (DNPD) in the test diet ………... 32
Figure 2-1-2 Pretreatment for analysis of pentachlorobenzene (PeCB) in the test diet …. 33
Figure 2-1-3 Pretreatment for analysis of 1-tert-butyl-3,5-dimethyl-2,4,6-trinitro benzene (Musk-xylene), 2,4-dichloro-1-(4-nitrophenoxy) benzene (NIP), o-terphenyl (TP), methoxychlor (MXC) and hexachlorobenzene (HCB) in the test diet …... 34
Figure 2-2-1 Pretreatment for analysis of 4,4'-methylenebis (2,6-di-tert-butylphenol) (Binox M) in the test fish …... 35
Figure 2-2-2 Pretreatment for analysis of pentachlorobenzene (PeCB) in the test fish ... 36
Figure 2-2-3 Pretreatment for analysis of 1-tert-butyl-3,5-dimethyl-2,4,6- trinitrobenzene (Musk-xylene), o-terphenyl (TP), methoxychlor (MXC) and hexachlorobenzene (HCB) in the test fish ... 37
Figure 2-2-4 Pretreatment for analysis of 2,4-dichloro-1-(4-nitrophenoxy) benzene (NIP) in the test fish .…... 38
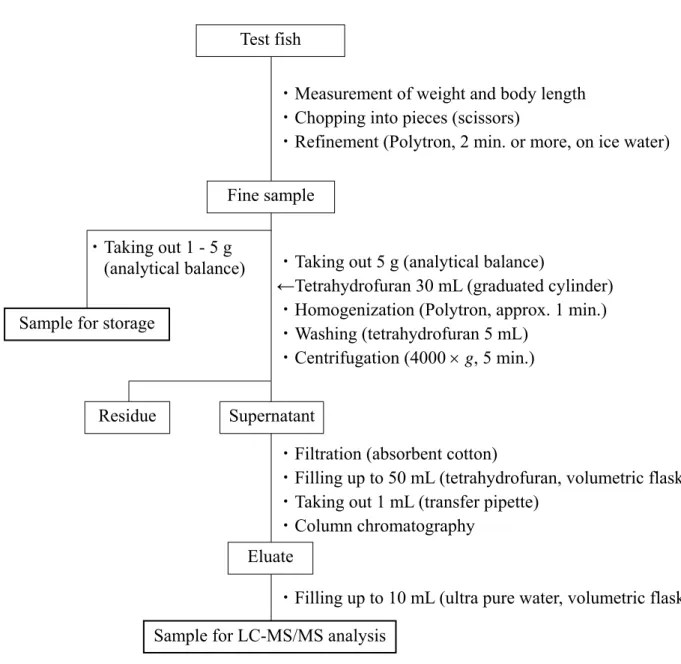
Figure 2-2-5 Pretreatment for analysis of 1,4-bis(isopropylamino) anthraquinone (Solvent Blue 36) in the test fish …... 39
Figure 2-2-6 Pretreatment for analysis of N,N'-di-2-naphthyl-p-phenylenediamine (DNPD) in the test fish ... 40
Figure 2-3 Relationship between exposure concentration and bioconcentration factor (BCF) of test substances ... 41
Figure 2-4-1 Concentration of 4,4'-methylenebis(2,6-di-tert- butylphenol) (Binox M) and hexachlorobenzene (HCB) concentration in test fish during test period ... 42
Figure 2-4-2 Concentration of pentachlorobenzne (PeCB) and hexachlorobenzene (HCB) concentration in test fish during test period ... 43
Figure 2-4-3 Concentration of 2,4-dichloro-1-(4-nitrophenoxy) benzene (NIP) and hexachlorobenzene (HCB) concentration in test fish during test period ... 44
Figure 2-4-4 Concentration of 1,4-bis(isopropylamino) anthraquinone (Solvent Blue 36) and hexachlorobenzene (HCB) concentration in test fish during test period ... 45
Figure 2-4-5 Concentration of N,N'-di-2-naphthyl-p-phenylene diamine (DNPD) and hexachlorobenzene (HCB) concentration in test fish during test period ... 46
Figure 2-4-6 Concentration of 1-tert-butyl -3,5-dimethyl-2,4,6- trinitrobenzene (Musk-xylene), o- terphenyl (TP), methoxychlor (MXC) and hexachlorobenzene (HCB) concentration in test fish during test period ... 47
Figure 2-5 Relationship between 5% lipid normalized bioconcentration factor (BCFL) and lipid corrected biomagnification factor (BMFL) of test substances ... 48
Figure 2-6 The correlation between bioconcentration factor (BCF) and bioaccumulation factor (BAF) data of existing persistent organic pollutants (POPs) and POP candidates ... 49
Chapter 3
Figure 3-1 Pretreatment for analysis of Nitrofen (NIP) in the test water (aqueous exposure) ... 64
Figure 3-2 Pretreatment for analysis of Nitrofen (NIP) in the test fish (aqueous exposure) ... 65
Figure 3-3 Pretreatment for analysis of Nitrofen (NIP) and hexachlorobenzene (HCB) in the test diet (dietary exposure) ... 66
Figure 3-4 Pretreatment for analysis of Nitrofen (NIP) and hexachlorobenzene (HCB) in the test fish (dietary exposure) ... 67
Figure 3-5 Relationship between test period and Nitrofen (NIP) and hexachlorobenzene (HCB) concentration in test fish ... 68
Figure 3-6 Distribution of lipids and test substances in fish tissues on a whole-body basis ... 69
Chapter 4
Figure 4-1-1 Pretreatment for analysis of perfluorooctanoic acid (PFOA) in the test water ... 89
Figure 4-1-2 Pretreatment for analysis of perfluoroundecanoic acid (PFUnA) in the test water ... 90
Figure 4-1-3 Pretreatment for analysis of perfluorododecanoic acid (PFDoA) in the test water ... 91
Figure 4-1-4 Pretreatment for analysis of perfluorotetradecanoic acid (PFTA) in the test water ... 92
Figure 4-1-5 Pretreatment for analysis of perfluorohexadecanoic acid (PFHxDA) in the test water ... 93
Figure 4-1-6 Pretreatment for analysis of perfluorooctadecanoic acid (PFODA) in the test water ... 94
Figure 4-1-7 Pretreatment for analysis of perfluorooctane sulfonic acid, potassium salt (PFOS) in the test water ... 95
Figure 4-2-1 Pretreatment for analysis of perfluorooctanoic acid (PFOA) in the test fish ... 96
Figure 4-2-2 Pretreatment for analysis of perfluoroundecanoic acid (PFUnA) in the test fish ... 97
Figure 4-2-3 Pretreatment for analysis of perfluorododecanoic acid (PFDoA) in the test fish ... 98
Figure 4-2-4 Pretreatment for analysis of perfluorotetradecanoic acid (PFTA) in the test fish ... 99
Figure 4-2-5 Pretreatment for analysis of perfluorohexadecanoic acid (PFHxDA) in the test fish ... 100
Figure 4-2-6 Pretreatment for analysis of perfluorooctadecanoic acid (PFODA) in the test fish ... 101
Figure 4-2-7 Pretreatment for analysis of perfluorooctane sulfonic acid, potassium salt (PFOS) in the test fish ... 102
Figure 4-3 Relationship between BCF and exposure/depuration periods ... 103
Figure 4-4 Relationships between log BCF and number of carbon atoms of test substances ... 104
Figure 4-5 Relationships between log BCF and physicochemical properties of test substances (log BCF versus log Kow) ... 105
Figure 4-6 Relationships between log BCF and physicochemical properties of test substances (log BCF versus Clog P) ... 106
Figure 4-7 Relationships between log BCF and physicochemical properties of test substances (log BCF versus MW) ... 107
Figure 4-8 Relationships between log BCF and physicochemical properties of test substances (log BCF versus Dmax) ... 108
Figure 4-9 Relationship between Dmax and MW of PFCAs (number of carbons; 8–18) and fatty acids (FAs, number of carbons; 8–18) ………... 109
Chapter 1 General introduction
More than 3000 reports of new chemical substances are registered to a chemical database of the Chemical Abstracts Service (CAS) every day. On May 24, 2011, CAS announced that the number of chemical substances recorded in the CAS Registry exceeded 60 million substances (http://www.cas.org/). Everything we own is made up of chemical substances and we reap great benefits from chemical substances.
However, during the years of steep economic growth in Japan (1955 to 1973), the tragic effects of environmental pollution were experienced (i.e., Minamata disease [Harada 1995], Kanemi oil poisoning symptoms [Nagayama 1976], Itai-itai disease [Murata 1970], and Yokkaichi asthma [Yoshida 1966]). Minamata disease was first observed in the inhabitants of the Minamata fishing village, Japan in 1956. It was a devastating neurological disease in humans resulting from the consumption of fish containing high concentrations of organic mercury compounds resulting from bioaccumulation. The Kanemi oil poisoning symptoms were observed around the Kanemi Soko Co. based in Kita-Kyushu, Japan in 1968. This was wide scale food poisoning by rice bran oil (Kanemi oil) containing polychlorinated biphenyls (PCBs).
In 1973, in response to the Kanemi oil poisoning symptoms, a law related to the evaluation and regulation of chemical substances and their manufacture (the Chemical Substances Control Law [CSCL]) was enacted.
In the CSCL (CSCL 2003), bioaccumulation is an important part of the hazard assessment for chemical safety. The bioaccumulation assessment is based on the knowledge that the aquatic environment is a key pathway for most chemical substances released into the environment, and non-degradable chemical substances often accumulate in aquatic organisms, i.e., fish, resulting in negative impacts on the environment and human health. The uptake of chemical substances by fish can occur
through several routes and can involve the dermis, gills, pulmonary surfaces, or gut (Newman 2009). There are many endpoints (definitions) which indicate the bioaccumulation potential of chemicals to fish under various exposure conditions (e.g., via water or diet) (Table 1-1). Overview of the regulatory bioaccumulation assessment endpoints and their associated criteria are listed in Table 1-2. A bioconcentration test is used as a standard test method to characterise the bioaccumulation potential of chemical substances in fish (Figure 1, Table 1-3). The bioaccumulation categories for a chemical substance under the CSCL (CSCL 2003) are determined based on the following rules (Kitano 2007):
i) If the bioconcentration factor (BCF) values are higher than 5000, the substance is categorized as “Highly Bioaccumulative”.
ii) If the BCF value is less than 1000 or the log n-octanol/water partition coefficient (Kow) is less than 3.5, the substance is categorized as “Not Highly Bioaccumulative”. The log Kow is not applicable for surface reactive substances, mixtures with molecular weight distributions, organic metal compounds, low-purity samples and inorganic compounds.
iii) If the BCF value is between 1000 and 5000, the following information should be considered to determine bioaccumulation potential: an elimination test and the BCFs of edible fish parts.
Fortunately, since enacting the CSCL about 40 years ago, there have been no serious chemical pollution incidents in Japan. However, many new chemical substances with a wide variety of characteristics (such as perfluoroalkyl compounds
and functional polymers with advanced optic and/or electronic properties) have contributed to greater economic and social development. Despite the rapid progression in the development of these chemical substances, the bioaccumulation assessments of these new types of chemical substances have not developed as well. Consequently, a new evaluation testing and method is required for the bioaccumulation assessment of these new chemical substances.
The main uptake route of chemical substances in water to fish is considered to be osmoregulation (Randall et al. 1988, Yang et al. 2000). The most widely used test guideline (TG) for measuring bioconcentration in fish is TG 305 of the Organization for Economic Co-operation and Development (OECD), and this is based on the BCF.
The BCF is calculated as a steady-state ratio of the concentration in the fish over the concentration in the tested water (OECD 1996). Bioconcentration is the net accumulation of a contaminant in an organism via water only (Newman 2009). There are several experimental reports indicating that the actual BCF can be concentration dependent, and may be underestimated when the bioavailability of the chemical substances tested is reduced, and this can occur when the test concentration level is higher than the water solubility of the chemical substance. (Black and Mccarthy 1988, Servos et al. 1989, Geyer et al. 1992 and 1994, Qiao and Farrell 2002, ECETOC 2003).
The use of the BCF is being re-assessed and may no longer be recognized as a good descriptor of the biomagnification potential, especially for poorly water-soluble chemicals (Gobas et al. 2009). The OECD is currently considering the adoption of a new test method for these poorly water-soluble chemicals that uses a novel dietary exposure technique to estimate the biomagnification factor (BMF) (Anonymous 2004a,
b). Biomagnification is an increase in concentration from one trophic level (e.g., prey) to the next (e.g., predator) which is attributable to the accumulation of a contaminant via food (Newman 2009). The BMF is a meaningful measure of the potential for these chemical substances to undergo dietary biomagnification in the environment (Anonymous 2004a, b).
In CSCL (2003), the criteria for a “highly bioaccumulative” substance is BCF
≥5000, and in the Registration, Evaluation, Authorization and Restriction of Chemicals legislation (http://register.consilium.eu.int), the criteria for a substance to be classified as Persistent, Bioaccumulative, and Toxic (PBT) is BCF ≥2000, while very Persistent and very Bioaccumulative (vPvB) substances have BCF ≥5000. There is a need to validate both the BMF and the BCF for use as bioaccumulation criteria of chemical substances, but there is currently little information available on the relationship between BCF and BMF. Therefore, in Chapter 2, the author investigated the BCF data in the CSCL report and found that the concentration dependence of the BCF is closely related to its water solubility, which highlights the difficulty in performing bioconcentration tests with poorly water-soluble chemicals because only very low test concentrations can be used. The author also proposes a new correlation formula linking the BCF and the BMF for poorly water-soluble chemicals using common carp (Cyprinus carpio).
In CSCL (2003), the bioaccumulation of chemical substances in fish is an key issue. Fish muscle is considered one of the important tissues when evaluating bioaccumulation potential because fish muscle is a primary source of protein for human consumption. There is strong evidence that hydrophobic substances reach equilibrium in the lipid fraction of different tissues in an organism (Bertelsen et al.
1998; Tietge et al. 1998; Gobas et al. 1999, as cited in Arnot and Gobas 2006).
However, this understanding relies heavily on BCF data, and there is little experimental data that compares the distribution of chemical substances in tissue taken up by different routes (e.g., via water or food) based on the lipid content of the tissue Therefore, in Chapter 3, the author investigated the uptake characteristics of a hydrophobic organic contaminant (Nitrofen [2,4-dichloro-1-(4-nitrophenoxy) benzene]) in common carp (Cyprinus carpio) via water and food, and discussed their tissue distribution based on lipid content.
Even with strict regulations requiring bioaccumulation assessments for chemical substances, an extensive amount of data have reported the detection of perfluoroalkyl acids (PFAAs) in environmental media, wildlife, and human tissues in many geographic locations throughout the world (Kannan 2011). Since the 1970s there has been a steady increase in the commercial use of perfluoroalkyl compounds as surfactants (Giesy and Kannan 2001). PFAAs are a family of anionic fluorinated surfactants that consist of a carbon chain, typically 4–14 carbon atoms in length, with a charged functional moiety (usually carboxylate, sulfonate or phosphonate) (Lau et al.
2007). The most widely used PFAAs are the eight-carbon perfluorooctanoic acid (PFOA) and perfluorooctane sulfonate (PFOS). PFOS and its precursors have been used as water, oil, soil and grease repellents in packaging, rugs and carpets and leather;
as surfactant detergents, emulsifiers, wetting agents and dispersants; and in fire-fighting foam and other applications (OECD 2005). However, these chemical substances do not occur naturally, are only slightly biodegradable, and are persistent in the environment (Yakata et al. 2003). There are some reviews of the monitoring and
toxicological findings for PFAAs (Lau et al. 2007, Buck et al. 2011, Kannan 2011) including studies of the blood (whole blood, plasma and serum) in humans (Olsen et al.
2003, Kannan et al. 2004, Calafat et al. 2007) and wildlife, including fish, birds and marine mammals (Tolls et al. 1994, Giesy and Kannan 2001, Taniyasu et al. 2003, Lehmler 2005, Sinclair et al. 2006), and their hepatotoxicity (Klaunig et al. 2003, Shipley et al. 2004), immunotoxicity (Yang et al. 2000, Wan and Badr 2006), hormonal effects (Langley and Pilcher 1985, Maras et al. 2006), reproductive toxicity (Peng et al. 2010, Stump et al. 2008) and developmental toxicity (Olsen et al. 2009).
On 9 May 2009, at the fourth meeting of the Conference of the Parties to the Stockholm Convention, in Geneva (http://chm.pops.int/Convention/Pressrelease/COP4 Geneva9May2009/tabid/542/language/en-US/Default.aspx), PFOS and perfluorooctane sulfonyl fluoride were added to Annex B of this convention. Despite worldwide interest in these compounds, as seen by their nomination as persistent organic pollutants (POPs), there is little experimental bioconcentration data for these chemical substances using fish as test subjects, and there is a need for reliable hazard information relating to PFAAs with longer (>7) carbon chains (Conder et al. 2008).
Several physicochemical properties have been proposed as screening criteria for the bioaccumulation potential of a chemical substance (Table 1-4). The development of quantitative structure–activity relationships (QSARs) has also allowed the prediction of BCFs from the physicochemical properties of chemical substances.
However, these relationships are not well studied for PFAAs and few studies have reported the physicochemical properties of PFAAs (Lei et al. 2004, Rayne and Forest 2009, Kannan 2011). Therefore, in Chapter 4, the author evaluated the bioconcentration of perfluoroalkyl acids based on their physicochemical properties
using common carp (Cyprinus carpio), and demonstrated that the physicochemical properties of PFAAs lead to unique bioconcentration potentials in fish.
In Chapter 5, the author has summarized the results of each chapter and discussed an evaluation method for the bioaccumulation of chemical substances in fish.
Table 1-1 Definitions of bioconcentration factor (BCF), bioaccumulation factor (BAF), laboratory-based biomagnifications factor (BMF), field-based BMF and trophic magnification factor (TMF)
Bioconcentration factor (BCF) Ratio of the steady state chemical concentrations in an aquatic water-respiring organism (CB, g chemical/kg wet weight [ww]) and the water (CW, g chemical /L) determined in a controlled laboratory experiment in which the test organisms are exposed to a chemical in the water (but not in the diet).
BCF=CB / CW
Bioaccumulation factor (BAF) Ratio of the steady state chemical concentrations in an aquatic water-respiring organism (CB, g chemical/kg ww) and the water (CW, g chemical/L) determined from field data in which sampled organisms are exposed to a chemical in the water and in their diet.
BAF= CB / CW
Biomagnification factor
—laboratory based (BMF)
Ratio of the steady state chemical concentrations in a water- or air-respiring organism (CB, g chemical/kg ww) and in the diet of the organism (CD, g chemical/kg dry) determined in a controlled laboratory experiment in which the test organisms are exposed to chemical in the diet (but not the water or air).
BMF=CB / CD
Biomagnification factor
—field based (BMF)
Ratio of the steady state chemical concentrations in a water- or air-respiring organism (CB, g chemical/kg ww) and in the diet of the organism (CD, g chemical/kg ww) determined from field data in which sampled organisms are exposed to chemical in air, water, and diet.
BMF= CB / CD
Trophic magnification factor or food web magnification factor (TMF or FWMF)
The average factor by which the normalized chemical concentration in biota of a food web increases per trophic level. The TMF is determined from the slope (m) derived by linear regression of logarithmically transformed normalized chemical concentration in biota and trophic position of the sampled biota.
TMF=10m
This table is modified from that of Gobas et al. (2009).
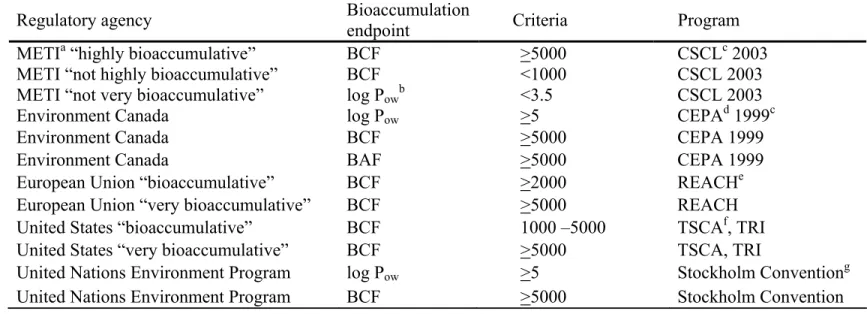
Table 1-2 Overview of regulatory bioaccumulation assessment endpoints and their criteria
The table is modified from that of Gobas et al. (2009).
aMETI, Ministry of Economy, Trade and Industry, Japan.
blog Pow, n-octanol/water partition coefficients.
cCSCL, Chemical Substances Control Law.
dCEPA, Canadian Environmental Protection Act, 1999 (Government of Canada 1999, 2000).
eREACH, Registration, Evaluation, and Authorisation of Chemicals (REACH) Annex XII (European Commission [EC] 2001).
fUS Environmental Protection Agency in its Toxic Substances Control Act (TSCA) and Toxic Release Inventory (TRI) programs (USEPA 1976).
gStockholm Convention on Persistent Organic Pollutants (UNEP 2001).
Regulatory agency Bioaccumulation
endpoint Criteria Program
METIa “highly bioaccumulative”
METI “not highly bioaccumulative” BCF
BCF >5000
<1000 CSCLc 2003 CSCL 2003 METI “not very bioaccumulative”
Environment Canada
log Powb
log Pow
<3.5
>5
CSCL 2003 CEPAd 1999c
Environment Canada BCF >5000 CEPA 1999
Environment Canada BAF >5000 CEPA 1999
European Union “bioaccumulative” BCF >2000 REACHe
European Union “very bioaccumulative” BCF >5000 REACH
United States “bioaccumulative” BCF 1000 –5000 TSCAf, TRI
United States “very bioaccumulative” BCF >5000 TSCA, TRI
United Nations Environment Program log Pow >5 Stockholm Conventiong
United Nations Environment Program BCF >5000 Stockholm Convention
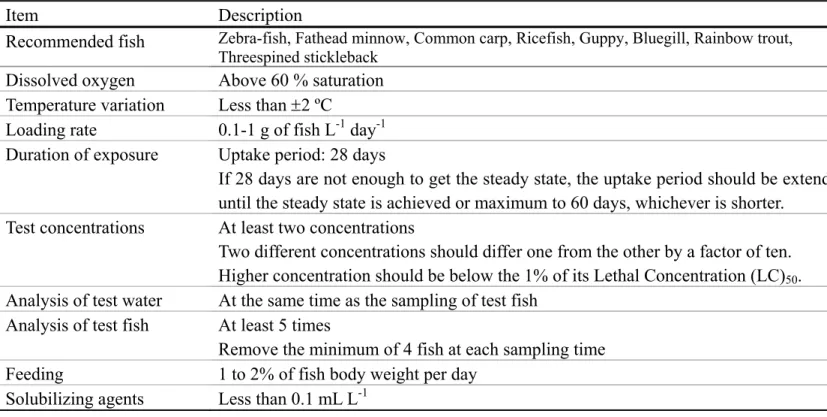
Table 1-3 Outline of the Organization for Economic Co-operation and Development (OECD) test guideline 305 Item Description
Recommended fish Zebra-fish, Fathead minnow, Common carp, Ricefish, Guppy, Bluegill, Rainbow trout, Threespined stickleback
Dissolved oxygen Above 60 % saturation Temperature variation Less than 2 ºC
Loading rate 0.1-1 g of fish L-1 day-1 Duration of exposure Uptake period: 28 days
If 28 days are not enough to get the steady state, the uptake period should be extended until the steady state is achieved or maximum to 60 days, whichever is shorter.
Test concentrations At least two concentrations
Two different concentrations should differ one from the other by a factor of ten.
Higher concentration should be below the 1% of its Lethal Concentration (LC)50. Analysis of test water At the same time as the sampling of test fish
Analysis of test fish At least 5 times
Remove the minimum of 4 fish at each sampling time Feeding 1 to 2% of fish body weight per day
Solubilizing agents Less than 0.1 mL L-1
Table 1-4 Physicochemical properties that have been proposed as screening criteria of bioaccumulation potential
Proposed parameter and criteria Remarks Reference
Deffa>0.95 nm Loss of membrane permeation Opperhuizen et al. (1985) log Kow >3 and Deff >1.05nm
and MWb >450
Possibly no bioaccumulation test required, very low probability for organic colorant accumulation
Anliker et al. (1988)
Dmaxc >1.47 nm log BCFs < 3.5 Dimitrov et al. (2003) Dmax, average 1.7 nm
Dmax, average >2.5 nm
Probability 0.5 for crossing cell membranes Probability near 0 for crossing cell membranes
Dimitrov et al. (2005)
MW >700 Less likely to bioaccumulate ECd (2003) Soe <0.2 mg L-1; or log Kow <4;
or Deff >1.05 nm or Dmax >1.5 nm
No potential for bioaccumulationfor organic pigments and possibly other substances such as dyes and surfactants
Horrocks et al. (2006)
MW >550, Dmax >2.0 nm and Deff >1.1 nm log BCF <3.69 Sakuratani et al. (2008) MW >550, Dmax >2.9 nm and Deff >1.4 nm log BCF <3.0 Sakuratani et al. (2008) The table is modified from that of Arnot et al. (2009).
a Deff, effective cross-sectional diameter.
b MW, molecular weight.
c Dmax, maximum diameter.
d EC, European Commission.
e So, solubility in octanol.
Mixing
Figure 1 Diagram of flow-through bioconcentration test system.
Waste
Ground water
Activated carbon or filter
Dilution water tank Aeration
Flow meter or micro quantitative pump
Stock solution tank Test tank
Dilution water Stock solution
of substance
Sewage treatment plant
Chapter 2
Comparison of bioconcentration factor and biomagnification factor for poorly water-soluble chemicals using common carp (Cyprinus carpio)
1. Introduction
The existing regulatory bioaccumulation assessment criteria are based on a bioconcentration factor (BCF). There are several experimental data which report the concentration dependence of the BCF i.e., underestimation of the actual BCF by reducing bioavailability of chemical substances via water in a bioconcentration test (aqueous exposure test) (Black and McCarthy 1988, Servos et al. 1989, Geyer et al.
1992 and 1994, Qiao and Farrell 2002, ECETOC 2003). The Organization for Economic Co-operation and Development (OECD) is currently considering the adoption of a test method for poorly water-soluble chemicals using a novel dietary exposure method to estimate a biomagnification factor (BMF) (Anonymous 2004a, b).
One of the author’s aims in this study was to clarify the relationship between water solubility and the magnitude of BCF (a concentration dependence of a BCF) for poorly water-soluble chemicals in an aqueous exposure test. The author’s second aim was to predict BCFs from BMFs for poorly water-soluble chemicals and to explore the effectiveness of these bioaccumulation endpoints.
2. Materials and methods Test substances
To clarify the relationship between water solubility and magnitude of BCF, the author selected BCF data for five chemical substances from the Japanese Chemical Substances Control Law (CSCL) test reports (http://www.safe.nite.go.jp /English /db.html). The selected substances were cyclododecane (CD; 1og Octanol-Water Partitioning Coefficient [Kow] = 6.12), anthracene (AN; log Kow = 4.35),
2-(2-hydroxy-3,5-di-tert -butylphenyl)-5-chlorobenzotriazole (CBT; log Kow = 6.91), 2-hydroxy-4-(octyl) phenyl phenylmethanone (PMN; log Kow = 6.96) and 2,2'-methylenebis (4-methyl-6-tert -butylphenol) (MBMBP; log Kow = 7.97) (Table 2-1).
Bioconcentration tests were performed with common carp (Cyprinus carpio) according to the OECD test guideline (TG) 305. The number and range of nominal concentrations were as follows: CD, three levels (3.0 × 10⁻³ to 3.0 × 10⁻¹ mg L-1); AN, four levels (1.5 × 10⁻³ to 1.5 mg L-1); CBT, five levels (1.0 × 10⁻⁵ to 4.0 × 10⁻¹ mg L-1);
PMN, four levels (2.0 × 10⁻⁴ to 5.0 × 10⁻¹ mg L-1); MBMBP, four levels (2.0 × 10⁻⁴ to 1.0 mg L-1). The water solubility of each test substance was measured by the column elution method following the OECD TG 105 (OECD 1995).
To clarify the relationship between the BCF and the BMF, the author selected eight aromatic compounds with different bioconcentration potentials (log Kow 4.32 to 8.99,) from the CSCL test reports and performed the dietary exposure test.
Hexachlorobenzene (log Kow 5.86) was used as a reference substance. The selected substances were 4,4'-methylenebis(2,6-di-tert-butylphenol) (Binox M, purity 99.1%), pentachlorobenzne (PeCB, purity 99.8%), 1-tert-butyl -3,5-dimethyl-2,4,6- trinitrobenzene (Musk-xylene, purity >99.0%), N,N'-di-2-naphthyl-p-phenylene diamine (DNPD, purity 101.7%), methoxychlor (MXC, purity >95.0%) and hexachlorobenzene (HCB, purity 99.7%) (Tokyo Chemical Industry Co., Ltd., Tokyo, Japan);
1,4-bis(isopropylamino) anthraquinone (Solvent Blue 36, purity 97.2%) and o- terphenyl (TP, purity >99.0%) (Sigma-Aldrich Japan, Tokyo, Japan); and 2,4-dichloro-1-(4-nitrophenoxy) benzene (NIP, purity 100%) (Wako Pure Chemical Industries Ltd., Osaka, Japan) (Table 2-2).
Test conditions for the dietary exposure test
Yearling common carp were cultivated in the author’s laboratory and acclimatized according to the OECD TG 305 (OECD 1996). The lipid content of the test fish was measured as described by Bligh and Dyer (Bligh and Dyer 1959). The body weights and lipid contents of the test fish at the beginning of exposure were (mean ± SD;
based on whole body wet weight) 3.23 ± 0.66 g and 3.89 ± 0.86%, respectively.
The dietary exposure test was performed according to Anon. (Anonymous 2004a, b). The test tank was a 100-L glass tank, and 60 to 110 test fish were used for each test. Test water was groundwater (1600 mL min–1) from the premises of the authors’ laboratory. The concentration of dissolved oxygen in the test water was maintained at 7.6 to 8.0 mg L-1. The photoperiod was 16 h:8 h (light:dark), and the temperature of the test water was kept at 25 ± 2 ºC. The uptake phase was 10 or 13 d, and the depuration phase was 14 to 38 d. Five substances (Binox M, PeCB, NIP, Solvent Blue 36, and DNPD) were exposed separately (single diet group), and Musk-xylene, TP, and MXC were mixed and exposed as a complex diet (complex diet group).
Exposure method for the dietary exposure test
The test diet of the single diet group was prepared as follows. Each test substance (50.0 mg) and reference substance (50.0 mg) were dissolved in 50 mL of solvent (tetrahydrofuran [Kanto Chemical Co., Inc., Tokyo, Japan] for Binox M, Solvent Blue 36, and DNPD; n-hexane [Kanto Chemical Co., Inc.] for PeCB; acetone [Wako Pure Chemical Industries, Ltd.] for NIP and HCB) to which 50 g of fish feed oil (Riken feed oil omega; Eiken Shoji Co., Ltd., Tokyo, Japan) was added. After thoroughly mixing this solution, the solvent was removed using a rotary evaporator. Fish pellet feed
(450 g, particle size 0.4 to 0.9 mm, lipid content ≥3%; Nippon Formula Feed Manufacturing Co., Ltd., Kanagawa, Japan) was added to the fish feed oil containing the test substances, mixed well, and then dried under ambient conditions for about 24 h.
Concentrations of the test substance in the diet were 100 µg g-1 (test substance) + 100 µg g-1 (reference substance, HCB) for all test substances. For the test diet of the complex diet group, three test substances were mixed in one single diet. Briefly, test substances and reference substance (Musk-xylene 100 mg, TP 100 mg, MXC 200 mg, HCB 50.0 mg) were dissolved in 10 mL corn oil (Sigma-Aldrich Japan) and stirred rapidly overnight at room temperature. Five hundred microliters of this spiked oil was added to 100 g of fish pellet feed (particle size 0.8 mm, lipid content ≥15%; Zeigler Brothers, Inc., Gardners, PA) and mixed thoroughly overnight. Concentrations of test substances with reference substance in the diet were Musk-xylene 50 µg g-1 + TP 50 µg g-1 + MXC 100 µg g-1 + HCB 25 µg g-1. The control diet was treated similarly as the test diet without the test and reference substances.
Food was added to the tank at a daily feeding rate (I) of 3% by weight (0.03 g diet g-1 live fish d-1), and the fish were allowed to feed naturally. The daily dose of feed was split into two feedings and provided 30 min apart. The amount of feed was adjusted at every sampling point, based on the weights of sacrificed fish, to account for growth during the experiment and to maintain a 3% feeding rate. Initial feeding was based on weight measurements of the control group prior to the start of the experiment. During the depuration phase, the control diet fish was fed to fish. The lipid contents of the test diets (foodlipid) during the test period were 15.4 ± 0.2% (single diet group; mean ± SD) and 16.6 ± 0.3% (complex diet group; mean ± SD).
Analysis of test substances
Test diets were analyzed in triplicate before and after the uptake phase. Test diets were homogenized in the extracting solvent (tetrahydrofuran for Binox M, Solvent Blue 36, and DNPD; n-hexane for PeCB and acetone for Musk-xylene, NIP, TP, MXC, and HCB); the supernatants, obtained by centrifugation (7000 g, 5 min), were diluted to appropriate concentrations with their extracting solvent and subjected to instrumental analysis as described below. Recovery rates of the analysis for the test substances and reference substance from the diet were 102% (Binox M), 91.2% (PeCB), 94.8%
(Musk-xylene), 102% (NIP), 99.7% (Solvent Blue 36), 92.3% (DNPD), 93.2% (TP), 101% (MXC), and 90.5% (HCB) (Figure 2-1).
During the depuration phase, concentrations of test substances in the test fish were measured at five to seven time points (e.g., after 1, 2, 8, 11, 15, 29 and 38 d) until the depuration half-life had been exceeded. For each sampling, five fish were removed from a tank and placed in one group. For the analysis of Binox M, fish samples were homogenized using a Polytron (Kinematica, Bohemia, NY). One gram of fish sample was spiked with hydrochloric acid (Kanto Chemical Co., Inc.) and dehydrated with anhydrous sodium sulfate (Kanto Chemical Co., Inc.). Acetonitrile (Wako Pure Chemical Industries, Ltd.) was added to these samples and refluxed (approx. 50 ºC, 60 min). n-Hexane was added to these samples, which were then cleaned by Sep-Pack Silica (Nihon Waters K.K., Tokyo, Japan). For the analysis of PeCB, fish samples were chopped with scissors and dehydrated with anhydrous sodium sulfate. n-Hexane was added to the samples and mixed thoroughly by a mechanical shaker SR-2DW (TAITEC, Saitama, Japan) and the filtrates were diluted to appropriate concentrations with n-hexane and subjected to instrumental analysis. For the analysis of Musk-xylene, NIP,
Solvent Blue 36, DNPD, TP, MXC and HCB, fish samples were shredded using a Polytron. Five grams of each fish sample was homogenized within the extracting solvent (as stated above, but used acetonitrile for Solvent Blue 36), and the supernatants obtained by centrifugation (7000 g, 5 min); supernatants were then diluted to appropriate concentrations with their extracting solvents and subjected to instrumental analysis as described below. The recovery rates of the test substances and reference substance from the fish were 76.9% (Binox M), 79.0% (PeCB), 78.0% (Musk-xylene), 108% (NIP), 85.3% (Solvent Blue 36), 84.6% (DNPD), 79.6% (TP), 79.3% (MXC), and 87.9%
(HCB) (Figure 2-2).
Binox M and DNPD were analyzed by liquid chromatography–tandem mass spectrometry (LC-MS/MS), and Solvent Blue 36 was analyzed by liquid chromatography–mass spectrometry (LC-MS) using an API 4000 instrument (AB SCIEX Japan, Ltd., Tokyo, Japan) and liquid chromatograph type 1100 Series (Agilent Technologies, Inc., Waldbronn, Germany) equipped with an L-column ODS (150 mm × 2.1 mm internal diameter; particle size 5 μm; Chemicals Evaluation and Research Institute, Tokyo, Japan). PeCB, Musk-xylene, NIP, TP, MXC, and HCB were analyzed by gas chromatography–mass spectrometry (GC-MS) using a QP2010 instrument (Shimadzu Co., Kyoto, Japan) equipped with an HP-5MS column (30 m × 0.25 mm;
Agilent Technologies, Inc., Santa Clara, CA).
Calculation of the BMF
The BMF was calculated using Equations 1 to 3 (Anonymous 2004a, b):
alpha () = (C0,fish × Ktotal)/(I × Cfood)/(1 – e–Ktotal × t) (1)
BMF = I × /Kelim (2)
BMFL = BMF/F (3)
where alpha () is the calculated uptake efficiency of test substances from the diet, C0,fish is the concentration of test substance in fish at the beginning of the depuration period derived from the regression line intercept, Ktotal is the overall elimination rate constants, I is the feeding rate of 0.03 g diet g-1 live fish d-1, Cfood is the average concentration in the diet, t is the duration of the uptake phase, Kelim is the growth- corrected elimination rate constants, BMFL is lipid-corrected biomagnification factor, F is the lipid-corrected factor (average lipid content in the fish based on wet weight [fishlipid]/ average lipid content in the diet based on wet weight [foodlipid]).
3. Results and discussion
Relationship between water solubility and magnitude of BCF
The relationships between exposure concentration and the BCFs of the test substances are shown in Table 2-3 and Figure 2-3. The difference in BCFs within test levels was greatest with CBT—the BCF (5700) at the test level of 1.0 × 10⁻⁵ mg L-1 was almost 6000 times greater than the BCF (1.0) at the test level of 4.0 × 10⁻¹ mg L-1. For all test substances, if the chemical concentration in the water is greater than that of water solubility, underestimation of the actual BCF would occur because the chemical concentration is likely to overestimate the concentration that can be absorbed via water (Arnot and Gobas 2006). The author also calculated the corrected BCF (BCF_corrected)
as shown in Equation 4 (Arnot and Gobas 2006):
BCF_corrected = BCF_measured × (Cw/Sw) (4)
where Cw is the measured test water concentration and Sw is the water solubility of the test substance with the same units (mg L-1). BCF_corrected was calculated only when Cw > Sw. As a result, the BCF_corrected seemed to have approximately the same magnitude as the measured BCF (BCF_measured) at nominal concentration which was less than the water solubility. This finding demonstrates that only freely dissolved chemicals are taken into the fish tissue. This result highlights the difficulty in performing bioconcentration tests for poorly water-soluble chemicals due to a very low nominal concentration level and the limitations in assessing the bioaccumulation of these chemical substances using BCF.
Relationship between BCF and BMF
No mortality occurred in any exposed or control fish. Concentrations of test substances in the test diet (Cfood) were maintained at more than 88.2% to 114% of the nominal concentration throughout the uptake phase. Parameters used for calculation for BMFs of test substances are shown in Table 2-4. Concentration of the test and reference substances concentration in test fish during test period is shown in Figure 2-4.
The use of a reference substance provides a check on the assimilation efficiency resulting from the method used to spike the diet, but the test substance and reference substance should not interact with each another (Anonymous 2004a, b). HCB as a reference substance is generally not metabolized by fish and should not affect the
metabolic capacity of the fish (Inoue et al. 2011). For the single diet group, the author observed a high alpha (α) for HCB (0.728 to 0.860), which indicates sufficient bioavailability of the spiked diet. A relatively low alpha (α) for HCB (0.488) was observed in the complex diet group. However, the BMFL of the two groups did not differ greatly (single diet group, 1.12 to 1.83; complex diet group, 1.08). These results suggest that the complex diet might affect chemical absorption across the gut. Additional study will be required to resolve this issue.
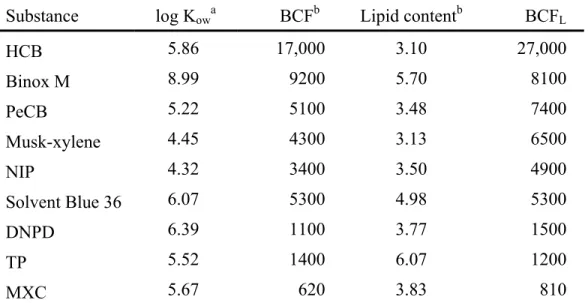
There is strong evidence that hydrophobic chemical substances reach equilibrium in the lipid fraction of an organism (Bertelsen et al. 1998; Tietge et al.
1998; Gobas et al. 1999, as cited in Arnot and Gobas 2006). Thus, it is important to normalize the BCF data to a set lipid fraction because the differences in lipid content between studies will affect the comparison of the results. The BCF data (based on wet weight) of the test substances were obtained from the CSCL test reports (http://www.safe.nite.go.jp/jcheck/english/top.action) and normalize to 5% lipid content BCF (BCFL) is shown in Table 2-5. The relationship between BCFL and the BMFL of the test substances is shown in Figure 2-5. BCFL ranged from 810 (MXC) to 27,000 (HCB), whereas BMFL ranged from 0.0340 (MXC) to 1.43 (Binox M). The high correlation between BCFL and BMFL of the test substances can be expressed as shown in Equation 5:
log (BCFL) = 0.828 log (BMFL) + 4.12, r2 = 0.873 (5)
The high correlation indicates that the uptake route (via water and diet) has no influence on bioconcentration and biomagnifications potentials of test substances.
Therefore, the author concluded that BMF as well as BCF is effective bioaccumulation endpoint for these test substances.
The BMFL of substances with BCFL =5000 ranged from 0.11 to 0.87 (including 95% confidence interval), indicating that these substances may not necessarily biomagnify at successive trophic levels in a food chain. On the oter hand, the BCFL of substances with BMFL = 1 ranged from 5600 to 30,000, indicating that these substances may bioaccumulate to the aquatic organism through combined water (bioconcentration) and diet (biomagnification) exposure. In a review of the application of bioaccumulation criteria in the Stockholm Convention, Kitano (2007) reported the correlation between BCF and BAF data of existing POPs and POP candidates. When placing the line for BCFL = 5600 and 30,000 (BMFL = 1) into the data of Kitano (2007), the author found that trophic magnification (e.g., polychlorinated biphenyls [PCBs]) or dilution (e.g., Lindane) of the chemical substances is likely to occur around these boundary lines (Figure 2-6). It is suggested that these boundary lines (BCFL = 5600 to 30,000) may reflects the BCF and BAF data of POPs.
The BCF can also be determined from the ratio of the uptake rate constants (k1) and the depuration rate constants (k2) assuming first order kinetics (OECD 1996), and there are several BCF models using k1 and k2 values (Sijm et al 1995, Barber 2003, Hendriks et al 2003, Arnot and Gobas 2004). The author predict a 5% lipid normalized BCFL (BCFL_predicted) using estimated k1 from the BCF models (Sijm et al 1995, Barber 2003, Hendriks et al 2003, Arnot and Gobas 2004) and growth-corrected elimination rate constants (Kelim) data in the author’s dietary exposure tests (Table 2-4).
The variation of BCFL_predicted is less than one order of magnitude compared to
measured BCFL (BCFL_measured) (ratio of BCFL_predicted/BCFL_measured ranged from 0.2 to 4.8) (Table 2-6). However, the bioaccumulation classification of substances would differ between the BCF models (e.g., PeCB could be classified as a bioaccumulative (B) substance not a very bioaccumulative (vB) substance).
BCFL_predicted of the BINOX M (log Kow = 8.99) was overestimated for all models, which indicates that these BCF models may be applicable to organic chemical substances with a log Kow in the approximate range of 1 to 9 (Arnot and Gobas 2004).
4. Conclusion
The author confirmed that the concentration dependence of the BCF for a chemical substance relies strongly on its water solubility, i.e., only the freely dissolved concentration is bioavailable. This study highlighted the difficulty in performing bioconcentration tests for poorly water-soluble chemicals due to a very low nominal concentration level and the limitations in assessing the bioaccumulation of these chemical substances using BCF. For the poorly water-soluble chemicals, the dietary bioaccumulation test is a meaningful method for bioaccumulation assessment. For selected nine aromatic compounds (including HCB), BMF shows a high correlation with BCF, indicating that BMF as well as BCF is effective bioaccumulation endpoint for these test substances. This equation for determining BCF from BMF also reflects the field monitoring data of POPs.
Table 2-1 Chemical structures of test substances used for the study of the relationship between water solubility and magnitude of bioconcentration factor [BCF]
Cyclododecane (CD) Anthracene (AN) CAS number 294-62-2 CAS number 120-12-7
2-(2-hydroxy-3,5-di-tert-butylphenyl)-5-chlorobenzotriazole (CBT) CAS number 3864-99-1
2-hydroxy-4-(octyl)phenyl phenylmethanone (PMN) CAS number 1843-05-6
2,2'-methylenebis (4-methyl-6-tert-butylphenol) (MBMBP) CAS number 119-47-1
N N Cl N
HO
O OH
O(CH2)7CH3
OH OH
Cl
Cl Cl
Cl
Cl Cl
Table 2-2 Chemical structures of test substances used for the study of the relationship between BCF and biomagnification factor [BMF])
Hexachlorobenzene (HCB) 4,4'-methylenebis(2,6-di-tert-butylphenol) (Binox M) CAS number 118-74-1 CAS number 118-82-1
Pentachlorobenzne (PeCB) 2, 4-dichloro-1-(4-nitrophenoxy) benzene (NIP) CAS number 608-93-5 CAS number 1836-75-5
1-tert-butyl -3,5-dimethyl-2,4,6- trinitrobenzene (Musk-xylene) CAS number 81-15-2
1,4-bis(isopropylamino)anthraquinone (Solvent Blue 36) o- terphenyl (TP) CAS number 14233-37-5 CAS number 84-15-1
N,N'-di-2-naphthyl-p-phenylenediamine (DNPD) Methoxychlor (MXC) CAS number 93-46-9 CAS number 72-43-5
CH2 HO
C(CH3)3
C(CH3)3
OH C(CH3)3
C(CH3)3
O2N
NO2 O2N
NH
HN Cl
Cl Cl
O O
Cl
Cl Cl
Cl
Cl Cl
O Cl
Cl
NO2
O
O HN
NH CHCH3
H3CHC CH3
CH3
Table 2-3 Exposure concentration and BCFs of test substances
Substancea log Kowb Water solubility (mg L-1) (Sw)c Exposure concentration (mg/L) (Cw) BCF_measuredd (BCF_corrected)e 2.2 × 10⁻¹ 1000 (21,000)
2.3 × 10⁻² 5800 (13,000) 2200 (5000)
CD 6.12 1.0 × 10⁻²
2.6 × 10⁻³ 9200
1.7 × 100 100 (3400) 100 (3400) 1.3 × 10⁻¹ 1600 (4200) 1800 (4700)
1.2 × 10⁻² 2200 2200
AN 4.35 5.0 × 10⁻²
1.5 × 10⁻³ 1800
4.3 × 10⁻¹ 1.0 (13,000)
3.6 × 10⁻² 6.2 (6800)
9.5 × 10⁻⁴ 990 (28,000)
9.3 × 10⁻⁵ 5000 (14,000) 7300 (20,000)
CBT 6.91 3.3 × 10⁻⁵
9.5 × 10⁻⁶ 5700
4.2 × 10⁻¹ 25 (1600)
3.1 × 10⁻² 42 (200)
2.0 × 10⁻³ 170
PMN 6.96 6.4 × 10⁻³
2.0 × 10⁻⁴ 110
9.5 × 10⁻¹ 27 (1300)
9.1 × 10⁻² 100 (480)
MBMBP 7.97 1.9 × 10⁻²
1.8 × 10⁻³ 730
1.6 × 10⁻⁴ 550
a CD, cyclododecane; AN, anthracene; CBT, 2-(2-hydroxy-3,5-di-tert-butylphenyl)-5-chlorobenzotriazole; PMN, [2-hydroxy-4-(octyl)phenyl] phenyl methanone;
MBMBP, 2,2’-methylenebis (4-methyl-6-tert-butylphenol).
b Calculated by using Kowwin v. 1.68 (US Environmental Protection Agency).
c Measured by following the OECD TG 105 (OECD 1995).
d Average BCF on the final day of exposure phase.
e BCF_corrected estimates derived from equation (4) (Arnot and Gobas 2006).
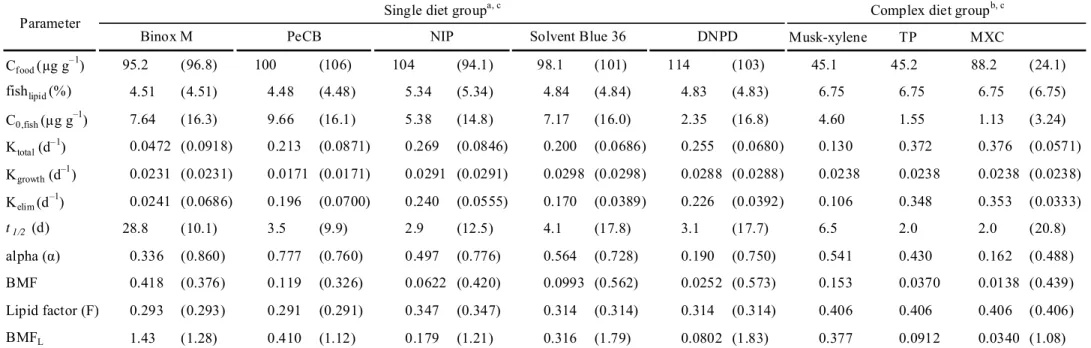
Table 2-4 Parameters used for calculation for BMFs of test substances
Binox M, 4,4'-methylenebis (2,6-di-tert -butylphenol); PeCB, pentachlorobenzene; NIP, 2,4-dichloro-1-(4-nitrophenoxy) benzene; Solvent Blue 36, 1,4-bis(isopropylamino) anthraquinone; DNPD, N,N'-di-2-naphthyl-p-phenylenediamine; Musk-xylene,
1-tert-butyl-3,5-dimethyl-2,4,6-trinitrobenzene; TP, o-terphenyl; MXC, methoxychlor; HCB, hexachlorobenzene.
Cfood, average concentration in diet; fishlipid, average lipid content in fish based on wet weight; C0,fish, concentration in fish at the beginning of depuration derived from the regression line intercept; Ktotal, overall elimination rate constants; Kgrowth, overall growth rate constants; Kelim, growth-corrected elimination rate constants; t1/2 , growth-corrected elimination half life; alpha (α), calculated uptake efficiency of test substances from diet; BMF, biomagnification factor; Lipid factor (F), lipid-corrected factor (average lipid content in diet based on wet weight
[fishlipid]/[foodlipid]); BMFL, lipid-corrected biomagnification factor.
a Single diet group, group of one test substance + reference substance (HCB).
b Complex diet group, group of three test substances + reference substance (HCB).
c Parentheses show values of the reference substance (HCB).
Musk-xylene TP MXC
Cfood (µg g–1) 95.2 (96.8) 100 (106) 104 (94.1) 98.1 (101) 114 (103) 45.1 45.2 88.2 (24.1)
fishlipid (%) 4.51 (4.51) 4.48 (4.48) 5.34 (5.34) 4.84 (4.84) 4.83 (4.83) 6.75 6.75 6.75 (6.75)
C0,fish (µg g–1) 7.64 (16.3) 9.66 (16.1) 5.38 (14.8) 7.17 (16.0) 2.35 (16.8) 4.60 1.55 1.13 (3.24)
Ktotal (d–1) 0.0472 (0.0918) 0.213 (0.0871) 0.269 (0.0846) 0.200 (0.0686) 0.255 (0.0680) 0.130 0.372 0.376 (0.0571)
Kgrowth (d–1) 0.0231 (0.0231) 0.0171 (0.0171) 0.0291 (0.0291) 0.0298 (0.0298) 0.0288 (0.0288) 0.0238 0.0238 0.0238 (0.0238)
Kelim (d–1) 0.0241 (0.0686) 0.196 (0.0700) 0.240 (0.0555) 0.170 (0.0389) 0.226 (0.0392) 0.106 0.348 0.353 (0.0333)
t1/2 (d) 28.8 (10.1) 3.5 (9.9) 2.9 (12.5) 4.1 (17.8) 3.1 (17.7) 6.5 2.0 2.0 (20.8)
alpha (α) 0.336 (0.860) 0.777 (0.760) 0.497 (0.776) 0.564 (0.728) 0.190 (0.750) 0.541 0.430 0.162 (0.488)
BMF 0.418 (0.376) 0.119 (0.326) 0.0622 (0.420) 0.0993 (0.562) 0.0252 (0.573) 0.153 0.0370 0.0138 (0.439)
Lipid factor (F) 0.293 (0.293) 0.291 (0.291) 0.347 (0.347) 0.314 (0.314) 0.314 (0.314) 0.406 0.406 0.406 (0.406)
BMFL 1.43 (1.28) 0.410 (1.12) 0.179 (1.21) 0.316 (1.79) 0.0802 (1.83) 0.377 0.0912 0.0340 (1.08)
Binox M
Single diet groupa, c Complex diet groupb, c
Parameter
DNPD Solvent Blue 36
NIP PeCB