Published by Research Institute for Humanity and NatureSanitation Value Chain Vol. 3 (01) pp. 025-039, 2019
Model in Light of Time Allocation: Case of Rural Households in Burkina Faso
Ken USHIJIMA1, Seydou DICKO2, Taro YAMAUCHI1,3, Naoyuki FUNAMIZU4
1 Research Institute for Humanity and Nature, Japan
2 Graduate School of International Media, Communication, and Tourism Studies, Hokkaido University, Japan
3 Faculty of Health Sciences, Hokkaido University, Japan
4 Muroran Institute of Technology, Japan
Abstract
In a pilot study of an agro-sanitation business model introduced in Burkina Faso, only one of four pilot families succeeded in earning cash from their agro-sanitation business. We conducted a time allocation survey of these pilot families and several control families to measure the additional workload resulting from the application of the agro-sanitation business model. We then sought to identify differences between the family that succeeded in its adoption of the model and those that did not, and attempted to determine the factors that explained these differences. Overall, we found that (1) the additional workload seems small in comparison to other work, (2) among the activities associated with the agro-sanitation business, processing products for sale and selling in the market require considerable time, although the time for these activities was not distinguishable from the time required in customary practice, (3) characteristic differences in time allocation were mainly observed in working-age females, (4) a significant feature of the working- age females in the successful pilot family was the allocation of considerable time for economic activity in the dry season and for subsistence activities in the rainy season, and the relatively short time devoted to housekeeping in the rainy season and to personal activities throughout the year, and (5) important factors for success appear to be that the women in the family are familiar with selling their products in the market and are able to manage their time efficiently. Based on these findings, reasonable strategy for diffusing the agro-sanitation business model should include focusing on women as the key players, identifying women who have features similar to the women in the successful family described in this study, and devising an effective cultivation schedule that considers their seasonal time allocation.
Keywords: agro-sanitation business, sanitation value chain, time allocation
Introduction
A resource-oriented sanitation system that utilizes human excreta as a valuable resource is considered by many to be an important countermeasure to improve sanitation in developing countries and a promising concept for the creation of a sustainable recycling society (e.g., Lopez et al. 2001; Winblad and Simpson-Hébert 2004). Many related technologies have been developed (e.g., Porto and Steinfeld 2000; Ito et al. 2008), and there have been a number of reported trials. However, such systems continue to struggle for acceptance by potential users.
Ushijima et al. (2018) pointed out the mismatch between the wants of toilet users and the generally encouraged technology and actions promoting sanitation improvement or the building of a recycling society, and noted the importance of the social system in establishing the value chain or value network to solve this mismatch. As one
application, Ushijima et al. (2019) proposed an agro-sanitation business model for the West African country of Burkina Faso based on the sanitation value chain idea. The model attempts to increase the income of local farmers by use of the agro-sanitation system and enable the farmers to use the sanitation system sustainably.
In this model, the farmers use an agro-sanitation asset consisting of a composting toilet, a shower room with a grey water treatment facility, and a urinary bowl with a storage tank. From this asset, the farmers obtain soil conditioner, irrigation water and liquid fertilizer (Figure 1). The three obtained agricultural resources are used not for the farmers’ main crop field but rather for a small vegetable garden, since, as the current value flow network (Figure 2) shows, their major cash-producing activity is selling vegetables from a small garden. Hijikata (2019)
Fig.1 Agro-sanitation asset and value chain
Fig.2 Current value flow network in rural household in Burkina Faso
Current Value Flow
Figure 1. Agro-sanitation asset and value chain. (Drawn by the author)Figure 2. Current value flow network in rural household in Burkina Faso.
(Reproduced from Ushijima et al. 2015: Figure 1) Irrigation
Grey water treatment
Vegetable garden
Composting Toilet
Soil conditioner
Agro-sanitation products Income
Market Liquid Fertilizer
Urine Urine
Gray water Shower room
+urinary bowl
Household
Feces
Gray water
Rainfall Crop Field
Money
Deep Well
Main Food Work
Work
Work
Shallow Well (or reservoir)
Money
Synthetic Fertilizer
Vegetable
Money Vegetable
Garden
Money Detergent
defecation urination
bathing Kitchen
calculated the expected maximum income increase from this business model on the basis of designing a practical crop rotation, stating that the increase ranges from 8,637 to 14,526 FCFA per capita per year. Although this corresponds to only 11 to 22 Euros, the gross national income (GNI) in Burkina Faso is approximately 355,000 FCFA per capita per year. Furthermore, a previous study by Ikemi (2017) that included the study sites used in our present study indicates that 53% of respondents in the study had an income of less than 125,000 FCFA per year.
Given this income information, Hijikata’s estimate of the expected maximum income increase from employing the agro-sanitation business model seems not insignificant.
The SATREPS project, titled “Improving Sustainable Water and Sanitation Systems in the Sahel Region in Africa: The Case of Burkina Faso” (Funamizu 2017), conducted a field test of the model with four pilot families in Burkina Faso. The pilot families were not compelled to use the agricultural resources produced from the agro- sanitation asset for cultivating vegetables to be sold; rather, they were allowed to choose any of their crops or vegetables to cultivate. As a result, all four pilot families chose to cultivate vegetables for their own consumption during the first year of the study. These included okra, eggplant, and cowpeas. However in the second year, one of the four pilot families chose to cultivate vegetables such as chili to sell in the market and succeeded in earning a cash return. Although we were unable to determine the exact amount of income that was derived from this activity, we consider this case a successful application of the sanitation business model since the family embraced the concept and used it to increase their income on their own initiative.
This study had three main objectives: (1) to evaluate the additional workload required in adopting the agro- sanitation business model, (2) to identify the differences between successful cases and the others, and to determine what factors explained these differences, and (3) to suggest appropriate strategy for diffusing the agro-sanitation business concept. To pursue these objectives, a time allocation survey was used.
1. Materials and method
1.1. Overview of the study site
In Burkina Faso, where the study was conducted, home owners are obligated by law to construct a wastewater treatment facility on their land and to manage it appropriately (Law of public sanitation, No. 022-2005/AN).
However, the law does not provide a clear strategy, a detailed support system, or the technology for doing so. As a result, only 7% of the population in the rural areas of Burkina Faso had access to basic sanitation facilities in 2015 (UNICEF 2019). Many people urinate in the walled shower space in their living area, and open defecation is still common in these areas (Ushijima et al. 2012). The 2013 under-five mortality rate has been reported as 84.6 per 1000 live births (WHO 2018), with diarrhea causing 10% of these deaths (WHO and UN 2015). Water and sanitation are clearly urgent issues in Burkina Faso. However, the implementation of a modern sanitation system requires a high level of governance and a substantial economic background. The GNI of Burkina Faso in 2017 was only 590 USD per capita (World Bank 2019), which makes it extremely difficult to introduce a modern sanitation system in the near term.
Burkina Faso is an agricultural country. More than 90% of the labor force is employed in the agriculture sector, and 29.9% of GDP is produced by agriculture (FAPDA 2014). However, the environment for agriculture is severe.
Burkina Faso is located in the Sahel region and its climate is of the semiarid type, which means there is little precipitation. Furthermore, irrigation facilities are very rare in rural areas of the country. The main soil type is Lixisols, which requires frequent fertilization and careful erosion control (Driessen and Deckers 2001).
1.2. Target families
For this study, the pilot and control families were chosen from two villages (village K and village B) in the Oubritenga province of Burkina Faso (Figure 3). The residents of village K are Mossi, the major ethnic group in Burkina Faso; they speak Mooré, a Gur language of the Niger-Congo language family. Most of the villagers are crop farmers. Their religions include Islam, Christianity, and Animism. Village B is inhabited by the Fulani people; they speak Fulfulde, a North West Atlantic language of the Niger-Congo language family. As far as we could determine, all the people in village B are Muslim. Originally nomadic pastoralists, they changed to a settled lifestyle and combined herd and farm activities some decades ago.
The chiefs of each village selected one extended family and one nuclear family from their village to serve as pilot families (details are provided in Table 1). The components of the agro-sanitation asset were installed in the living areas of each of the four pilot families by the SATREPS project in June 2012, and a field test was conducted until February 2015. As mentioned in the introduction, only one of the families (the KPLE family in Table 1) chose to cultivate vegetables to sell using the agro-sanitation asset and succeeded in earning cash from their sales.
Figure 3. Location of Oubritenga Province, Burkina Faso.
Table 1. Attribute of target families.
Village K village B village
Pilot/control Pilot family Control family Pilot family Control family Size category Extended
family Nuclear
family Extended
family Nuclear
family Extended
family Nuclear
family Extended
family Nuclear family
Household ID* KPLE KPLN KCTE KCTN BPLE BPLN BCTE BCTN
Household member
Religion 21
Christian 6
Christian 18
Muslim 6
Christian 25
Muslim 9
Muslim 28
Muslim 14
Muslim
Work-female (person) 4 1 4 1 7 1 7 5
Work-male (person) 4 1 1 1 7 3 7 3
School-female (person) 6 2 4 1 4 2 4 2
School-male (person) 2 1 9 3 6 3 7 1
Other (person) 5 1 0 0 2 0 3 3
*First character indicate village name (K or B), second and third indicate pilot (PL) or control (CT), last indicate extended family (E) or nuclear family (N).
African continent 1°18´ W
Ouagadougou Ziniaré
12°35´ N Burkina Faso
Oubritenga Province
Ideally, in order to be in a position to better discuss the impact of this agro-sanitation business model application, the survey should have been administered to the same pilot families before and after the application. However, the project schedule did not allow us to do so. To offset this limitation, four additional control families were selected from the same villages using the same procedure and criteria as were used for the pilot families. In conducting our analysis, we classified members of the families participating in the study into four categories according to gender and whether they were school age or working age. The four categories were labeled “Work-female,” “School- female,” “Work-male” and “School-male.” The “Other” category in Table 1 includes children under five years of age and persons who were continuously absent from the compound for more than half of the observation periods.
We excluded the data for this “Other” category from the analysis.
1.3. Hypotheses
Before starting the field test, we formulated three hypotheses relating to the research objectives mentioned above:
(1) An increase in income can be an important incentive; therefore, once the pilot family understands that the agro-sanitation asset can be used to earn money, they will spontaneously begin their agro-sanitation business.
(2) Although the husband makes most of the important decisions in the traditional cultures of both villages, the agro-sanitation asset will be maintained at the practical level primarily by women, and therefore women are the real key persons in the family’s acceptance of the agro-sanitation business.
(3) Given the overall workload of crop cultivation, the additional workload associated with the agro-sanitation business model is acceptably small.
Based on the time allocation results of the survey and additional qualitative information, the validity of these hypotheses is assessed and promising strategy for encouraging the application of the agro-sanitation business model are proposed.
1.4. Time allocation survey
This study employed a modified household rounds spot-check method. In the original household rounds spot- check method (Yamauchi 2018), the observer would make his/her rounds at several households at a predetermined time interval and check the activities of all household members. However, in this study, we arranged to have one observer or one assistant observer for each family, and had the observer or assistant observer record the household members’ activities at predetermined time intervals. Before going into the field, the assistants received instruction on how to observe. However, we were unable to conduct a field trial before initiating the survey. Therefore, we prepared one or two extra observers who made their rounds at each household site periodically, usually three or four times each day, and conducted a data check and briefing with the observers and assistant observers should there be any questions/problems. The extra observer(s) would also temporarily replace the regular observers or assistants in order to give them a break from their duties. Thus, this modified method reduced the burden on each observer and enabled us to prepare a sufficient number of assistant observers within our limited training time.
We do, however, recognize the disadvantage of this modified method in that it presented a higher risk of bias and uncertainty caused by the use of immature assistants and the temporary replacement of the regular observers.
A time allocation survey was conducted in the two villages, first in village K, then in village B. In each village, the two pilot families and the two control families were observed simultaneously. We assigned an observer or assistant observer to each household’s compound for 72 hours (except for nighttime); during the period of observation, the observer or assistant observer monitored the activities of all household members every 30 minutes. Observation began each day at 5:30 a.m. and ended at 9:00 p.m., which meant that activities
were observed 32 times in a day, or a total of 96 times over the 72-hour observation period. In the subsequent analysis, the activities observed at each prescribed point in time were considered as representative of the household member’s activity during the full 30-minute period associated with that point in time, as was the case in the original household rounds spot-check method. Observed activities were classified into seven groups:
subsistence, housekeeping, economic, personal, social and educational, miscellaneous, and unknown. The
“unknown” category was used for cases in which the observer was unable to identify the activity, such as when the activity took place in a private room. These seven groups were further divided into sub-groups, as shown in Tables 2 and 3. Because our focus was on the agro-sanitation business model, we separately identified the cultivation of a small vegetable garden as “commercial cultivation” and assigned it to the “economic” group, whether or not the products from the activity were actually sold.
Observers were also asked to note, insofar as possible, what household members were doing between the scheduled observation times. Data from these informal observations were used as qualitative, supplemental information.
Generally, a time allocation survey should be done over a long period of time. However, due to the limitation of project resources, including manpower, 72 hours was the maximum feasible observation period.
To compensate for this limitation, the 72-hour observation periods were repeated four times: April 2013 (late dry season), July 2013 (early rainy season), October 2013 (late rainy season) and December 2013 to January 2014 (early dry season).
2. Results and discussions
2.1. Differences between pilot and control families
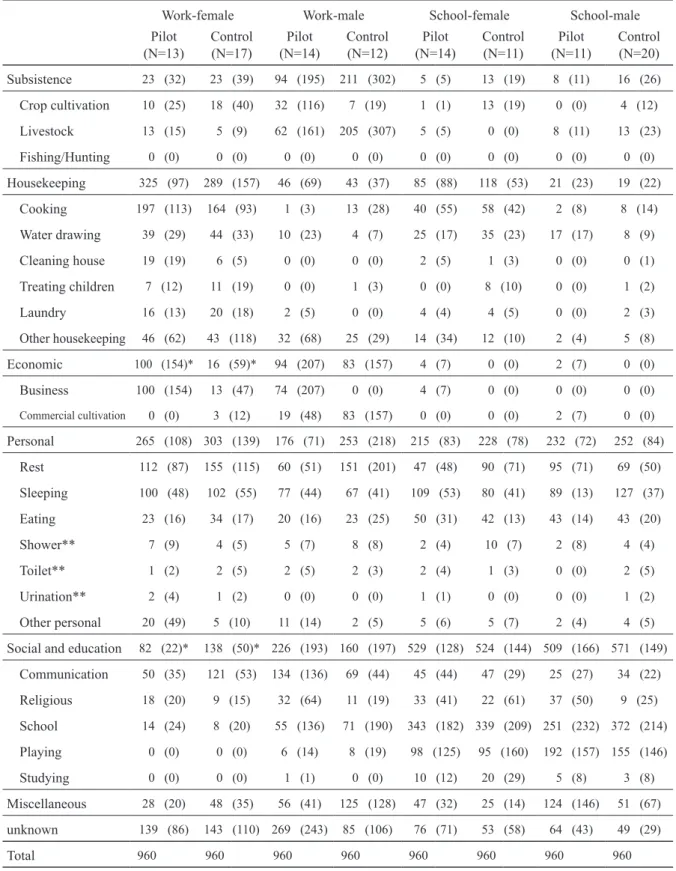
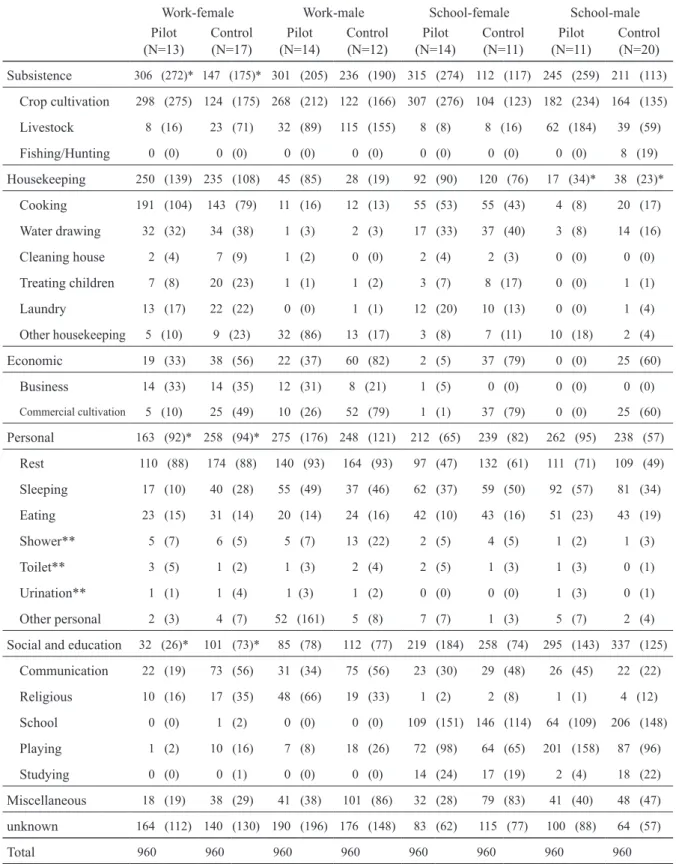
In order to assess the additional workload associated with the agro-sanitation asset, we compared the time allocation data of the pilot families and the control families in the rainy season (Table 2) and the dry season (Table 3).
During the rainy season, most household members, including the children, were involved in crop-related work.
Our time allocation results for this period indicate that substantial time was devoted to the “crop cultivation”
activity, a sub-group of the “subsistence” activity, in both the pilot and control families. However, we found that the “subsistence” activity times of the Work-female group in the pilot families was significantly longer than in the control families (Mann-Whitney U test, p<0.05). On the other hand, the “personal” activity and “social and education” activity times of the Work-female group in the pilot families were significantly shorter than in the control families. As for other activities during the rainy season, the “housekeeping” activity time of School-males in the pilot families was significantly shorter than in the control families. No significant differences between the Work-female/School-male groups in the pilot and control families were observed for other activities. There were no significant differences for any of the activities between Work-males/School-females in the pilot and control families during the rainy season. Overall, the significant differences that were found in the rainy season are interesting but seem not to be directly related to the application of the agro-sanitation asset.
The dry season data also reveals some differences between the pilot and control families. For example, the
“economic” activity time of the Work-females in the pilot families was significantly longer than in the control families (Mann-Whitney U test, p<0.05). On the other hand, the “social and education” activity time of the Work-females in the pilot families was significantly shorter than in the control families (Mann-Whitney U test, p<0.05). No significant difference was observed in other activities of the Work-females, nor were any significant differences found between the pilot and control families for any of the activity times of School-females, Work- males, and School-males in the dry season. In the observed “economic” activities of the Work-females in the pilot
Work-female Work-male School-female School-male Pilot
(N=13) Control
(N=17) Pilot
(N=14) Control
(N=12) Pilot
(N=14) Control
(N=11) Pilot
(N=11) Control (N=20) Subsistence 23 (32) 23 (39) 94 (195) 211 (302) 5 (5) 13 (19) 8 (11) 16 (26) Crop cultivation 10 (25) 18 (40) 32 (116) 7 (19) 1 (1) 13 (19) 0 (0) 4 (12) Livestock 13 (15) 5 (9) 62 (161) 205 (307) 5 (5) 0 (0) 8 (11) 13 (23) Fishing/Hunting 0 (0) 0 (0) 0 (0) 0 (0) 0 (0) 0 (0) 0 (0) 0 (0) Housekeeping 325 (97) 289 (157) 46 (69) 43 (37) 85 (88) 118 (53) 21 (23) 19 (22)
Cooking 197 (113) 164 (93) 1 (3) 13 (28) 40 (55) 58 (42) 2 (8) 8 (14) Water drawing 39 (29) 44 (33) 10 (23) 4 (7) 25 (17) 35 (23) 17 (17) 8 (9) Cleaning house 19 (19) 6 (5) 0 (0) 0 (0) 2 (5) 1 (3) 0 (0) 0 (1) Treating children 7 (12) 11 (19) 0 (0) 1 (3) 0 (0) 8 (10) 0 (0) 1 (2) Laundry 16 (13) 20 (18) 2 (5) 0 (0) 4 (4) 4 (5) 0 (0) 2 (3) Other housekeeping 46 (62) 43 (118) 32 (68) 25 (29) 14 (34) 12 (10) 2 (4) 5 (8) Economic 100 (154)* 16 (59)* 94 (207) 83 (157) 4 (7) 0 (0) 2 (7) 0 (0) Business 100 (154) 13 (47) 74 (207) 0 (0) 4 (7) 0 (0) 0 (0) 0 (0) Commercial cultivation 0 (0) 3 (12) 19 (48) 83 (157) 0 (0) 0 (0) 2 (7) 0 (0) Personal 265 (108) 303 (139) 176 (71) 253 (218) 215 (83) 228 (78) 232 (72) 252 (84)
Rest 112 (87) 155 (115) 60 (51) 151 (201) 47 (48) 90 (71) 95 (71) 69 (50) Sleeping 100 (48) 102 (55) 77 (44) 67 (41) 109 (53) 80 (41) 89 (13) 127 (37) Eating 23 (16) 34 (17) 20 (16) 23 (25) 50 (31) 42 (13) 43 (14) 43 (20) Shower** 7 (9) 4 (5) 5 (7) 8 (8) 2 (4) 10 (7) 2 (8) 4 (4) Toilet** 1 (2) 2 (5) 2 (5) 2 (3) 2 (4) 1 (3) 0 (0) 2 (5) Urination** 2 (4) 1 (2) 0 (0) 0 (0) 1 (1) 0 (0) 0 (0) 1 (2) Other personal 20 (49) 5 (10) 11 (14) 2 (5) 5 (6) 5 (7) 2 (4) 4 (5) Social and education 82 (22)* 138 (50)* 226 (193) 160 (197) 529 (128) 524 (144) 509 (166) 571 (149)
Communication 50 (35) 121 (53) 134 (136) 69 (44) 45 (44) 47 (29) 25 (27) 34 (22) Religious 18 (20) 9 (15) 32 (64) 11 (19) 33 (41) 22 (61) 37 (50) 9 (25) School 14 (24) 8 (20) 55 (136) 71 (190) 343 (182) 339 (209) 251 (232) 372 (214) Playing 0 (0) 0 (0) 6 (14) 8 (19) 98 (125) 95 (160) 192 (157) 155 (146) Studying 0 (0) 0 (0) 1 (1) 0 (0) 10 (12) 20 (29) 5 (8) 3 (8) Miscellaneous 28 (20) 48 (35) 56 (41) 125 (128) 47 (32) 25 (14) 124 (146) 51 (67) unknown 139 (86) 143 (110) 269 (243) 85 (106) 76 (71) 53 (58) 64 (43) 49 (29)
Total 960 960 960 960 960 960 960 960
* Statistically significant difference by Mann-Whitney U test (P<0.05)
**Applied agro-sanitation asset had toilet room and shower room separately, and urinary bowl was set in shower room. Therefore, observer estimated the target person’s activity in shower room as “shower” if observer heard the sounds of taking shower and the person came out with wet hair, and as “urination” if the person came out quickly with dried hair. There also are possibility to urinate in toilet room, however we could not distinguish it, therefore we classified all activities in toilet room just as “toilet.”
Table 2. Averaged time allocation of pilot and control families in dry season. Unit is minutes / day, and standard deviation in parenthesis.
Work-female Work-male School-female School-male Pilot
(N=13) Control
(N=17) Pilot
(N=14) Control
(N=12) Pilot
(N=14) Control
(N=11) Pilot
(N=11) Control (N=20) Subsistence 306 (272)* 147 (175)* 301 (205) 236 (190) 315 (274) 112 (117) 245 (259) 211 (113)
Crop cultivation 298 (275) 124 (175) 268 (212) 122 (166) 307 (276) 104 (123) 182 (234) 164 (135) Livestock 8 (16) 23 (71) 32 (89) 115 (155) 8 (8) 8 (16) 62 (184) 39 (59) Fishing/Hunting 0 (0) 0 (0) 0 (0) 0 (0) 0 (0) 0 (0) 0 (0) 8 (19) Housekeeping 250 (139) 235 (108) 45 (85) 28 (19) 92 (90) 120 (76) 17 (34)* 38 (23)*
Cooking 191 (104) 143 (79) 11 (16) 12 (13) 55 (53) 55 (43) 4 (8) 20 (17) Water drawing 32 (32) 34 (38) 1 (3) 2 (3) 17 (33) 37 (40) 3 (8) 14 (16) Cleaning house 2 (4) 7 (9) 1 (2) 0 (0) 2 (4) 2 (3) 0 (0) 0 (0) Treating children 7 (8) 20 (23) 1 (1) 1 (2) 3 (7) 8 (17) 0 (0) 1 (1) Laundry 13 (17) 22 (22) 0 (0) 1 (1) 12 (20) 10 (13) 0 (0) 1 (4) Other housekeeping 5 (10) 9 (23) 32 (86) 13 (17) 3 (8) 7 (11) 10 (18) 2 (4) Economic 19 (33) 38 (56) 22 (37) 60 (82) 2 (5) 37 (79) 0 (0) 25 (60)
Business 14 (33) 14 (35) 12 (31) 8 (21) 1 (5) 0 (0) 0 (0) 0 (0) Commercial cultivation 5 (10) 25 (49) 10 (26) 52 (79) 1 (1) 37 (79) 0 (0) 25 (60) Personal 163 (92)* 258 (94)* 275 (176) 248 (121) 212 (65) 239 (82) 262 (95) 238 (57) Rest 110 (88) 174 (88) 140 (93) 164 (93) 97 (47) 132 (61) 111 (71) 109 (49) Sleeping 17 (10) 40 (28) 55 (49) 37 (46) 62 (37) 59 (50) 92 (57) 81 (34) Eating 23 (15) 31 (14) 20 (14) 24 (16) 42 (10) 43 (16) 51 (23) 43 (19) Shower** 5 (7) 6 (5) 5 (7) 13 (22) 2 (5) 4 (5) 1 (2) 1 (3) Toilet** 3 (5) 1 (2) 1 (3) 2 (4) 2 (5) 1 (3) 1 (3) 0 (1) Urination** 1 (1) 1 (4) 1 (3) 1 (2) 0 (0) 0 (0) 1 (3) 0 (1) Other personal 2 (3) 4 (7) 52 (161) 5 (8) 7 (7) 1 (3) 5 (7) 2 (4) Social and education 32 (26)* 101 (73)* 85 (78) 112 (77) 219 (184) 258 (74) 295 (143) 337 (125)
Communication 22 (19) 73 (56) 31 (34) 75 (56) 23 (30) 29 (48) 26 (45) 22 (22) Religious 10 (16) 17 (35) 48 (66) 19 (33) 1 (2) 2 (8) 1 (1) 4 (12) School 0 (0) 1 (2) 0 (0) 0 (0) 109 (151) 146 (114) 64 (109) 206 (148) Playing 1 (2) 10 (16) 7 (8) 18 (26) 72 (98) 64 (65) 201 (158) 87 (96) Studying 0 (0) 0 (1) 0 (0) 0 (0) 14 (24) 17 (19) 2 (4) 18 (22) Miscellaneous 18 (19) 38 (29) 41 (38) 101 (86) 32 (28) 79 (83) 41 (40) 48 (47) unknown 164 (112) 140 (130) 190 (196) 176 (148) 83 (62) 115 (77) 100 (88) 64 (57)
Total 960 960 960 960 960 960 960 960
* Statistically significant difference by Mann-Whitney U test (P<0.05)
**Applied agro-sanitation asset had toilet room and shower room separately, and urinary bowl was set in shower room. Therefore, observer estimated the target person’s activity in shower room as “shower” if observer heard the sounds of taking shower and the person came out with wet hair, and as “urination” if the person came out quickly with dried hair. There also are possibility to urinate in toilet room, however we could not distinguish it, therefore we classified all activities in toilet room just as “toilet.”
Table 3. Averaged time allocation of pilot and control families in rainy season. Unit is minutes / day, and standard deviation in parenthesis.
families, most involved processing materials for sale and selling in the the market, activities that are classified in the “business” sub-group. A potion of these activities might be related to the agro-sanitation business in the successful pilot family (KPLE), as will be discussed later; however, these activities included the normal activities associated with the family’s usual business, such as brewing and selling local beer.
Thus, with respect to the agro-sanitation business, we did not observe any significant additional workload measured in time allocation, with the exception of some “economic” activities that might possibly be associated with the agro-sanitation business. Activities directly related to the management of the agro-sanitation asset, such as toilet cleaning, shower room cleaning, and watering the agro-sanitation garden were qualitatively observed in the Work-females’ activities during some of the intervals between the pre-determined observation points;
however, these activities tended to be too short to be included in the time allocation data collected at the specified 30-minute intervals.
These results would seem to support hypothesis 3, which states that the additional workload required for the agro-sanitation business would be acceptably small. Indeed, the daily maintenance and vegetable cultivation times associated with the agro-sanitation asset seem quite small relative to the other activities observed in the study.
As for the workload associated with processing materials for sale and selling in the market, a portion of the time involved might be connected to the agro-sanitation business, which should be taken into account when application and diffusion strategies are discussed.
2.2. Time allocation in the successful family
As described above, we observed several significant differences in time allocation between the pilot and control families. However, most of these differences seem not to be directly related to the use of the agro-sanitation asset but rather are a feature of the normal activities of the families. Therefore, it seems reasonable to describe the features of each family before identifying the distinctive time allocation features of the successful (KPLE) family.
Figures 4 to 7 show the average dry-season time allocation of the Work-females, School-females, Work- males and School-males in each family. The overall tendencies of the time allocation of Work-females in the dry season (Figure 4) are very similar except for the “economic” activities and “personal” activities in two cases—the successful pilot family (KPLE) and one of the control families (KCTN). These two cases show a large “economic”
activity component, while in the other families, the time allocated to these activities is quite small or zero. On the other hand, these two cases show a smaller portion of “personal” activity time than any of the other cases.
The time allocation of Work-males in the dry season varies greatly by family. Among the pilot families, Work- males in the successful pilot family (KPLE) show a comparatively large portion of “economic” activity, but the difference is not as clear as in the case of Work-females. The overall tendencies of time allocation for School- females and School-males in the dry season are similar.
Figures 8 to 11 show the average time allocation of Work-females, School-females, Work-males and School- males in each of the families during the rainy season. Although time allocation varies by family in all groups, one common tendency appears to be that the “subsistence” activities of women (both Work-females and School- females) in village B are shorter than in village K. Work-males in village B also show comparatively shorter
“subsistence” activity times than those in village K; however, the difference is not so clear as in the case of Work- females and School-females. One obvious feature of the successful pilot family (KPLE) during the rainy season is that their “subsistence” activity time is longest among all the groups, whereas the time allocated for “economic”
activity is very small relative to other cases where “economic” activity was observed.
Sanitation Value Chain Vol. 3 (01) pp. 025-039, 2019 34
Fig.4 Time allocation of work-female in dry season by averaged per each family.
0% 20% 40% 60% 80% 100%
BCTN(N=4) BCTE(N=6) KCTN(N=1) KCTE(N=4) BPLN(N=1) BPLE(N=6) KPLN(N=1) KPLE(N=4)
Subsistence
Housekeeping economicsocial&educationpersonalMiscellaneous unknown
Fig.5 Time allocation of school-female in dry season by averaged per each family.
0% 20% 40% 60% 80% 100%
BCTN(N=2) BCTE(N=2) KCTN(N=1) KCTE(N=4) BPLN(N=2) BPLE(N=3) KPLN(N=2) KPLE(N=6)
SubsistenceHousekeeping economic
personal social&education
Miscellaneous unknown
Fig.6 Time allocation of work-male in dry season by averaged per each family.
Fig.7 Time allocation of school-male in dry season by averaged per each family.
0% 20% 40% 60% 80% 100%
BCTN(N=2) BCTE(N=5) KCTN(N=1) KCTE(N=1) BPLN(N=2) BPLE(N=6) KPLN(N=1) KPLE(N=4)
SubsistenceHousekeeping
economic personal
social&education Miscellaneous
unknown
0% 20% 40% 60% 80% 100%
BCTN(N=1) BCTE(N=6) KCTN(N=3) KCTE(N=9) BPLN(N=2) BPLE(N=6) KPLN(N=0) KPLE(N=2)
SubsistenceHousekeeping economic
personal social&education
Miscellaneous unknown
Fig.8 Time allocation of work-female in rainy season by averaged per each family.
Fig.9 Time allocation of school-female in rainy season by averaged per each family.
Fig.10 Time allocation of work-male in rainy season by averaged per each family.
Fig.11 Time allocation of school-male in rainy season by averaged per each family.
0% 20% 40% 60% 80% 100%
BCTN(N=5) BCTE(N=7) KCTN(N=1) KCTE(N=4) BPLN(N=1) BPLE(N=7) KPLN(N=1)
KPLE(N=4) SubsistenceHousekeeping personaleconomicsocial&education Miscellaneous
unknown
0% 20% 40% 60% 80% 100%
BCTN(N=2) BCTE(N=4) KCTN(N=1) KCTE(N=4) BPLN(N=2) BPLE(N=4) KPLN(N=2)
KPLE(N=6) Subsistence Housekeepingeconomic personal
social&educationMiscellaneous unknown
0% 20% 40% 60% 80% 100%
BCTN(N=3) BCTE(N=7) KCTN(N=1) KCTE(N=1) BPLN(N=2) BPLE(N=7) KPLN(N=1)
KPLE(N=4) SubsistenceHousekeeping
economic personalsocial&education Miscellaneous
unknown
0% 20% 40% 60% 80% 100%
BCTN(N=1) BCTE(N=7) KCTN(N=3) KCTE(N=9) BPLN(N=2) BPLE(N=6) KPLN(N=1)
KPLE(N=2) SubsistenceHousekeepingeconomic
personal
social&educationMiscellaneous unknown
Fig.4 Time allocation of work-female in dry season by averaged per each family.
0% 20% 40% 60% 80% 100%
BCTN(N=4) BCTE(N=6) KCTN(N=1) KCTE(N=4) BPLN(N=1) BPLE(N=6) KPLN(N=1) KPLE(N=4)
Subsistence
Housekeeping economicsocial&educationpersonalMiscellaneous unknown
Fig.5 Time allocation of school-female in dry season by averaged per each family.
0% 20% 40% 60% 80% 100%
BCTN(N=2) BCTE(N=2) KCTN(N=1) KCTE(N=4) BPLN(N=2) BPLE(N=3) KPLN(N=2) KPLE(N=6)
SubsistenceHousekeeping economic
personal social&education
Miscellaneous unknown
Fig.6 Time allocation of work-male in dry season by averaged per each family.
Fig.7 Time allocation of school-male in dry season by averaged per each family.
0% 20% 40% 60% 80% 100%
BCTN(N=2) BCTE(N=5) KCTN(N=1) KCTE(N=1) BPLN(N=2) BPLE(N=6) KPLN(N=1) KPLE(N=4)
SubsistenceHousekeeping
economic personal
social&education Miscellaneous
unknown
0% 20% 40% 60% 80% 100%
BCTN(N=1) BCTE(N=6) KCTN(N=3) KCTE(N=9) BPLN(N=2) BPLE(N=6) KPLN(N=0) KPLE(N=2)
SubsistenceHousekeeping economic
personal social&education
Miscellaneous unknown
Fig.4 Time allocation of work-female in dry season by averaged per each family.
0% 20% 40% 60% 80% 100%
BCTN(N=4) BCTE(N=6) KCTN(N=1) KCTE(N=4) BPLN(N=1) BPLE(N=6) KPLN(N=1)
Fig.5 Time allocation of school-female in dry season by averaged per each family.
0% 20% 40% 60% 80% 100%
BCTN(N=2) BCTE(N=2) KCTN(N=1) KCTE(N=4) BPLN(N=2) BPLE(N=3) KPLN(N=2) KPLE(N=6)
SubsistenceHousekeeping economic
personal social&education
Miscellaneous unknown
Fig.6 Time allocation of work-male in dry season by averaged per each family.
Fig.7 Time allocation of school-male in dry season by averaged per each family.
0% 20% 40% 60% 80% 100%
BCTN(N=2) BCTE(N=5) KCTN(N=1) KCTE(N=1) BPLN(N=2) BPLE(N=6) KPLN(N=1) KPLE(N=4)
SubsistenceHousekeeping
economic personal
social&education Miscellaneous
unknown
0% 20% 40% 60% 80% 100%
BCTN(N=1) BCTE(N=6) KCTN(N=3) KCTE(N=9) BPLN(N=2) BPLE(N=6) KPLN(N=0) KPLE(N=2)
SubsistenceHousekeeping economic
personal social&education
Miscellaneous unknown
Fig.8 Time allocation of work-female in rainy season by averaged per each family.
Fig.9 Time allocation of school-female in rainy season by averaged per each family.
Fig.10 Time allocation of work-male in rainy season by averaged per each family.
Fig.11 Time allocation of school-male in rainy season by averaged per each family.
0% 20% 40% 60% 80% 100%
BCTN(N=5) BCTE(N=7) KCTN(N=1) KCTE(N=4) BPLN(N=1) BPLE(N=7) KPLN(N=1)
KPLE(N=4) SubsistenceHousekeeping personaleconomicsocial&education Miscellaneous
unknown
0% 20% 40% 60% 80% 100%
BCTN(N=2) BCTE(N=4) KCTN(N=1) KCTE(N=4) BPLN(N=2) BPLE(N=4) KPLN(N=2)
KPLE(N=6) Subsistence Housekeepingeconomic personal
social&educationMiscellaneous unknown
0% 20% 40% 60% 80% 100%
BCTN(N=3) BCTE(N=7) KCTN(N=1) KCTE(N=1) BPLN(N=2) BPLE(N=7) KPLN(N=1)
KPLE(N=4) SubsistenceHousekeeping
economic personalsocial&education Miscellaneous
unknown
0% 20% 40% 60% 80% 100%
BCTN(N=1) BCTE(N=7) KCTN(N=3) KCTE(N=9) BPLN(N=2) BPLE(N=6) KPLN(N=1)
KPLE(N=2) SubsistenceHousekeepingeconomic
personal
social&educationMiscellaneousunknown
Figure 4. Time allocation of work-female in dry season by averaged per each family.
Figure 6. Time allocation of work-male in dry season by averaged per each family.
Figure 8. Time allocation of work-female in rainy season by averaged per each family.
Figure 10. Time allocation of work-male in rainy season by averaged per each family.
Figure 5. Time allocation of school-female in dry season by averaged per each family.
Figure 7. Time allocation of school-male in dry season by averaged per each family.
Figure 9. Time allocation of school-female in rainy season by averaged per each family.
Figure 11. Time allocation of school-male in rainy season by averaged per each family.
2.3. Details of the “economic” activity by Work-females in the successful pilot family
As noted, the most distinctive features of time allocation in the successful pilot family (KPLE) were observed among the females, especially the Work-females. Therefore, in this section, we focus on the Work-females in the successful pilot family (KPLE) and attempt to identify factors that may be related to their acceptance of the agro- sanitation business concept.
First, in comparison to the other pilot families, a rather substantial amount of time was allocated to “economic”
activities by the Work-females in the successful family (KPLE) during the dry season. The “economic” activities of these Work-females through both the dry and rainy seasons consisted of brewing traditional beer (20.5%), selling traditional beer (27.0%), packaging vegetables for sale (11.5%), and selling the family products in the market (41.0%). The first two of these activities, totaling 47.5% of the identified “economic” activities, are not associated with the agro-sanitation business; the remaining two activities (52.5% of the “economic” activities) are possibly connected to the agro-sanitation business.
As for the control families, considerable time was allocated for “economic” activities by the Work-females in the KCTN family. In fact, the average time allocation per day was similar to that in the successful pilot family (KPLE), though its composition was a bit different: selling vegetables (19.1%), cooking commercial food (25.0%), and selling commercial food (55.9%). In Burkina Faso, women have traditionally earned cash income by selling various products or food at market, although the way of selling and the specific products tend to vary by ethnic group and household (Saul 1981; Kavane and Wydick 2001; Sida 2004; Oladeji et al. 2006). In terms of ethnicity, the two families described above (KPLE and KCTN) were both in village K, which is inhabited by the Mossi.
However, we also observed milk processing and sales activity in village B (during the rainy season, 5.5 continuous hours by one Work-female in the BPLN family), although this involved a rather short time allocation compared to other activities.
Thus, the observed “economic” activities by women that could possibly represent an additional workload associated with agro-sanitation overlap customary practices, which themselves vary by household (as seen in both the pilot and control families). Consequently, the longer observed time allocation for “economic” activities on the part of the Work-females in the successful pilot family (KPLE) might simply be attributable to distinctive characteristics of the family. In other words, basic family characteristics—primarily a familiarity with spending time selling items in the market—may have made it easier for the KPLE family to accept the agro-sanitation business concept. If so, families similar to the KCTN family in this regard would seem to make a promising target for the successful application of the model.
2.4. Time management of the Work-females in the successful pilot family
In seeking to more fully understand the time allocation of Work-females in the successful household, the question arises: “How do these women manage to have the time for ‘economic’ activities?” One possible explanation is that the women in the successful family spend less time on “personal” activities compared to those in the other families, as can be seen in Figure 4. However, during the rainy season, when their “economic” activity time is short, their “personal” activity time is also shortest among the eight targeted families. It seems, then, that their time spent on “personal” activities is normally quite short.
Generally speaking, one of the most time-consuming tasks of women in Burkina Faso is housekeeping. Our time allocation data tend to support this. In order to estimate the total “housekeeping” workload in each of the families in the study, the time allocated for “housekeeping” by the various family members was combined. The results vary widely by season: 5.8 to 51.7 hours/day in the rainy season and 6.2 to 39.9 hours/day in the dry season. There is less variation if the aggregate values are divided by the number of household members: 0.7 to
2.3 hours/day in the rainy season and 1.0 to 2.2 hours/day in the dry season (Figure 12). Seasonal differences in these values in each family are small, except in the case of the successful family (KPLE). Housekeeping per capita in the KPLE family during the dry season is in the middle among the eight targeted families; however, during the rainy season, it is smallest among the families.
Another major task for women in Burkina Faso involves “subsistence” activities. Total time allocation for
“subsistence” in the surveyed families varies widely: 15.3 to 161.6 hours/day in the rainy season and 0.8 to 32.3 hours/day in the dry season. As these activities relate mainly to crop cultivation in the rainy season, seasonal differences in time allocation are large in all households. As noted, the time allocation for “subsistence” activities in the successful family (KPLE) is longest among the eight targeted families.
The data thus suggest that Work-females in the successful family (KPLE) work hard at “subsistence” during the rainy season and then shift to “housekeeping” and “economic” activities during the dry season, while Work- females in the other pilot families shift from “subsistence” activities mainly to “personal” activities. In terms of our qualitative observations, women in the successful family (KPLE) appeared very busy and did everything very quickly. This is likely why they are able to perform their housekeeping duties in a short time during the rainy season. Furthermore, this efficiency may contribute to their ability to find the time for “economic” activities during the dry season. A similar seasonal shift in time allocation was observed in one of the control families (KCTN).
2.5. Application strategy of agro-sanitation business model
Results of the time allocation survey support hypotheses 1 and 2, although it is difficult to validate these hypotheses directly due to the limitations of the research design. Regarding hypothesis 3, the activity of processing products for sale and selling in the market was shown to invole considerable time in the successful family; however, this was not easily distinguishable from the customary practice of the family.
For the effective application and diffusion of the agro-sanitation business concept, creating successful local cases and thereafter diffusing the idea through the community network are important (Rogers 1983). Thus, it is important to create one or more successful cases as a starting point. This means that choosing the pilot families is crucial. Kavane and Wydick (2001) mention the effect of social norms on the time allocated to economic activities by women in Burkina Faso. Other studies also mention that these activities vary according to the family situation,
BCTN BCTE KCTN KCTE BPLN BPLE KPLN KPLE
total “housekeeping” / household size (hour/day/capita)
0.0 0.5 1.0 1.5 2.0 2.5
Rainy season Dry season
Figure 12. Total time allocation for “housekeeping” per capita in each family.
including such factors as the financial resources and mindset of the household head (e.g., Saul 1981). In fact, the results of this study also show some variety in the time allocation among families. Therefore, one of the promising strategies for promoting adoption of the model would be to choose families with features similar to the families in previously successful cases. According to our results, this means, for example, choosing families in which the women have experience selling in the marketplace. Furthermore, busy women seem to be more promising than women who have excess “spare” time.
In summary, we propose the following strategy to promote the adoption of the agro-sanitation model: (1) The business model should be designed to maximize its acceptability to women; (2) In the early stages of diffusion, busy women who are acccustomed to selling products such as food and traditional beer in the market should be targeted as potential adopters of the model. When success is achieved, word of these succsessful cases should be widely disseminated to other women in the village; and (3) an appropriate cultivation schedule for commercially valuable vegetables should be devised—one that requires a minimum additional workload in the rainy season and harvesting in the dry season.
Conclusion
Although there are some limitations to the study design, results of the time allocation survey generally support our hypotheses. We found that
• The additional workload associated with adopting the agro-sanitation business model seems small compared to other work.
• Among the activities related to the agro-sanitation business, processing products for sale and selling in the market require a considerable time allocation, although these activities and activity times were not easily distinguishable from customary practice.
• Differences in time allocation were mainly observed in Work-females.
• Noteworthy features of the Work-females in the successful pilot family included a substantial time allocation for “economic” activities in the dry season and for “subsistence” activities in the rainy season, and a relatively short time allocation for “housekeeping” in the rainy season and for “personal” activities throughout the year.
• Having women in the family who are familiar with selling their products in the market and who manage their time efficiently appears to be an important factor for successful adoption of the model.
Based on these findings, strategy for diffusing the agro-sanitation business model should focus on women as the key players. Priority should be given to identifying women who have characteristics similar to the women in the successful family described in this study and to devising a cultivation schedule that considers their seasonal time allocation.
Acknowledgements
This research was supported by “Improving Sustainable Water and Sanitation Systems in the Sahel Region of Africa: The Case of Burkina Faso” the JST/JICA SATREPS project and “The Sanitation Value Chain: Designing Sanitation Systems as Eco-Community Value System” Project (Project Leader: Prof. Taro Yamauchi), Research Institute for Humanity and Nature (RIHN, Project No.14200107).