Year 2020 Doctor Thesis
Research on wearable measurement system for physical performance and biomedical
information
Supervisor Prof. Koichi Sagawa
2019 December
Contents
1 Preface 1
2 Development of Wireless Inertial Measurement Unit (WIMU) 8
2.1 Introduction . . . . 8
2.2 Overview of WIMU . . . . 9
2.3 Hardware and software structure . . . . 11
2.4 WIMU for surface mounting . . . . 16
2.5 Interpolation of value exceeding measurement ranges . . . . 23
3 Principle of gait analysis 25 3.1 Construction of integration section . . . . 25
3.1.1 Distinction between stance phase and swing phase . . . . 25
3.1.2 Integration section determination . . . . 26
3.2 Theory of measuring bipedal walking motion of human . . . . 33
3.2.1 Acceleration derivation on fixed coordinate system . . . . 33
3.2.2 Calculation of OM during stance phase . . . . 34
3.2.3 Foot movement estimation . . . . 36
3.2.4 Gait parameters . . . . 38
4.4 Results . . . . 53
4.4.1 Compensation of gait distance with actual value . . . . 53
4.4.2 Classification of subjects by running incidence . . . . 54
4.4.3 Correlation between MMSE with gait parameter . . . . 54
4.5 Discussion . . . . 61
4.6 Conclusion . . . . 62
5 Simultaneous measurement of 3D foot trajectory and center of gravity 63 5.1 Introduction . . . . 63
5.2 Principle . . . . 64
5.2.1 Type of force sensors . . . . 64
5.2.2 Gait measurement system . . . . 65
5.2.3 Gait trajectory . . . . 66
5.3 Experiment . . . . 71
5.3.1 Equipment . . . . 71
5.3.2 Method . . . . 71
5.4 Results . . . . 71
5.5 Discussion . . . . 84
5.6 Conclusion . . . . 84
6 Continuous blood pressure estimation during exercise using pulse pho- toplethysmographic signal 85 6.1 Introduction . . . . 85
6.2 Principle . . . . 86
6.3 Method . . . . 90
6.3.1 Subjects . . . . 90
6.3.2 Equipments . . . . 90
6.5 Discussion . . . 108 6.6 Conclusions . . . 110
7 Conclusion 111
References 113
Acknowledgments 122
Chapter 1 Preface
Research on wearable measurement system for physical performance and biomedical information has been conducted for the purposes of understanding the basic and advance characteristics of human body. For the past decade, there has been a remarkable de- velopment of wearable systems, enabling sensors and mobile devices with unprecedented characteristics utilized in wide area. Their high computational power, small size, low cost, and robustness allow people to interact with the devices as part of their daily living. Par- ticularly, the measurement of human activities has become a task of high interest within the field, especially for medical purpose. For instance, patients with diabetes, obesity, or heart disease are often required to follow a well defined exercise routine as part of their treatments [1] . Therefore, measuring activities such as walking, running, or cycling become useful for exercise level assessment and provide feedback to the exerciser or care- giver. Likewise, patients with dementia and other mental pathologies could be monitored to detect abnormal activities and thereby prevent undesirable consequences [2] .
However, there are still many issues that motivate the development of new techniques
to improve the accuracy under more realistic conditions. Some of these challenges are the
selection of the attributes to be measured, the development of a portable, unobtrusive,
and inexpensive data acquisition system, the design of feature extraction and estimation
area of activity.
Cameras have been employed for motion measurement and human activity recognition (HAR). In fact, the recognition of activities and gestures from video sequences has been the focus of extensive research [3–6] . However, video sequences certainly have some problems in motion monitoring. The monitored individuals need to stay within an area defined by the position and the capabilities of the cameras. Another problem is video processing is complex and needs professional techniques.
The aforementioned limitations motivate the use of wearable sensors in HAR. Most of the measured attributes are related to the user’s movement (e.g. using accelerometer or gyroscope), environmental variables (e.g. temperature), or physiological signals (e.g.
heart rate or blood pressure). These data are naturally indexed over the time dimen- sion, allowing researches to define the human healthiness and fitness. Researches have been conducted on body-worn measurement devices using sensors such as accelerometer, gyroscope, geomagnetic sensor, force sensor, and pulse sensor.
When acceleration acts on the mass held by elastic element and viscous damping el-
ement, an IC type accelerometer can measure the acceleration acting on an object by
capturing the displacement due to the inertial force of the mass as a change in the
amount of material strain or capacitance. Gyroscope can measure Coriolis force when
reciprocating vibrating element rotates. Motion measurement using these sensors has
the advantages of simplicity, low cost, and low restraint compared to the optical devices
described above. So, it is expected to play roles not only in the sports field but also
in the welfare and physical therapy fields. To date, methods for estimating joint an-
gles during human movement [7] , methods for discriminating behavior and activity [8] , and
methods for measuring gait velocity during gait [9] have been reported. In addition, due
to recent developments in MEMS technology, miniaturization, light weight, and high pre-
and angular velocity. Algorithm is also developed for measuring temporal gait parameter at each cycle.
Spatial and temporal plantar pressure distributions are important and useful measures in footwear evaluation, athletic training, clinical gait analysis, and pathology foot diag- nosis. However, present plantar pressure measurement and analysis systems are bulky, uncomfortable to wear and expensive. Study has been conducted on in-shoe plantar pres- sure measurement and analysis system based on a textile fabric sensor array [11] . The sensors are connected with a soft polymeric board through conductive yarns and inte- grated into an insole. A real-time display and analysis software are presented to calculate parameters such as mean force, peak force, center of foot force (COF), and shift speed of COF. However, acquiring force reading and COF has become common and commer- cialized. Therefore, by using force sensor as extension to the current inertial sensor unit, the information acquired during gait is broaden because other than motion capture sys- tem (MCS), there is almost no device that offer force plate information and 3D motion information at the same time has been developed.
Methods for continuously monitoring blood pressure from other physiological parame-
ters have been widely studied. Most of these studies correlate blood pressure (BP) with
pulse transit time (PTT), based on the relationship between BP and pulse wave velocity
(PWV) [12] . BP is often estimated by means of linear models in which the variables are
the extracted parameters from ECG and pulse photoplethysmography signal (PPG), rep-
resenting the response of the cardiovascular system. Awad et al. [13] have suggested that
pulse width is more sensitive to changes in Systemic Vascular Resistance (SVR) than
other indices of pulse wave. The SVR is determined by changes in artery diameter or
changes in blood viscosity. Changes in pulse width provide valuable evidence with re-
spect to changes in PWV too. However, for the purpose of recreation and daily use, using
sophisticated devices to measure multiple parameters is not practicable. Utilization of a
The conventional measurement system is wired and has an adverse effect on motion measurement
In order to measure human movements using inertial sensors, it is necessary to wear a several number of sensors on multiple parts of the body and record the measurement data. To record this in one data logger, multiple signal cables are required which may hinder operation.
Real-time data transmission using wireless communication technology is dif- ficult
In order to solve the problem that wired measurement adversely affects operation, wireless transmission of measurement data can be considered. However, at high sampling frequencies, the amount of data measured per unit time is large, and when the number of measurement points increases, it is difficult to transmit data in real time even using current wireless communication technology.
Ingenuity is required for high-precision measurement of high-speed sports movements
Fastest gait measuring results in acceleration and angular velocity occur in a wide range. Therefore, it is necessary to measure at a high sampling frequency using an inertial sensor with a wide measurement range. On the other hand, an inertial sensor with a wide measuring range has a small SN ratio and is easily affected by electrical noise.
Highly accurate path estimation is difficult due to integration error
In order to estimate the posture and movement path during exercise using an inertial
sensor, numerical integration of acceleration and angular velocity is required. However,
First, WIMU that has high sampling rate, wide measuring range, and large data record- ing capacity is developed in order to support high-speed operation. With the increase in capacity and decrease in price of storage devices such as microSD cards, a method of storing data in a wearable sensor system without transmitting large-capacity measure- ment data in real time is considered practical. Control such as measurement start and end of the sensors attached to the body is performed wirelessly. In addition, by using a protocol that allows one-to-many wireless communication, high communication speed is not required and the number of usable sensors become unlimited. By using this wireless sensor system, high-speed, and unconstrained motion measurement becomes possible. Af- ter evaluating the hardware and software using a prototype, a sensor system is developed using a surface-mount substrate and the applicability of gait motion measurement is in- vestigated.
There are also some tasks on measuring parameter of the foot plantar.
Platform system is lack in accessibilty
Platform system such as force plate are usually embedded in a walkway. However, this kind of system is restricted to use in a laboratory or hospital, and used for barefoot measurements.
Force sensors were rigid and have limited flexibility
Most developed sensors have a common problem which is the inadaptability towards human body curvature during application of sensors. Due to rigid sensor, users are unable to walk as natural as they can because the sensor rigidity affects the comfort of the user.
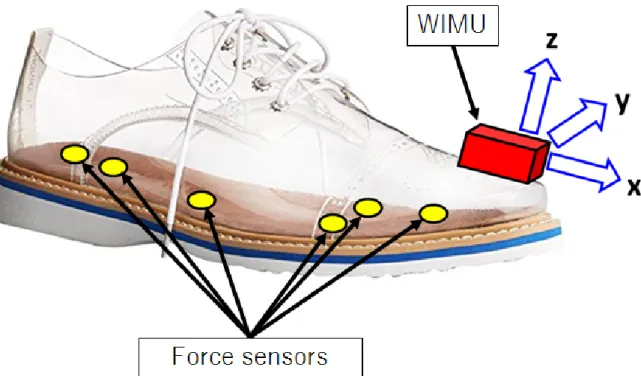
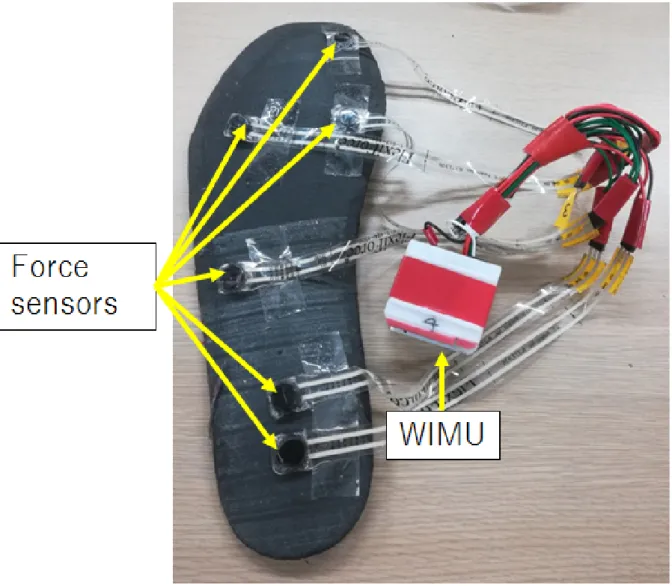
With the purpose of collecting valid long-period data in all kinds of terrains, the plantar
Multiple use of force sensor for gait mapping is considered better than using mat type sensor. The sensors is embedded in an insole. WIMU is used together with the force sensors to measure gait during swing phase and stance phase. The gait trajectory and COF is calculated and expressed in 3D figure.
The usage of sensor also makes the estimation of blood pressure possible without using cuff. However, to replace measurement using cuff-based methods which provides adequate data in medical field, there are problems with cuffless estimation method.
Technique involves measuring the transit time of the pulse pressure wave through the arterial tree
Measurement of PTT involves detecting the pulse arrival at two separate arterial sites.
This can be achieved by using infrared PPG, and differential PTT. The ECG R-wave is often used as a proximal timing point because it is simple to detect and tolerant of motion artifact. However, using ECG itself is expensive, cumbersome, and not wearable to be used during exercise.
Many technical innovations have been developed for cuffless-based BP monitoring such as smart phone applications and wearable device. However, no system has been developed to enable BP estimation and continuous monitoring by a single sensor during exercise that has comparable fidelity to the cuff-based method. In this thesis, system for recording BP without cuff for measurement during exercise or hard work is developed. A novel system for estimation of systolic BP that requires only one sensor for capturing PPG signal is proposed.
The chapters in this thesis are as follows.
Chapter 3 Principle of gait analysis
This chapter describes the method of calculating gait parameter from inertial data taken from WIMU. Integration section is constructed to derive 3D trajectory of the toe at minimal error. Calculation of gait parameters is described and detection of running is made possible by using two sensors.
Chapter 4 Inertial gait analysis measurement system for large-scale health checkups
This chapter describes utilization of the developed WIMU in gait analysis for large-scale health checkups. The inertial measurement system is used to estimate gait parameter to find an indicator to evaluate cognitive impairment.
Chapter 5 Simultaneous measurement of 3D foot trajectory and center of gravity
This chapter describes the development of sensor system which can measure gait pa- rameters during swing phase and stance phase. Force sensor is used as an extension to the WIMU and embedded into shoe. WIMU measures gait parameter during swing phase and pressure sensor measures gait parameter during stance phase.
Chapter 6 Continuous blood pressure estimation during exercise using pulse photoplethysmographic signal
This chapter describes a cuff-less method to estimate BP during exercise. Pulse sensor
is used to obtain PPG which has high relationship with changes in BP. Linear function is
created to estimate systolic BP that matches best for each subject. The WIMU is used
as a data logger as well as the measurement unit.
Chapter 2
Development of Wireless Inertial Measurement Unit (WIMU)
2.1 Introduction
MCS is used widely for measuring motion such as sports movement and filmmaking.
Motion capture is the process of recording movement of objects mostly when reflective markers are attached. In order to record movement using MCS, firstly, several infrared cameras are required around the measuring area. Next, reflective markers need to be attached on the targeted object or on specific positions using adhesive tape. Each camera will then record the movement of reflective marker in 2 dimensional coordinate, combining record data from all cameras gives coordinate of the marker in 3 dimensional space.
Motion capture offers several advantages such as low latency, recorded marker’s position is less than 1 [mm] in error, and results obtained is close to real time.
However, MCS are very costly and some fundamental knowledge is needed to operate
one. Since the system uses infrared light to capture the reflective marker, it is almost im-
possible to record motion outdoors especially during the day. Moreover, the marker must
always be visible to the cameras for tracking. This limited the measurable movement and
caused by integration errors due to circuit noise and sensor drift, and it is difficult to estimate the path with high accuracy.
This chapter propose improvement on the older version of the WIMU developed to measure normal gait for better experience in motion measuring. The author determined its specification and evaluated the functionality of the system in both hardware and software to measure fast motion. After the function of the sensor system is tested, the author designed and made it to be compact and sturdy to implement body surface mounting of the sensor.
2.2 Overview of WIMU
During fast motion, large acceleration and angular velocity occur, and to measure these, sensor with wide measuring range is necessary. In addition to sensor which has small measuring range, the author introduced sensor which has wide measuring range.
Two types of inertial sensors with different measuring ranges are used for acceleration
sensor and gyro sensor. Sensor with small measuring range is called ‘high sensitivity sen-
sor’ and sensor with large measuring range is called ‘low sensitivity sensor’. The outline
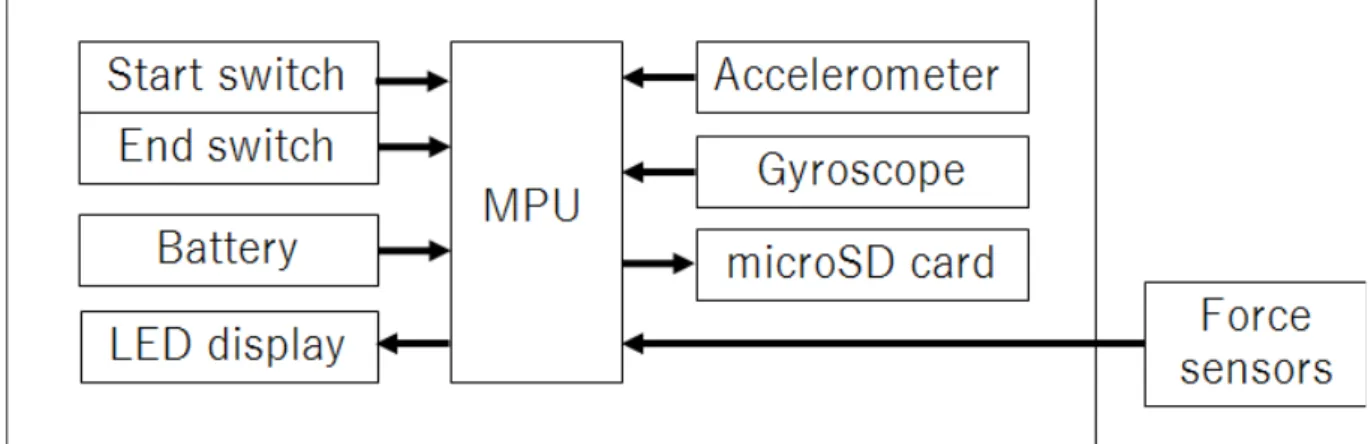
of the whole sensor unit is as shown in Fig. 2.1. These sensors are programmed to measure
at sampling rate of 100 [Hz]. WIMU is made of two circuit boards superimposing each
other. One of the circuit board consists of high sensitivity acceleration sensor, high sensi-
tivity gyro sensor, geomagnetic sensor, microprocessor unit (MPU, dsPIC33FJ128GP802,
Microchip Technology Inc.), wireless communication module (XBee, MaxStream, Digi
International Inc.), and microSD card slot. Another one consists of low sensitivity accel-
eration sensor and low sensitivity gyro sensor. Both circuit boards are connected vertical
to a board which consists of controller switches, LEDs for information display, USB slot
with charging function, and connected to lithium ion battery. Depending on the contents
Fig. 2.1: Block diagram of inertial measurement system.
2.3 Hardware and software structure
The MPU used on this sensor system has 10 pins which can be used as AD converter.
Power-supply voltage of the MPU is 3.3 [V]. To cope with various and changing speed of
movement, the author uses two types of sensors with different ranges of measurement. The
high sensitivity sensor is necessary to record minute motion precisely and low sensitivity
sensor is used for recording extremely fast motion which cannot be measured by high
sensitivity sensor. Fig. 2.2 and Fig. 2.3 shows the structure of circuit board with high
sensitivity sensors, Fig. 2.4 and Fig. 2.5 shows the structure of circuit board with low
sensitivity sensors, Fig. 2.6 and Fig. 2.7 shows the switch board, and Table 2.1 shows the
list of components. The author uses 3 axes high sensitivity acceleration sensor and 3 axes
gyro sensor (MPU-6050, InvenSense Inc.) in which the measuring range of the acceleration
sensor is
±16 [G] and measuring range of the gyro sensor is
±2000 [deg/s]. The author
uses 3 axes low sensitivity acceleration sensor (ADXL375, Analog Devices Inc.) with
measuring range of
±200 [G] and two 2 axes low sensitivity gyro sensors (LPY4150AL,
STMicroelectronics) with measuring range of
±6000 [deg/s]. The two low sensitivity
gyro sensors were arranged to make 3 axes which make right angle to each other. Apart
of these sensors, a 3 axes geomagnetic sensor (HMC5883L, Honeywell) is also used in the
sensor system. All of the sensors work on 3.3 [V] power supply. Eventually there are 15
channels for data recording with 2 byte precision and each one is recorded at sampling
rate of 100 [Hz] which means the volume of data recorded per second is 3000 bytes. These
data are sent and saved directly into microSD card. The author uses MaxStream’s XBee
S1/S2 for radio frequency RF module. Wireless communication is used when controlling
the sensor unit from a remote controller and when checking connection and functionality
of the sensor from computer. Lithium ion polymer battery (110 [mAh], 3.7 [V]) is used
to power up the sensor unit.
Fig. 2.2: Front of the high sensitivity sensor board
Fig. 2.4: Front of the low sensitivity sensor board
Fig. 2.6: Front of the switch board
Table 2.1: List of components
Component name Pattern number Manufacturer Specification MPU dsPIC33FJ128GP802 Microchip Technology 28 pin
RF module XBee MaxStream S1, S2
Acceleration sensor MPU-6050 InvenSense Inc. 16 [g]
Gyro sensor 2000 [dps]
Acceleration sensor ADXL375 Analog Devices Inc. 200 [g]
Gyro sensor LPY4150AL STMicroelectronics 6000 [dps]
Geomagnetic sensor HMC5883L Honeywell 8 [Gauss]
2.4 WIMU for surface mounting
After the operation of WIMU in term of hardware and software is checked using discrete electronic components on the breadboard, the author confirmed that the WIMU works just as specified. Circuit boards for surface mounting are made to achieve small and light sensor unit. The sensor components are arranged compactly to fit into two small circuit boards. Circuit diagrams of high sensitivity sensor and low sensitivity sensor are shown in Fig. 2.8 and Fig. 2.9. Circuit diagram of the switch board is shown in Fig. 2.10.
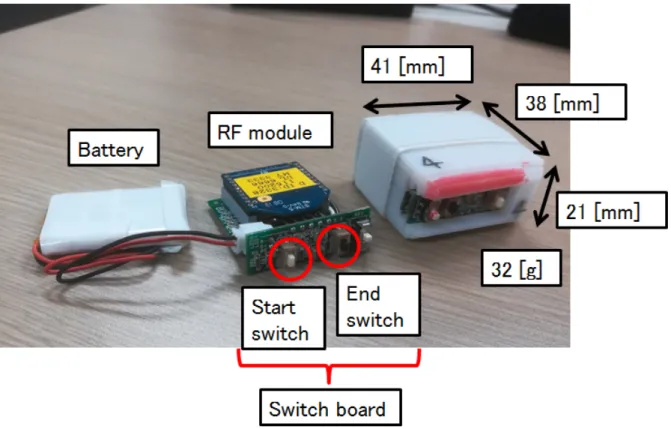
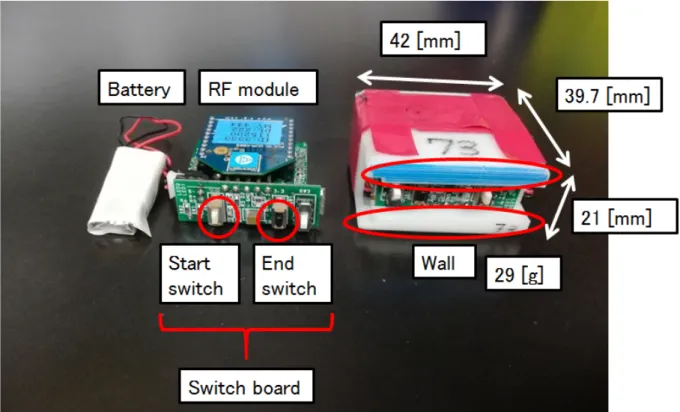
These circuit boards, together with a switch board, RF module and a battery are fitted into a case to mount the WIMU on human body. Previous sensor model (Fig. 2.11) only consists of high sensitivity sensor and was powered up by lithium ion polymer battery (GSP652535, 400 [mAh], 3.7 [V], 1.48 [Wh], 36 × 23 × 5 [mm]) which can last for about 2 hours when used continuously. However, to make space for the low sensitivity sensor and the sensor unit as small as possible, the author used smaller lithium ion polymer battery (GSP061225, 110 [mAh], 3.7 [V], 0.407 [Wh], 29 × 11 × 5 [mm]) which is smaller in size and battery capacity than the previous model. Even though this battery can only last around 30 minutes when used continuously with the new sensor unit, the author decided that 30 minutes would be enough at the large scale health checkups and never used a sensor more than 15 minutes for one subject. This battery can be charged using micro USB power cable when connected to switch board.
The case of the sensor unit is designed using AutoCAD and printed out with 3D printer using ABS resin as material. The whole case is made of 2 parts, the casing and the cover.
The dimension of the casing is 42 × 39.7 × 19 [mm] and the dimension of the cover is
42 × 39.7 × 5.5 [mm]. When the casing is closed with the cover, the overall dimension of
the case is 42 × 39.7 × 21 [mm]. Figure. 2.12 shows the sensor components, dimension, and
Fig. 2.11: Previous sensor model has battery life that can last up to 2 hours but only
consists of high sensitivity sensor.
Fig. 2.12: New sensor model has short battery life about 30 minutes but consists of high
and low sensitivity sensors. Wall is made around the switch board to prevent the switch
from being pushed accidentally during measurement.
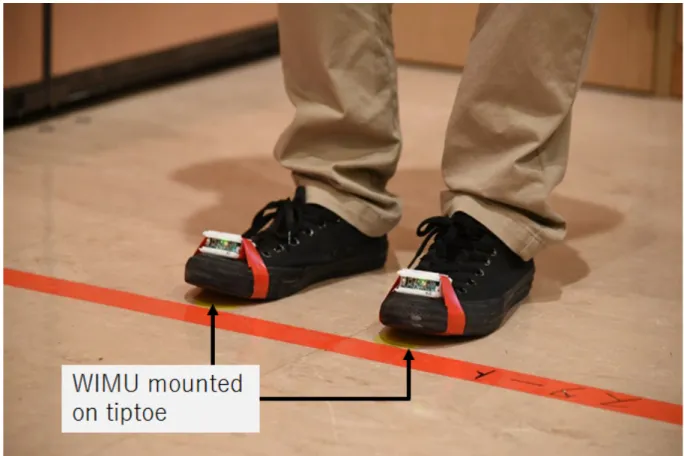
Fig. 2.13: WIMU are mounted on tiptoes for gait analysis experiment.
2.5 Interpolation of value exceeding measurement ranges
ɹ Gait analysis is performed using measured values of acceleration and angular velocity obtained from sensor attached to the toe. However, when measuring fastest gait of athletes and young persons especially, the acceleration and the angular velocity may exceed the measurement range of the high-sensitivity sensor used [15] . In this case, measurement values outside the measurement range cannot be obtained and the accuracy of gait analysis becomes low. Therefore in this thesis, in addition to the high sensitivity sensor, the author introduced low sensitivity sensor with wider measurement range although the resolution is lower than that of the high sensitivity sensor.
When the measured value of the high sensitivity sensor exceeds the predetermined
threshold value, value over the threshold value is interpolated using the measured value
of the low sensitivity sensor at the same time. The acceleration threshold is set at 100
[m/s 2 ] and the angular velocity threshold is set at 1000 [deg/s]. Figure 2.14 shows the
procedure of interpolation of value exceeding measurement ranges.
Fig. 2.14: When the measured value of the high sensitivity sensor exceeds the threshold,
the measurement value of the low sensitivity sensor is used.
Chapter 3
Principle of gait analysis
3.1 Construction of integration section
3.1.1 Distinction between stance phase and swing phase
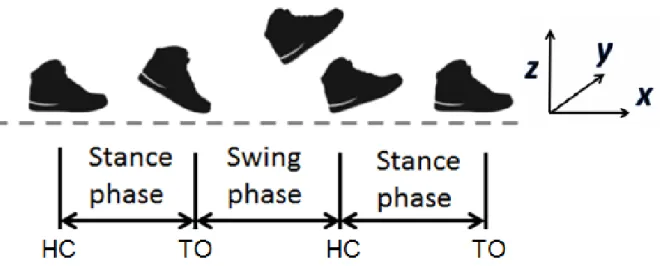
Figure 3.1 shows the state of foot during gait. The gait direction is defined as x- axis, the direction to the left during gait is defined as y-axis, and the upward direction is defined as z-axis. The elapsed time from a heel contact (HC) to the next HC of the ipsilateral leg is called the gait cycle and is divided into the stance phase and the swing phase. The stance phase refers to the section from the HC to the toe off (TO) where the foot portion is in contact with the support surface. The time from the HC of one leg to the toe off of the other side of the leg is called double support phase, and the time from the TO of one leg to the HC of the same leg is called a single support phase. In addition, the swing phase refers to the section in which the foot portion is apart from the support surface. The swing phase is divided into three phases. The period in which the foot has the acceleration to the front is called the acceleration phase, the period in which the foot has almost constant speed is called the mid swing phase, and the period in which the foot has deceleration from the acceleration direction is called deceleration phase [16] .
Gait analysis is performed for each step. Integration section is taken from section
minimum angular velocity c n is detected. From this, it can be inferred that the positive peak value of angular velocity immediately before c n is the toe-off action, and the positive peak value b n immediately after c n is the ground contact action. Therefore, it can be judged that the section from a n to b n including c n is the swing phase, and the section between b n−1 to a n and b n to a n+1 which comes before and after the swing phase section is the stance phase.
3.1.2 Integration section determination
Conventional method
The method of determining the integral section for normal walk is explained using Fig. 3.4. The minimal value c n indicating swing phase is found, and the TO time a n and the HC time b n are detected from the peak values of the angular velocities occured during plantar flexion and dorsiflexion before and after the minimal value. This is repeated as many times as the minimum values are found. The integration section is derived by determining the integration section start time S and the end time E which are derived by multiplying T a with A and T b with B where T a is the time duration between a current TO time and the previous TO time, T b is the time duration between a current TO time and the next TO time, A is the percentage of time duration until the starting time of the swing phase, and B is the percentage of time duration until the ending time of the swing phase. Note that A and B are determined in trial and error by various experiment so that the error between the estimated distance and the actual distance of a gait becomes the smallest. A and B are calculated as follows.
A = 117.71 ± T a
2
⎛ 2
192.75 ± T a
2
⎛
+ 88.76 [%] (3.1)
B = 115.47 ±
T b ⎛ 2
168.66 ±
T b ⎛
+ 117.25 [%] (3.2)
speed. With this method, the error of walking distance estimation may become large and is not compatible to short walking cycle at high speed walking. Therefore, the trend and characteristics need to be identified and based on the trend, a new integration section determination method is constructed so that the error of walking distance estimation becomes small.
Proposed method
From past research, it was found that the accuracy of maximum speed walking in the
large-scale health checkups is improved by setting the integration section based on the
minimum value of the synthetic angular velocity within a specific range [15] . The reason
why the accuracy was improved is that when the synthesized angular velocity is small, the
motion is relatively calm, and the estimation error is small when the posture is estimated
and results in the improved accuracy. The procedure for determining the integration
section is shown as follows (Fig. 3.5). First, let the time of the TO of the target gait cycle
be the origin, and let the section of the swing phase be 100 [%]. Subsequently, the time
at which the synthesized angular velocity is minimum within the range of -45 10 [%] is
taken as the integration start time. Next, the time when the combined angular velocity
is minimum within the range of 140 ʶ 10 [%] is taken as the integration end time, and
gait analysis is performed step by step based on the defined integration section.
Fig. 3.1: The state of foot during gait is determined by TO time and HC time.
Fig. 3.2: Dorsiflexion is when the toe goes upward and the heel goes downward. Plantar
flexion is when the toe goes downward and the heel goes upward.
Fig. 3.3: Method of deciding stance phase and swing phase.
Fig. 3.4: Conventional method of deriving integration section from synthetic angular
velocity waveform. This method was initially developed without considering experiment
with fast gait.
Fig. 3.5: The error in estimation of stride length is small when the integration section is
set at -45 10 [%]and 140 10 [%] of the swing phase
3.2 Theory of measuring bipedal walking motion of human
3.2.1 Acceleration derivation on fixed coordinate system
ɹ The walking velocity is derived by integrating three-dimensional (3D) acceleration data of the toe of the foot. Further integration derives the 3D trajectory of the toe. The tra- jectory during gait is calculated step-by-step to minimize effects of drift from the inertial sensor. This calculation is achieved by integrating the translational acceleration of the toe during each swing phase. During integration, 3D acceleration based on the sensor-fixed coordinate system is transformed into acceleration based on the earth coordinate system by defining the sensor coordinate system orientation. Let a three-by-three orientation matrix (OM) representing the sensor orientation with respect to the earth coordinate system be [ i j k ] = E(t), where i, j and k are three-by-one orthogonal unit vectors.
The acceleration and angular velocity based on the earth coordinate system E a(t) and
E ω(t) are calculated from the acceleration and angular velocity based on the sensor-fixed coordinate system S a(t) and S ω(t) using the following equations.
E a ( t ) = E ( t ) S a ( t ) (3.5)
E ω(t) = E ( t ) S ω( t ) (3.6)
At this time, E(t) is a OM having the basic unit vector i, j, k of the Σ coordinate system as its component.
E ( t ) =
i j k
(3.7)
=
⎤
⎦ i x j x k x i y j y k y i z j z k z
⎣
⎝ (3.8)
Furthermore,
angular velocity of the sensor from the foot-flat time. The sensor orientation is updated at every sampling period Δt in the integration section as shown below.
E ( t + Δt ) = R ( t ) E ( t ) (3.11) where R(t) stands for a rotation matrix, which rotates the OM E(t) around E ω(t) by an angle Δt E ω(t) . Rotation matrix R(t) is defined as follows.
R(t) =
⎤
⎦ cos θ + λ 2 (1 cos θ) λμ(1 cos θ) ν sin θ νλ(1 cos θ) + μ sin θ λμ(1 cos θ) + ν sin θ cos θ + μ 2 (1 cos θ) μν(1 cos θ) λ sin θ νλ(1 cos θ) μ sin θ μν(1 cos θ) + λ sin θ cos θ + ν 2 (1 cos θ)
⎣
⎝ (3.12)
⎞
⎠ λ μ ν
⎡
⎜ =
E ω(t)
E ω(t) (3.13)
The OM during walking is updated by performing the above rotation conversion for every sampling period in the integration section. With this, the acceleration in the fixed coordinate system can be obtained using equation (3.5).
3.2.2 Calculation of OM during stance phase
ɹ The three-dimensional translational movement is derived by integrating the acceleration
of section during swing phase and a part of stance phase. During this time, it is necessary
to know the posture of OM just before the start of integration. The posture of OM is the
component in each i ɼ j ɼ k as expressed as follows. Fig. 3.7 shows the derivation method
of OM in stance phase immediately before the start of integration. Let gravitational
acceleration be g and the angle between iɼjɼk and horizontal plane be θ x , θ y , and θ z .
During this time, gravitational acceleration g is facing upward because it is equivalent
expressed as follows.
tan θ x = j x
sin θ y (3.15)
when viewed from the positive y-axis direction and
j x = tan θ x sin θ y (3.16)
can be obtained. Similarly for k x ,
tan θ x = k x
sin θ z (3.17)
and
k x = tan θ x sin θ z (3.18)
can be obtained. For j y , using the cross product formula,
k z = i x × j y i y × j x (3.19)
sin θ z = cos θ x × j y (3.20)
j y = sin θ z
cos θ x (3.21)
can be obtained. Similarly component k y can also be calculated and becomes the following equation.
k y = i z × j x i x × j z (3.22)
= sin θ x tan θ x sin θ y cos θ x sin θ y (3.23)
= sin θ y × sin 2 θ x + cos 2 θ x
cos θ x (3.24)
= sin θ y
cos θ x (3.25)
Eventually, initial OM can be obtained as follows.
i 0 = (cos θ x 0 sin θ x ) T (3.26)
However, R zγ is a rotation matrix that rotates γ around the z-axis of the fixed coordinate system and can be expressed by the following equation.
R zγ =
⎤
⎦ cos γ sin γ 0 sin γ cos γ 0
0 0 1
⎣
⎝ (3.30)
Thus,
i =
⎞
⎠ cos γ cos θ x sin γ cos θ x
sin θ x
⎡
⎜ (3.31)
j =
⎞
⎟ ⎟
⎟ ⎠
cos γ sin θ x sin θ y sin γ sin θ z cos θ x
sin γ sin θ x sin θ y cos γ sin θ z cos θ x
sin θ y
⎡
⎜ (3.32)
k = i ± j . (3.33)
Here, immediately before the start of integration of the first step,
γ = 0 (3.34)
From the second step onwards, from the i which is the component of OM just before the end of integration,
γ = tan −1 i y
i x (3.35)
As stated above, the OM during stance phase is updated by calculating γ every time
it shifts to the stance phase and substitutes it into the equations (3.31), (3.32), and
(3.33). Then, assuming that the calculated OM of stance phase is equal to OM at the
integration start time, OM of the subsequent integration section is calculated as OM E n (t)
immediately after integration start as stated in the next section.
measure and remove these errors. On the other hand, the velocity of foot at t end becomes zero. Therefore, assuming that the integral error accumulates linearly with time between t 0 and t end and setting that the estimated velocity at t end is v e , the toe velocity v(t) during one step is modified by subtracting error which increases linearly between zero and v e from the time-integrated acceleration. The toe velocity v(t) is calculated as shown below.
v(t) = t
t
0E a(τ )dτ t t 0
t end t 0 v e (3.36)
Applying this modification method, the toe velocity reaches zero at t end in every step.
The 3D trajectory of the toe P (t) = [P x (t) P y (t) P z (t)] is obtained by further integration of velocity v(t). Because no slope exists on the walking surface, the vertical displacement of the sensor at t end must be zero. However, integration result of the vertical velocity rarely becomes zero because the assumption that integration error of the acceleration accumulates linearly is applied and the effect of sensor error remains still. Therefore, similar to the modification of the toe velocity, the vertical toe displacement P z (t) between t 0 and t end is modified by subtracting integration error of vertical velocity from the time- integrated vertical velocity. When the result of integrating vertical toe velocity is p ez at t end , P z (t) is calculated as shown below.
P z (t) = t
t
0v(τ )dτ t t 0
t end t 0 p ez (3.37)
The time trajectory of horizontal displacement of the toe D e (t) from the start location of gait (t = 0) to the stop location is calculated as shown below.
D e (t) = (P x (t)) 2 + (P y (t)) 2 (3.38)
However, D e (t) fundamentally includes integration error and differs from the actual
displacement with which the subject walked. Therefore, D e (t) is modified linearly so
that the estimated displacement with which the subject stopped agrees with the actual
3.2.4 Gait parameters
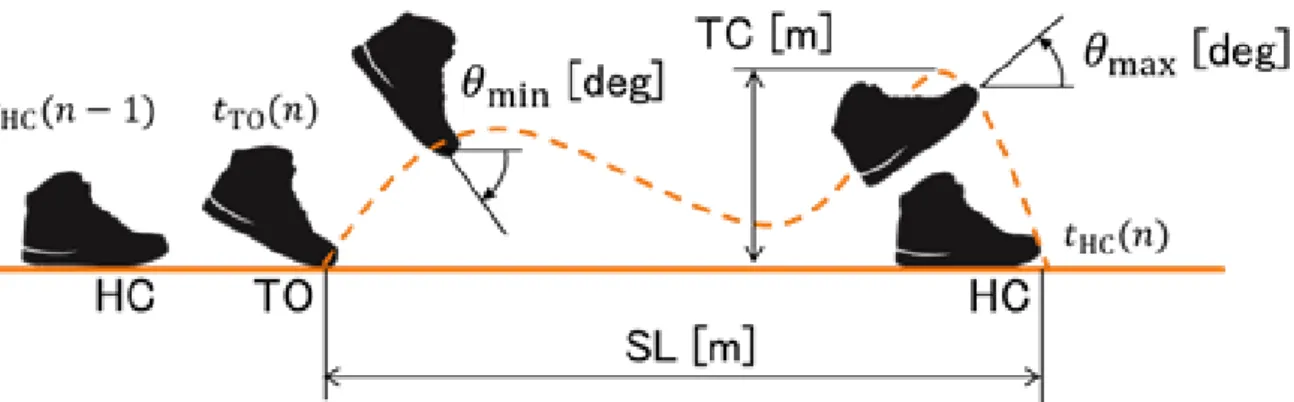
ɹ In the experiment, subjects are asked to walk on 16 [m] walking course and gait pa- rameters are obtained from 10 [m] section between 3 [m] point and 13 [m] point. Gait parameters derived in this thesis are the 10 [m] gait time (GT), stride length (SL), gait cycle (GC), gait velocity (GV), maximum toe angle (θ max ), minimum toe angle (θ min ), maximum toe clearance (TC), and percentage of swing phase (S p ). These are calculated off-line based on measured sensor data. Gait parameters obtained during one gait cycle are shown in Fig. 3.8. The GT is derived by first calculating D(t). Of those variables, D(t) of the right and left toe are calculated separately. Then the time at which the horizontal displacement of both toes reached 3 [m] and 13 [m] earlier are defined as t 3m and t 13m . Eventually, GT can be calculated as presented below.
GT = t 13m t 3m (3.40)
The SL is the horizontal displacement of the toe between TO and heel contact HC of the same side of the foot. Assuming the times of TO and HC of the nth stride as t TO (n) and t HC (n), respectively, then SL of the nth stride is obtained as shown below.
SL(n) = (P x (t HC (n)) P x (t TO (n))) 2 + (P y (t HC (n)) P y (t TO (n))) 2 (3.41) The GC is the elapsed time from one HC on t HC (n) to the next HC of the ipsilateral leg on t HC (n + 1). The gait cycle of the nth stride is calculated as
GC(n) = t HC (n + 1) t HC (n) (3.42)
The GC is divisible into a stance phase and a swing phase. The stance phase refers to
the period from the HC to the TO. The foot is in contact with the support surface in this
the beginning of the stance phase [17] . The GV of the nth stride is obtained as shown below.
GV(n) = SL(n)
GC(n) (3.43)
During one gait cycle, which starts with a HC and ends with the successive HC, the maximum toe clearance TC can be found from the peak of the vertical foot displacement P z (t). The toe angle is the amplitude of the angle of the toe direction from the floor. The inertial sensor is attached on the toe tip. Therefore, the toe angle is derived using the elevation angle of the unit vector i in OM. Assuming the vertical component of i during the swing phase and that of the stance phase as i sw and i st , the toe angle θ is calculated as presented below.
θ = sin − 1 i sw sin − 1 i st (3.44) Maximum and minimum toe angles θ max and θ min are obtained at every swing phase.
Also, S p is a ratio of the duration of the swing phase to the duration of one gait cycle.
The time of TO within the nth gait cycle is t TO (n). Therefore, S p of the nth step is defined as shown below.
S p (n) = t HC (n + 1) t TO (n)
GC(n) (3.45)
3.2.5 Detection of running
Subjects are asked to walk as fast as possible through 10 [m] gait time measurement.
However, running accidentally or intentionally occurs, causing inappropriate evaluation
of the health checkup. Therefore, the measured data evaluated as a running condition
must be removed from the experimentally obtained results. Running technically requires
both feet to be off the ground during a stride, although walking always has at least one
foot touching the ground. The gait condition is ascertained by the HC and TO time of
both feet. During walking, TO of one foot occurs after the HC of the other foot, meaning
Fig. 3.6: Phases during a gait are roughly divided into two, the stance phase and the
swing phase. The swing phase starts with a TO and ends with a HC. In synthetic angular
velocity waveform, maximal value is observed during TO and HC.
Fig. 3.7: Definition of coordinate system to the OM during the stance phase. g is the
gravitational acceleration and the angles θ x , θ y , θ z are relative to horizontal plane i, j, k.
Fig. 3.8: Gait parameters estimated using the sensor unit during one gait cycle (GC).
Stride length, maximum toe angle, minimum toe angle, and toe clearance are represented
as SL, θ max , θ min , and TC, respectively. SL is the distance between toe off (TO) and heel
contact (HC). t HC and t TO are time of HC and TO, and n is the number of steps. GC is
the time difference between t HC (n) and t HC (n 1). Gait velocity (GV) and percentage of
swing phase (S p ) are also obtained.
Chapter 4
Inertial gait analysis measurement system for large-scale health
checkups
4.1 Introduction
Dementia is the loss of cognitive functioning such as thinking, memory, and reasoning as well as behavioral capabilities to such an extent that it interferes with daily life activities.
Dementia is usually regarded as a predominantly cognitive disorder. However, aside from
cognitive decline, discussion has been made on neurocognitive function as related with
physical activity [18] . Recently reported evidence suggests that gait abnormalities can also
be found in early stages of the disease [19] . Gait abnormalities include decreased walking
speed, step length, step frequency, and increased gait variation [20–22] . People with risk of
dementia also tend to walk shorter distances, which can be caused by declining physical
function [23] . These gait disturbances are greater than the gait impairments that can be
expected to result from normal aging process [24] . Current evidence suggests that walking
is related closely to executive function [25–27] . Impaired executive function has been related
to decreased walking speed, increased stride time variation, increased incidence of falls,
and decreased performance of complex motor tasks [28, 29] . Although fall risk and gait
The School of Medicine of Hirosaki University has conducted health examinations for approximately 1000 citizens of Hirosaki city in Japan per year since 2005 as part of a cohort study. This project has been conducted to raise the health level of residents in the city and to extend the average healthy lifespan. The 10 [m] fastest gait examination has been conducted to investigate signs of cognitive impairment by measuring the gait time, which is known as an indicator of predicting dementia [35] . However, the earlier method requires that numerous staff members measure the gait time with a stopwatch by following subjects back and forth throughout a walking course [36] . Moreover, some subjects may run during the examination for good results, which leads to incorrect diagnostic results. It is difficult to visually judge whether they are walking or running. Therefore, movement of both feet for every step must be investigated to predict the deterioration of neurocognitive functions, such as that related to dementia, and to detect other disease precursors.
Gait parameters are obtainable from analysis of foot kinematics. Although spatiotem-
poral gait analysis is conducted using MCS, such a system is unsuitable when measuring
numerous subjects in a short time as with a large-scale health checkup because it requires
a dedicated laboratory and appropriate clothing of subjects. Ambulatory measurement
devices using body-worn inertial sensors can overcome some of these limitations and en-
ables analyze gait kinematics. Use of inertial sensors in physical activity monitoring have
gained popularity [37–40] because more accurate, more inexpensive, and smaller sensors are
available with the advancement of MEMS technology. Many systems are proposed to clas-
sify various physical activities such as walking, running, sitting, standing, walking upstairs
or downstairs, and cycling by placing sensors on human body [41–44] . Activity monitoring
systems using accelerometer can also be applied to identify different gait parameters and
walking pattern classification [45] and abnormal gait detection [46] . However, the inertial
measurement system is hardly used for quantitative evaluation in medical field because
In this chapter, the inertial measurement system for 10 [m] fastest gait examination at large-scale health checkups is proposed, where numerous subjects take the examina- tion simultaneously. The sensor system consists of an accelerometer and gyroscope with a wide measurement range to investigate the movement of one foot during fast walking precisely [51, 52] . The sensor unit is useful to measure several kinds of spatiotemporal gait parameters. Measurement error from numerical integration of inertial data can be cor- rected periodically by assuming null velocity of the foot during the stance phase. Because the 10 [m] fastest gait examination must be performed while walk, not run, two sensor units are used to identify the gait condition by mounting them on both feet. Gait param- eters derived from the inertial sensor are gait time, stride length, gait cycle, gait velocity, toe angle, maximum toe clearance, and the percentage of swing phase. The gait time of 10 [m] fastest gait examination is estimated using the displacement of both feet and is compared with that measured by a stopwatch. Then the practicality of the system in place of the stopwatch is confirmed. Moreover, correlation coefficient between gait param- eters estimated and the MMSE is investigated to find an indicator to evaluate cognitive impairment. Characteristics of estimated gait parameters by age are investigated and utilization of inertial sensor to measure the gait parameters in large-scale health checkups is discussed.
4.2 Mini-Mental State Examination (MMSE)
To measure the level of cognitive impairment, MMSE has been used extensively in
clinical and research settings. MMSE is a 30-point test that includes simple questions
and problems from several areas such as the recognition of time and place, repeating lists
of words, arithmetic, language use and comprehension, and basic motor skills. A score of
24 or more indicates a normal cognition. A score of 23 or less indicates a possibility of
complete the test successfully, subjects must have adequate hearing and vision and they
must demonstrate sufficient musculoskeletal function to be able to write with a pencil or
pen [53, 54] . A salient benefit of MMSE is that it requires no special equipment or training
and that it has both validity and reliability for the diagnosis of dementia. Because the
administration period is short and easy to use, MMSE is useful for cognitive assessment
in the clinician’s office space or at the bedside [55] .
4.1: MMSE is conducted as indicator to the sub ject’s lev el of cognitiv e impairmen t.
4.3 10 m fastest gait experiment
WIMU system is used as the measurement tool of gait parameters in health checkup.
At the checkup site of the 10 [m] fastest gait measurement, several subjects wear sensor systems and wait in a row for the start of the measurement. The examiner turns on the power switch of two sensors attached on both feet before measurement starts. Then the examiner begins recording inertial data using a wireless controller to synchronize the start time of two sensors exactly (Fig. 4.2). However, sensors are turned off using the on-board switch because powering off wirelessly might cause other sensors used during measurements to stop. Data were sampled at 100 [Hz] and were stored into a microSD card.
Large-scale health checkups have been conducted by Hirosaki University, Japan, since 2005. About 1000 subjects receive health checkup every year. This study used measured data of 1406 people (604 men, 52.3
±15.4 years old; 802 women, 53.5
±15.2 years old) who had taken the 10 [m] fastest gait examination in 2016 and 2017. Figure 4.3 shows the number of subjects and their age distribution. The health checkup was approved by Hirosaki University Ethics Committee. Informed consent was obtained from all subjects.
Figure 4.4 portrays a schematic diagram of the experiment. If a subject wears shoes
that are unsuitable for the measurement such as loose shoes, slippers and sandals, the
prepared exercise shoes are used. Inertial sensors were fixed on the toe tips of both feet
of the subject using adhesive tape so that the i axis of the sensor unit coincides with the
toe direction. The subjects were asked to move to the start line and then to walk on
a 16 [m] walking course as fast as possible but were cautioned to avoid running. The 3
[m] and 13 [m] points on the walking course were marked with cones and adhesive tape
pasted on the floor as a sign of 10 [m] distance. The examiner who walked along with the
on the microSD card are copied to the computer and are analyzed.
The feasibility of the inertial measurement system as a measurement tool of physical
performance in health checkup is investigated. Gait parameters showing high correlation
with MMSE are derived.
Fig. 4.2: A subject stands at the start line with inertial sensors equipped on both feet. A
remote controller starts measurement.
Fig. 4.3: Relation of the number of subjects by age.
Fig. 4.4: Schematic diagram of the experiment. Distance walked is measured where the
subject stopped from the scale on the floor. For example, when the front foot stopped as
in the figure, the total length walked is recorded as 13.5 [m].
4.4 Results
4.4.1 Compensation of gait distance with actual value
ɹ The time taken for the whole measurement process was about two to three min. The time taken for analyzing raw inertial data to obtain gait parameters was about 9 [s] per subject using programming software (MATLAB; Mathworks Inc.). Figure 4.5 presents an example of experimental results of horizontal displacement for both toes and gait parameters estimated for a subject (woman, 44 years old; MMSE score 30) using the inertial measurement system. From top left to lower right, horizontal displacement of both feet, stride length (SL), gait cycle (GC), gait velocity (GV), maximum toe angle (θ max ), minimum toe angle (θ min ), maximum toe clearance (TC), and percentage of swing phase (S p ) are depicted. The red lines indicate the 3 [m] and 13 [m] points and is obtained from the horizontal displacement of both feet. Circles are places where the stance phase occurred. In this example, the actual walking distance was 14.9 [m]; the estimated distance was 14.5 [m]. Applying equation (3.39) for modification of the horizontal displacement, the right foot passed the 3 [m] line and 13 [m] line at 13.93 [s] and 17.61 [s], and the left foot passed the 3 [m] line and the 13 [m] line at 13.69 [s] and 17.84 [s], respectively.
The horizontal displacement of each subject can be measured by reading the scale where the subject stopped on the walking course. It is regarded as the reference displacement.
The displacement estimated using the inertial measurement system is modified linearly
to match the reference displacement using equation (3.39). The 10 [m] gait time is recal-
culated and then compared with time recorded using a stopwatch, which is the reference
time. The relation between the actual gait time GT SW and the estimated gait time GT IS
using inertial measurement system of all subjects is shown in Fig. 4.6. The average and
standard deviation of GT SW and GT IS are 3.58 0.85 [s] and 3.56 0.84 [s], respectively,
and root mean square error is 0.24 [s]. The correlation coefficient is 0.96, which is suffi-
4.4.2 Classification of subjects by running incidence
ɹ Figure 4.7 depicts the relation between running incidence rate (RIR) and the number of measurements of all subjects. The RIR is the ratio of the number of steps ran to the number of total steps during one measurement and is derived from the temporal relation of the TO and the HC of both feet. When a subject runs three steps and the total number of steps taken is ten during the measurement, RIR is 0.3, for example. The total number of measurements is 2814, and it is confirmed that 1944 measurements (69.1 [%]) resulted in almost no running with RIR of 0.2 or less and 97 measurements (3.5 [%]) were almost running with RIR of 0.8 or more across the entire 10 [m] section. In this study, RIR of 0.2 or less is treated as walking, otherwise it is treated as running.
4.4.3 Correlation between MMSE with gait parameter
ɹ The relation between ages of all subjects with gait parameters and MMSE score is presented in Fig. 4.8. It is readily apparent that the gait parameters deteriorate as the subjects become older. The changes in GT IS , GC, and GV over the age of 60 are espe- cially remarkable. Change ratios between the age of 20 and 80 of these gait parameters are 58.9 [%], -22.6 [%] and -22.55 [%], respectively. The average MMSE score also drops as age increased and the change ratio results in -5.5 [%]. From these results, it is suggested that the gait time is the most sensitive to the decline in physical performance with age.
Next, the author leaves the calculation of gait parameters and moves to investigation of
correlation between MMSE and gait parameters. Figure 4.9 represents the absolute val-
ues of correlation coefficient R between MMSE with gait parameters. The correlation
coefficient with the gait time measured by a stopwatch GT SW is also illustrated as the
reference. Note that GT IS is obtained using gait time without running data and GT SW in-
volves running data. The GT shows the highest correlation with MMSE, with R value
second highest correlation among the gait parameters obtained from the inertial measure-
ment system. However, little relation is observed between SL and MMSE. Therefore, it
is suggested that the prolonged gait time causing a decrease in MMSE score results from
the extension of GC rather that the shortening of SL.
Fig. 4.6: Relation between estimated time GT IS with reference time GT SW . Correlation
coefficient improved from 0.91 to 0.96 after modification of walking displacement.
Fig. 4.7: Running incidence rate and the number of measurements. 1944 measurements
(69.1 [%]) were rarely running and 97 (3.5 [%]) were almost running.
Fig. 4.9: Correlation coefficient between MMSE with gait parameters.
4.5 Discussion
ɹ This thesis presents a proposal for utilization of the inertial measurement system as a measurement tool of physical performance in the large-scale health checkup and the use of the fastest gait time as an indication to predict the possibility of mild cognitive impairment. The subject’s gait was measured using two inertial sensors, which allowed the users to obtain diverse information related to gait parameters. Results show that the gait measurement is fast and easy and that it imparts a minimal burden on subjects in addition to the examiner. Calculating the gait parameters also takes short time. The results can be presented on the spot when requested.
MMSE results are used as an index of the subject’s cognitive impairment level. From the 10 [m] fastest gait experiment, it is confirmed that GT IS shows the highest correlation with the MMSE score. Moreover, removal of the running data improves the correlation coefficient. Reportedly, the increase in GT results from the extension of GC. Ijmker and Lamoth [19] conducted a gait experiment by classifying the study sample into three groups: dementia patients, healthy elderly people, and younger elderly people. The report described that dementia patients scored significantly lower on MMSE and gait speed than the other groups, which supports the author’s result. The difference is that dementia patients were not joined to the measurement conducted in the study. The MMSE score was high in this study.
The inertial sensor estimation accuracy has been verified by comparing estimated data
with data using MCS [51] . Error in estimation for the toe angle amplitude, toe height,
and stride length are, respectively, 6.9 3.7 [deg], 7.4 20.2 [mm], and 15.14 26.1
[mm]. The system can estimate gait parameters with reasonable accuracy. An earlier
report [56] described that the estimation precision of total gait distance has improved from
5.23 5.64 [%] to 0.81 5.40 [%] and that the estimation precision of 10 [m] gait
MMSE.
A salient benefit of using two inertial sensors mounted on both feet instead of a stop- watch for the 10 [m] fastest gait experiment is that the inertial sensor can provide a gait condition whether the subject is walking or running. Information related to gait param- eters can also be estimated at each step. The changes of spatiotemporal parameters are visible. A fully wearable inertial sensor is practical for use in supporting objective studies of gait casualties and that it is a good substitute for examiner operation.
An important limitation of this study is that weak correlation ( R = 0.34) has been found for the relation between MMSE and GT IS ; GT IS along cannot be used for diagnosis.
Machine learning technology using GT IS and other gait parameters together with results of medical examination can provide a new method of diagnosing cognitive impairment.
4.6 Conclusion
ɹ The measurement system of gait parameters using two inertial sensors mounted on both feet was proposed for large-scale health checkups. Using two sensors, precise mea- surement of gait time and judgment of gait condition whether walk or run are achieved.
The proposed method of predicting the mild cognitive impairment from gait parameters
was evaluated by finding correlation with the MMSE score obtained from young to el-
derly subjects. By excluding the data evaluated as running, the correlation higher than
the conventional gait time obtained using a stopwatch is confirmed. It showed good
suitability for clinical gait evaluation. The current study has produced an important con-
tribution to gait and posture research because the proposed system not only provides gait
parameters from inertial data, but it also enables classification of the gait condition. The
inertial measurement system is useful as an objective tool in many applications requiring
Chapter 5
Simultaneous measurement of 3D
foot trajectory and center of gravity
5.1 Introduction

![Fig. 4.7: Running incidence rate and the number of measurements. 1944 measurements (69.1 [%]) were rarely running and 97 (3.5 [%]) were almost running.](https://thumb-ap.123doks.com/thumbv2/123deta/5924664.2055680/62.892.253.691.444.793/running-incidence-number-measurements-measurements-rarely-running-running.webp)