GENETIC VARIATION IN PCDH11X IS ASSOCIATED WITH SUSCEPTIBILITY TO LATE ONSET ALZHEIMER’S DISEASE
Minerva M. Carrasquillo1),Fanggeng Zou1),V. Shane Pankratz2),Samantha L. Wilcox1), Li. Ma1),Louise P. Walker1),Samuel G. Younkin1),Curtis S. Younkin1),Linda H. Younkin1),
Gina D. Bisceglio1),Nilufer Ertekin-Taner1,3),Julia E. Crook4),Dennis W. Dickson1), Ronald C. Petersen5),Neill R. Graff -Radford1,3) and Steven G. Younkin1)
Abstract By analyzing late onset Alzheimerʼs disease (LOAD) in a genome wide association study of 3 American Caucasian series and evaluating the 25 SNPs with most significant allelic association in 4 additional series, we identifi ed a SNP (rs5984894) on Xq21.3 in PCDH11X that is strongly associated with LOAD in American Caucasians
(total n=4,855; AD:2,391; control:2,464). Analysis of rs5984894 by logistic regression using sex as a covariate gave a global p value of 3.9 x 10⁻¹² in the combined series. Odds ratios were 1.75 (95% CI 1.42-2.16) for female homozygotes
(P=2.0x10⁻⁷) and 1.26 (95% CI 1.05-1.51) for female heterozygotes (P=0.01) compared to female non-carriers. For male hemizygotes (P=0.07) compared to male non-carriers the odds ratio was 1.18 (95% CI 0.99-1.41). The eff ect of this variant was dose dependent, as females homozygotes for the minor allele were at signifi cantly greater risk than heterozygous females and hemizygous males. We tested additional variants in PCDH11X for association with LOAD. One of these variants, rs2573905, showed association with LOAD similar to that for rs5984894, albeit with a slightly more significant p-value (5.4x10⁻¹³). This is not surprising since these two variants are in near perfect linkage disequilibrium (r2 = 0.98, Dʼ = 0.99), and the minor allele of these two SNPs occur on the same haplotype.
However, rs2573905 is in a sequence that has been evolutionarily conserved between human and mice, with 70%
sequence identity over 100bp, suggesting a possible functional role for this SNP. Joint analysis of APOE and rs2573905 genotypes showed that 75 women with LOAD (4.9%) were homozygous both for APOE e4 and for rs2573905 whereas only 2 unaff ected women (0.15%), both age 73, were double homozygotes. These fi nding suggest that the double homozygote may be fully penetrant in women over the age of 73 and that this combination may account for
~5% of the AD that occurs in women
Hirosaki Med.J. 61, Supplement:S125―S134,2010
Background
Late onset Alzheimerʼs disease (LOAD), the most common cause of dementia in the elderly1), is a neurodegenerative disease characterized by la rge nu mbers of sen i le plaques a nd neurofi brillary tangles in the brain. Multiple rare mutations in the APP, PSEN1 and PSEN2 genes cause an early onset familial form of AD with autosomal dominant inheritance, but the only well established susceptibility allele for LOAD is
1)Department of Neuroscience, Mayo Clinic College of Medicine, Jacksonville, FL 32224, USA
2)Division of Biomedical Statistics and Informatics, Mayo Clinic and Mayo Foundation, Rochester, MN 55905, USA
3)Department of Neurology, Mayo Clinic College of Medicine, Jacksonville, FL 32224, USA
4)Biostatistics Unit, Mayo Clinic College of Medicine, Jacksonville, FL 32224, USA
5)Department of Neurology and the Mayo Alzheimer Disease Research Center, Mayo Clinic College of Medicine, Rochester, MN 55905, USA
To whom correspondence should be addressed:
the APOE ε4, allele2-4). Twin studies indicate that susceptibility alleles contribute to as much as 80% of LOAD cases5) but defi nitive identifi cation of other genes with LOAD susceptibility alleles has proven difficult. To identify novel LOAD susceptibility genes, we performed a two-stage genome-wide association study (GWAS) using Illumina HumanHap300 BeadChips6).
Subjects in the two stage LOAD GWAS
Stage I subjects had ages at diagnosis/
entry of 60 -80 years and were drawn from three series. Two series were assembled from cases and controls ascertained clinically at the Mayo Clinic in Jacksonville, FL (JS: 353 AD, 331 control) and Rochester, MN (RS: 245 AD, 701 control). A third, autopsy-confirmed series
(AUT: 246 AD, 223 control) was assembled from the Mayo brain bank. In stage II, we genotyped the 25 SNPs with the most signifi cant association in stage I in an additional 845 cases and 1,000 controls drawn from the same three series but with ages at diagnosis/entry of over 80 years (JS: 237 AD, 260 control; RS: 276 AD, 624 control; AUT: 332 AD, 116 control) and from a National Cell Repository for AD series of 702 cases (1/family) and 209 controls with ages at diagnosis/entry of over 60 years.
DNA amplifi cation
DNA from the RS and AUT series was scarce, so samples from these two series were subjected to whole genome amplification
(WGA) using the Illustra GenomiPhi V2 DNA Amplification Kit (GE Healthcare Bio-Sciences Corp., Piscataway, NJ). To attenuate random amplification errors, we performed four 5 ul reactions for each sample, rather than a single 20 ul reaction. Each 5 ul reaction contained 5-15 ng of genomic DNA as template, according to the quality of the genomic DNA. These four reactions were then combined. To evaluate the quality of each WGA DNA sample, a TaqMan®
SNP Genotyping Assay (Applied Biosystems, Foster City, CA) was used to obtain genotypes for SNP rs2830072 in both the original genomic
(non-WGA) DNA and in the WGA DNA. Only WGA DNA samples that fell within well defi ned genotype clusters and that had genotype calls for rs2830072 that were in agreement with their non-WGA DNA genotypes were included in the series. In our hands, pooling four 5 ul reactions gave better genotype clusters and fewer miscalls than a single 20 ul reaction.
Quality Control
In our stage I GWAS, we genotyped 318,237 SNPs in samples from 2,465 subjects. Genotype clusters were determined using Illuminaʼs BeadStudio 2.0 software after first eliminating 240 samples (9.7%) with call rates of <90% on the fi rst pass. This initial quality control measure eliminated a higher percentage of the WGA DNA samples. Of the 1,734 RS/AUT samples, all of which were WGA DNA, 213 (12.3%) had call rates of < 90%. Of the 731 JS samples, all of which were non-WGA DNA, 27 (3.7%) had call rates <90%.
We also eliminated 87 AUT samples (3.5%)
with Braak stages of 3.0 or 3.5, so that all AUT AD samples had a Braak stage of 4.0 or greater, and all AUT control samples had a Braak stage of 2.5 or lower. Using fi lters available in PLINK7), we eliminated all SNPs with call rates <90%, minor allele frequencies <0.01, and/or Hardy- Weinberg P values <0.001. Using the sex check option provided by PLINK, we identified and removed 21 additional samples (0.9%) with a mismatch between the recorded sex and the sex deduced by evaluating the heterozygosity of SNPs on the X chromosome. We also checked for cryptic relatedness by using the --genome option in PLINK to evaluate paired identity by descent in all samples genotyped in stage I.
This check revealed 16 pairs with PI̲HAT over 99% thereby identifying 16 subjects for which two samples had been genotyped. Of these 32 samples, 14 were retained and 18 (0.8%) were eliminated. We eliminated one sample from 14 subjects where all samples had identical subject information and where we were able to confi rm independently that the paired samples came from the same subject. We eliminated four samples
(two pairs) where key subject information (e.g.
gender, age) associated with the two samples was in confl ict. Two DNA samples from diff erent blood draws were genotyped in one RS subject
where only one of the two samples was retained.
The other 13 subjects that were retained had one DNA sample derived from the brain at autopsy (AUT), which was retained, and one derived from blood taken during life (JS or RS), which was eliminated. The duplicates in these 13 subjects went undetected because the identifi ers for samples in the AUT samples, which mostly came from the brains of subjects who were not seen at Mayo, were not linked to the identifi ers in the JS or RS series.
These quality control measures left 2,099 subjects (8 5 . 2 %) in whom 313 , 5 0 4 SN Ps
(98.5%) were analyzed. Of the 2,099 samples that met our quality control criteria in stage I, 1,415 were RS or AUT (WGA DNA) samples of good quality. The average call rate of 99.2%
in the WGA samples was essentially identical to the average call rate of 99.3% in the 684 DNA samples from the JS series (non-WGA DNA). Thus the call rates using BeadChips were comparable for WGA and non-WGA DNA once WGA samples of poor quality were identified and eliminated.
The genotype clusters for the 25 SNPs with the most significant P values in stage I were visually inspected as an additional quality control check. This check showed that 3 of the 25 SNPs
(rs3858095, rs231814 4, and rs30 07421) had unsatisfactory clusters that caused inaccurate genotyping of many heterozygotes and minor allele homozygotes. This was evidenced by the much higher minor allele frequencies observed in controls of the follow-up series where all three SNPs were genotyped well using SEQUENOM iPLEX technology. Two of these SNPs (rs3858095 and rs3007421) were eliminated by increasing the stage I call rate cut-off for samples and SNPs from 90% to 95%, but rs2318144 was not eliminated even when the call rate cut-off for samples and SNPs was increased to 98%.
rs2318144 had a Hardy-Weinberg P value of 0.05 and therefore also failed to be eliminated by our
cut-off P value of 0.001. These results underscore the importance of checking SNPs with highly significant association by visually inspecting their genotype clusters and by genotyping follow-up series on a diff erent platform.
Initial results of two stage LOAD GWAS
In stage I, after the stringent quality control described above, we analyzed 313,504 SNPs in 844 cases and 1,255 controls. In stage I, six SNPs linked to APOE were the only SNPs to achieve genome-wide significance after Bonferroni correction for the 313, 504 SNPs tested.
In stage II, we genotyped the 25 SNPs with the most signifi cant association in stage I. The top 25 SNPs tested in stage II included 10 SNPs in the APOE region of chromosome 19 and 15 SNPs on other chromosomes. All 10 SNPs in the APOE region showed significant association in stage II with P values ranging from 9.5x10-79 to 0.05. One of the two SNPs on the X chromosome, rs5984894, also replicated well in the stage II follow-up series with a P value of 0.0006 that retained signifi cance
(P=0.015) even after conservative Bonferroni correction for 25 SNPs tested in stage II. None of the other SNPs replicated in stage II.
Because our stage I and stage II subjects came from multiple American Caucasian series, PLINK7) was employed to test rs5984894 for allelic association in the combined stage I + II datasets using the Mantel-Haenszel method
(Table 1) in addition to the χ2 test on combined allele counts. The overall P value for allelic association in stage I + II was 3.8x10⁻⁸ with an OR of 1.29 (95% CI 1.18-1.41), and 2.2x10⁻⁷ with an OR of 1.30 (95% CI 1.18-1.43) using the Mantel-Haenszel method (Table 1). Analysis using the Breslow Day test showed no evidence for series to series heterogeneity among the seven series tested.
Analysis of rs5984894 by multivariable logistic regression with sex as a
covariate
We next analyzed rs5984894, which is within the PCDH11X gene (Fig. 1) by multivariable logistic regression with sex as a covariate (Table 2). Using this approach, which specifically models each carrier group, the global P value in the combined series improved substantially to 3.9x10⁻¹² as compared to 3.8x10⁻⁸ for allelic association and 2 . 2x10⁻⁷ using the Mantel- Haenszel method (Table 1). In the combined series, odds ratios were 1.75 (95% CI 1.42-2.16)
for female homozygotes (P=2.0x10⁻⁷) and 1.26
(95% CI 1.05-1.51) for female heterozygotes
(P=0.01) compared to female non-carriers. For male hemizygotes (P=0.07) compared to male non-carriers, the odds ratio was 1.18 (95% CI 0.99-1.41) (Table 2). Male sex, which had an OR of 0.86 (95% CI 0.71-1.05) was not a signifi cant covariate (P=0.14) in the combined data. Female homozygotes in the combined series were at significantly increased risk not only when compared to female non-carriers (P=2.0x10⁻⁷)
but also when compared to female heterozygotes
(P=0.0005) or male hemizygotes (P=1.4x10⁻⁷).
The OR for female homozygotes in stage I was 1.92 (95% CI 1.36-2.70) with a P value of 0.0002.
This association replicated well in stage II where the OR was 1.70 (95% CI 1.29-2.24) with a P value of 0.0002 (Table 2). The global P value of 5.7x10⁻⁵ in stage I also replicated well, improving to 4.8x10⁻⁶ on follow-up.
Control for population stratifi cation
Using st age I GWAS dat a , populat ion s t r a t i f i c a t i o n w a s ev a lu a t e d u s i ng t h e principal components approach implemented in EIGENSTRAT8). Adjustment for population substructure was performed by including the top ten axes of variation generated by EIGENSTRAT as additional covariates in logistic regression analyses using an allelic dosage model and in multivariable logistic regression analyses of rs5984894. These adjustments to the allelic dosage and multivariable logistic regression analyses had essentially no eff ect on the results obtained for the stage I GWAS data.
Thus, population substructure did not infl ate the
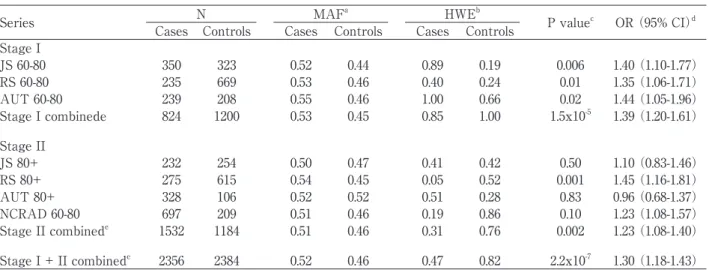
Series N MAFa HWEb
P valuec OR (95% CI)d Cases Controls Cases Controls Cases Controls
Stage I
JS 60-80 350 323 0.52 0.44 0.89 0.19 0.006 1.40 (1.10-1.77)
RS 60-80 235 669 0.53 0.46 0.40 0.24 0.01 1.35 (1.06-1.71)
AUT 60-80 239 208 0.55 0.46 1.00 0.66 0.02 1.44 (1.05-1.96)
Stage I combinede 824 1200 0.53 0.45 0.85 1.00 1.5x10⁻⁵ 1.39 (1.20-1.61)
Stage II
JS 80+ 232 254 0.50 0.47 0.41 0.42 0.50 1.10 (0.83-1.46)
RS 80+ 275 615 0.54 0.45 0.05 0.52 0.001 1.45 (1.16-1.81)
AUT 80+ 328 106 0.52 0.52 0.51 0.28 0.83 0.96 (0.68-1.37)
NCRAD 60-80 697 209 0.51 0.46 0.19 0.86 0.10 1.23 (1.08-1.57)
Stage II combinede 1532 1184 0.51 0.46 0.31 0.76 0.002 1.23 (1.08-1.40)
Stage I + II combinede 2356 2384 0.52 0.46 0.47 0.82 2.2x10⁻⁷ 1.30 (1.18-1.43)
Table 1 Descriptive statistics and allelic association results for SNP rs5984894. aMinor allele frequency in cases and controls for each series. MAF was not different between males and females in controls. bHardy-Weinberg equilibrium P values for female cases and female controls in each population. cP values were calculated for each individual series using a χ2 test on allele counts. dOdds ratios (OR) were calculated for the minor allele in each series; 95% confi dence intervals are shown in parentheses. eP values and ORs using data from multiple series were calculated using the Mantel-Haenzel method. (Adapted from Carrasquillo et al., 2009)
signifi cance of stage I GWAS results, and given the similarity in the populations included in stages I and II it is unlikely that it infl ated the highly signifi cant associations observed in stage II and in the combined data.
Analysis of additional PCDH11X SNPs
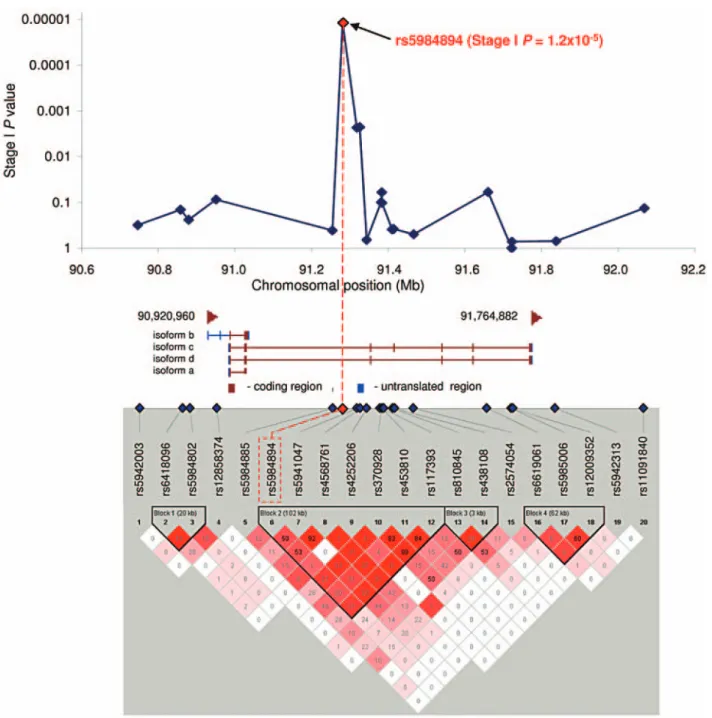
rs5984894 maps to a 102kb linkage disequilib- rium (LD) block on chromosome Xq21.3 that lies entirely within the gene (PCDH11X) encoding protocadherin 11, X-linked. This LD block
Figure 1 Schematic overview of PCDH11X and LD plot showing PCDH11X haplotype blocks. Unadjusted allelic association P values from stage I for variants encompassing the PCDH11X locus are plotted over physical distance above the PCDH11X gene diagram. The four PCDH11X RefSeq isoforms and their chromosomal positions are depicted as in Entrez Gene (build 36.3). The LD plot shown is for variants in the PCDH11X locus
(stage I data in Haploview 4.0, solid spine haplotype block defi nition, r2 values with Dʼcolor scheme). (Adapted from Carrasquillo et al., 2009)
encompasses part of intron 2, exon 3 and part of intron 3 of PCDH11X isoforms c and d (Fig.
1). To extend our analysis of PCDH11X, three PCDH11X SNPs (rs5941047 and rs4568761 and rs2573905) that reside on the same haplotype block as rs5984894 were genotyped in all stage I + II subjects (2,524 AD, 2,698 control) from the JS (635 AD, 698 control), RS (577 AD, 1418 control), AUT (610 AD, 373 control), and NCRAD (702 AD, 209 control) series. rs5941047 and rs4568761 were followed-up in the stage II subjects because both had nominally signifi cant P values of 0.0023 for allelic association in stage I. rs2573905 is located 8,483 bp 3ʼ of rs5984894.
Both rs5984894 and rs2573905 reside deep in intron 2 of PCDH11X isoforms c and d, over 54 kb and 62 kb upstream of exon 3 respectively.
rs2573905 was genotyped in the combined series because it is in a 100 bp region that is 70% conserved between the human and mouse sequence and therefore likely to be functionally relevant. All three SNPs were analyzed for association with LOAD using the Mantel- Haenszel method. In the combined dataset, highly signifi cant associations were observed for all three SNPs with P values for rs2573905, rs5941047, and rs4568761 of 1.6x10⁻⁷, 8.0x10⁻⁵ and 0.001 respectively. Breslow Day P values for rs2573905,
rs5941047, and rs4568761 were 0.55, 0.35, and 0.23 respectively indicating a lack of statistical evidence for series to series heterogeneity among the seven series tested.
rs2573905 is in strong linkage disequilibrium with rs5984894 (r2=0.98, Dʼ=0.99). Thus functional changes caused by rs2573905 may account for the strong association of rs5984894 with LOAD.
Because of the strong LD between rs2573905 and rs5984894, analysis of rs2573905 by multivariable logistic regression with sex as a covariate gave results for female heterozygotes, female homozygotes and male hemizygotes that were nearly the same as those for rs5984894 (Table 3) although the global P value for rs2573905 was more signifi cant in the combined series (5.4x10⁻¹³ vs. 3.9x10⁻¹²) where rs2573905 was genotyped successfully in more subjects (5,010 vs. 4,740).
Penetrance of double homozygotes for the APOE ε4 allele and the rs2573905
minor allele
To better understand the effect of the PCDH11X rs2573905 variant and how it relates to the risk conferred by the APOE gene, we assessed the distribution of the rs2573905 and APOE genotypes. This analysis was performed on the samples that were included in our GWAS,
Series Sex Male Hemizygotes Female Heterozygotes Female Homozygotes
Global P
OR (95% CI) P OR (95% CI) P OR (95% CI) P OR (95% CI) P
Stage I
JS 60-80 1.28 (0.78-2.11)0.33 1.28 (0.79-2.09) 0.31 1.66 (1.04-2.63) 0.03 1.96 (1.14-3.36) 0.01 0.09 RS 60-80 1.00 (0.58-1.72)0.99 1.20 (0.76-1.90) 0.43 1.46 (0.87-2.44) 0.16 2.02 (1.12-3.64) 0.02 0.04 AUT 60-80 0.79 (0.41-1.53)0.48 1.40 (0.85-2.32) 0.19 1.55 (0.77-3.12) 0.22 2.00 (0.91-4.40) 0.09 0.03 Stage I combined 0.98 (0.72-1.33)0.90 1.33 (1.02-1.74) 0.04 1.43 (1.06-1.92) 0.02 1.92 (1.36-2.70) 0.0002 5.7x10⁻⁵
Stage II
JS 80+ 1.33 (0.73-2.44)0.35 0.96 (0.54-1.71) 0.89 1.58 (0.91-2.72) 0.10 1.33 (0.70-2.55) 0.38 0.60 RS 80+ 0.75 (0.46-1.22)0.25 1.19 (0.74-1.91) 0.48 1.04 (0.67-1.62) 0.86 2.28 (1.39-3.73) 0.001 1.0x10⁻⁴ AUT 80+ 0.44 (0.19-1.01)0.05 0.97 (0.49-1.92) 0.94 0.76 (0.36-1.61) 0.47 0.97 (0.39-2.39) 0.95 0.05 NCRAD 60+ 1.11 (0.67-1.84)0.67 0.95 (0.58-1.58) 0.86 1.19 (0.75-1.88) 0.47 1.71 (0.98-2.97) 0.06 0.35 Stage II combined 0.89 (0.69-1.15)0.37 1.04 (0.82-1.33) 0.74 1.19 (0.94-1.50) 0.15 1.70 (1.29-2.24) 0.0002 4.8x10⁻⁶ Stage I + II combined 0.86 (0.71-1.05)0.14 1.18 (0.99-1.41) 0.07 1.26 (1.05-1.51) 0.01 1.75 (1.42-2.16) 2.0x10⁻⁷ 3.9x10⁻¹² Table 2 Logistic regression results for rs5984894 comparing male hemizygotes, female heterozygotes, and female
homozygotes to the female non-carriers, using male sex as covariate. (Adapted from Carrasquillo et al., 2009)
but exclusively in females (affected n =1,518, unaffected n =1,378), since males only have one X-chromsome and therefore can only be hemizygotes rather than homozygotes for the rs2573905 alleles. Table 4 shows the number of individuals with each of the possible genotype combinations of the APOE and rs2573905 alleles.
The genotypes formed by APOE epsilon alleles
(ε2, ε3 and ε4) are listed under the APOE column. The genotypes formed by the rs2573905 C and T alleles (C/C = homozygotes for the major C allele, C/T = heterozygotes, and T/T
= homozygotes for the minor allele) are listed across the top. Note that although the T allele is the minor allele amongst the controls (unaff ected females in Table 1b), its frequency is greater in the affecteds, making the T allele the major allele in this group. Inspection of the genotype distributions revealed that 75 women with LOAD
(4.9%) were accounted for by the APOE ε4/ε 4-rs2573905 T/T genotype combination, whereas this genotype combination occurred in only 2 controls (0.15%). Upon further inspection, we discovered that the 2 control women were 73 years of age. Our data suggest, therefore, that the double homozygote may be fully penetrant over the age of 73 and that this combination may account for ~5% of the AD that occurs in women.
Protocadherins
Cadherins are calcium-dependent cell adhesion molecules that play a role in embryonic and tissue development. Protocadherins (PCDHs)
are cadherin-related adhesion molecules with six or seven extracellular cadherin motifs.
Their cytoplasmic domains diverge from each other and from classical cadherins, indicating different binding properties and intracellular functions. The PCDH subfamily consists of ~80 members, with more than 50 of them arranged into PCDHα, PCDHβ and PCDHγ clusters. The variable domains on the PCDHα and PCDHγ are encoded by large exons and encompass most of the transmembrane domain, including a short cytoplasmic tail. The PCDHs derived from these gene clusters are predominantly expressed in the nervous system and localize to synaptic junctions. Functionally connected neurons express different sets of cadherins, thus having distinct effects on segregation of neuronal precursor populations, axonal outgrowth and synapse formation. The large number of distinct PCDHα possibly contributes to the complexity of neuronal connections. PCDHγ proteins were shown to undergo proteolitic processing events. A first cleavage is executed by a metalloprotease activity,
Series Sex Male Hemizygotes Female Heterozygotes Female Homozygotes
Global P
OR (95% CI) P OR (95% CI) P OR (95% CI) P OR (95% CI) P
Stage I
JS 60-80 1.18 (0.73-1.92) 0.50 1.27 (0.79-2.04) 0.33 1.48 (0.94-2.33) 0.09 2.01 (1.19-3.42) 0.009 0.08 RS 60-80 0.82 (0.51-0.32) 0.42 1.22 (0.81-1.86) 0.34 1.17 (0.74-1.85) 0.49 1.61 (0.96-2.71) 0.07 0.06 AUT 60-80 0.89 (0.47-1.68) 0.72 1.39 (0.88-2.20) 0.16 1.71 (0.89-3.30) 0.11 2.48 (1.15-5.36) 0.02 0.01 Stage I combined 0.93 (0.69-1.24) 0.62 1.30 (1.01-1.67) 0.04 1.32 (1.00-1.75) 0.05 1.85 (1.34-2.55) 0.0002 3.2x10⁻⁵
Stage II
JS 80+ 1.28 (0.70-2.33) 0.42 0.96 (0.54-1.70) 0.88 1.6 (0.92-2.76) 0.09 1.41 (0.74-2.69) 0.29 0.54 RS 80+ 0.76 (0.47-1.23) 0.26 1.15 (0.72-1.86) 0.55 1.01 (0.65-1.57) 0.95 2.16 (1.32-3.53) 0.002 2.5x10⁻⁴ AUT 80+ 0.46 (0.21-1.02) 0.06 1.06 (0.54-2.07) 0.86 0.80 (0.38-1.66) 0.55 1.03 (0.43-2.47) 0.94 0.07 NCRAD 60+ 1.09 (0.66-1.80) 0.75 0.97 (0.58-1.61) 0.91 1.19 (0.75-1.89) 0.47 1.69 (0.97-2.93) 0.06 0.35 Stage II combined 0.87 (0.68-1.12) 0.29 1.05 (0.82-1.34) 0.69 1.17 (0.93-1.48) 0.17 1.68 (1.27-2.20) 0.0002 3.9x10⁻⁶ Stage I + II combined 0.84 (0.70-1.02) 0.07 1.17 (0.98-1.39) 0.08 1.22 (1.02-1.45) 0.03 1.72 (1.40-2.12) 0.0001 5.4x10⁻¹³ Table 3 Logistic regression results for rs2573905 comparing male hemizygotes, female heterozygotes and female
homozygotes to the female non-carriers, using male sex as covariate. (Adapted from Carrasquillo et al., 2009)
possibly ADAM10, in between the 18 amino acids from N-terminal to the transmembrane domain, releasing a soluble fragment. This cleavage is required for subsequent regulated γ-secretase processing to generate an unstable but p otent ia l ly act ive ca rb ox yl -ter m i na l fragment that can translocate into the nucleus.
Additionally, various truncated forms and cytoplasmic splice variants were reported for the α-protocadherins, which adds even more degrees of protocadherin diversity. PCDH11X belongs to the non-clustered PCDHs suggested to localize to synaptic junctions and to play a role in cellular signaling.
PCDH11X
PCDH11X is located in the hominid-specific non-pseudoautosomal homologous region Xq21.3/
Yp11.29). PCDH11X and PCDH11Y belong to the protocadherin gene subfamily of the cadherin superfamily of cell surface receptor molecules.
Lopes et al. have proposed that known coding and expression level differences between PCDH11X and PCDH11Y may have functional consequences that could lead to sexually dimorphic traits10). The most recent studies of the PCDH11X/Y gene structure and expression report that these genes consist of at least 17 exons spanning over 700 kb.
Table 4 Distribution of the rs2573905 and APOE genotypes in aff ected and unaff ected females. Cells show the number of subjects with each rs257395/APOE genotype.
Alternative splicing produces multiple isoforms that are mainly expressed in the brain1011). Expression is particularly strong in the cortex and hippocampus and weaker in the cerebellum12). Based on their splicing patterns and functional domains, it has been proposed that PCDH11X/
Y resemble cadherin related neural receptors13)
which are known to localize at the synaptic junction and to play a role in cellular signaling14). In the brain, PCDH11X mRNA is preferentially expressed in the motor (forelimb and hind limb areas) and auditory (temporal) cortices, suggesting a specifi c role in the establishment of selective synaptic connections of specifi c modality in the cerebral cortex with other communicating brain regions such as the thalamus15). Interestingly, some protocadherins are known to undergo presenilin-dependent processing16).
In summary, the results of our two-stage GWAS provide the first evidence that genetic variation in PCDH11X is strongly associated w it h L OA D suscept ibility in a combined American Caucasian sample of 2,391 cases and 2,464 controls. The SNP identified, rs5984894, resides in a haplotype block that falls entirely within PCDH11X, and it is in strong linkage disequilibrium with rs2573905, which is more likely to alter PCDH11X function since it
resides in a conserved region. Further study to determine how risk for LOAD is mediated by specific genetic variation in PCDH11X should improve understanding of the molecular basis of LOAD and open new therapeutic possibilities for this devastating disease.
Acknowledgements
Support for this research was provided by the NIH grants: NIA R01 AG18023 (N.R.G-R, S.G.Y); Mayo Alzheimerʼs Disease Research Center: P50 AG16574 (R.C.P, D.W.D, N.R.G-R, S .G.Y); Mayo Alzheimerʼs Disease Patient Registry: U01 AG06576 (R.C.P); NIA AG25711, AG17216, AG03949 (D.W.D). Samples from the National Cell Repository for Alzheimerʼs Disease
(NCRAD), which receives government support under a cooperative agreement grant (U24 AG21886) awarded by the National Institute on Aging (NIA), were used in this study. We thank contributors, including the Alzheimerʼs Disease Centers who collected samples used in this study, as well as patients and their families, whose help and participation made this work possible.
This project was also generously supported by the Robert and Clarice Smith Postdoctoral Fellowship (M.M.C.); Robert and Clarice Smith and Abigail Van Buren Alzheimerʼs Disease Research Program (R.C.P., D.W.D., N.R.G-R;
S.G.Y) and by the Palumbo Professorship in Alzheimerʼs Disease Research (S.G.Y.).
References
1)Evans, D.A. et al. Prevalence of Alzheimerʼs disease in a community population of older persons. Higher than previously reported. Jama 1989;262:2551-6.
2)Corder, E.H. et al. Gene dose of apolipoprotein E type 4 allele and the risk of Alzheimerʼs disease in late onset families. Science 1993;261:921-3.
3)Corder, E.H. et al. Protective effect of apolipo- protein E type 2 allele for late onset Alzheimer disease. Nat Genet 1994;7:180-4.
4)Farrer, L.A. et al. Eff ects of age, sex, and ethnicity on the association between apolipoprotein E genotype and Alzheimer disease. A meta-analysis.
APOE and Alzheimer Disease Meta Analysis Consortium. Jama 1997;278:1349-56.
5)Gatz, M. et al. Role of genes and environments for explaining Alzheimer disease. Arch Gen Psychiatry 2006;63:168-74.
6)Carrasquillo MM, Zou F, Pankratz VS, Wilcox SL, Ma L, Walker LP, Younkin SG, Younkin CS, Younkin LH, Bisceglio GD, Ertekin-Taner N, Crook JE, Dickson DW, Petersen RC, Graff-Radford NR, Younkin SG. Genetic variation in PCDH11X is associated with susceptibility to late-onset Alzheimerʼs disease. Nat Genet. 2009;41(2):192-8.
7)Purcell, S. et al. PLINK: a tool set for whole- genome association and population-based linkage analyses. Am J Hum Genet 2007;81:559-75.
8)Price, A.L. et al. Principal components analysis corrects for stratification in genome-wide association studies. Nat Genet 2006;38:904-9.
9)Williams, N.A., Close, J.P., Giouzeli, M. & Crow, T.J. Accelerated evolution of Protocadherin11X/
Y: a candidate gene-pair for cerebral asymmetry and language. Am J Med Genet B Neuropsychiatr Genet 2006;141:623-33.
10)Lopes, A.M. et al. Inactivation status of PCDH11X:
sexual dimorphisms in gene expression levels in brain. Hum Genet 2006;119:267-75.
11)Blanco-Arias, P., Sargent, C.A. & Affara, N.A.
Protocadherin X (PCDHX) and Y (PCDHY)
genes; multiple mRNA isoforms encoding variant signal peptides and cytoplasmic domains. Mamm Genome 2004;15:41-52.
12)Durand, C.M. et al. Expression and genetic variability of PCDH11Y, a gene specific to Homo sapiens and candidate for susceptibility to psychiatric disorders. Am J Med Genet B Neuropsychiatr Genet 2006;141:67-70.
13)Blanco, P., Sargent, C.A., Boucher, C.A., Mitchell, M. & Affara, N.A. Conservation of PCDHX in mammals; expression of human X/Y genes predominantly in brain. Mamm Genome 2000;11:
906-14.
14)Senzaki, K., Ogawa, M. & Yagi, T. Proteins of the CNR family are multiple receptors for Reelin. Cell 1999;99:635-47.
15)Kim SY, Chung HS, Sun W, Kim H: Spatiotempo- ral expression pattern of non-clustered protocad- herin family members in the developing rat brain,
Neuroscience 2007;147:996-1021
16)Haas, I.G., Frank, M., Veron, N. & Kemler, R.
Presenilin-dependent processing and nuclear function of gamma-protocadherins. J Biol Chem 2005;280:9313-9.