JAXA Special Publication JAXA-SP-09-008E 48
PSR B1259–63: 15 years of X-ray observations.
Maria Chernyakova1,Andrii Neronov2, Felix Aharonian1,3, Y. Uchiyama4and T. Takahash5,6
1 Dublin Institute for Advanced Studies, Ireland
2 Integral Science Data Centre, Switzerland
3Max Plank Institute fur Kernphysic, Germany
4 SLAC National Accelerator Laboratory, USA
5Institute of Space and Astronautical Science/JAXA, Japan
6 Department of Physics, University of Tokyo, Japan E-mail(MC): masha@cp.dias.ie
Abstract
PSR B1259-63 is a 48 ms radio pulsar in a highly eccentric 3.4 year orbit with a Be star SS 2883.
The 2007 periastron passage was observed in unprecedented details with Suzaku, Swift, XMM-Newton and Chandra missions. We present here the results of this campaign and compare them with previous observations. With these data we are able, for the first time, to study the details of the spectral evolution of the source over a 2 months period of the passage of the pulsar close to the Be star. New data confirm the pre-periastron spectral hardening, with the photon index reaching a value smaller than 1.5. Such a behaviour can be explained within both synchrotron and IC model of the origin of the X-ray emission.
Similarity of the form of rise and decay of the X-ray emission during the two disk passages and its resemblance to the radio lightcurve gives an argument in favour of the IC model.
Key words: pulsars : PSR B1259-63 – X-rays: binaries – X-rays: PSR B1259-63
1. Introduction
PSR B1259–63 is a 48 ms radio pulsar in a highly eccen- tric 3.4 year orbit with a Be star SS 2883. This system is known to be highly variable on an orbital time scale in ra- dio (Johnston et al. 2005, and references therein), X-ray (Chernyakova et al. 2006, and references therein), and TeV (Aharonian et al. 2005) energy ranges. It is likely that the collision of the pulsar wind with the anisotropic wind of the Be star plays a crucial role in the generation of the observed non-thermal emission. The 2007 perias- tron passage discussed below, was observed in unprece- dented details with Suzaku, Swift, XMM-Newton and Chandra missions (Chernyakova et al. 2009, Uchiyama et al. 2009).
2. Results of Observations
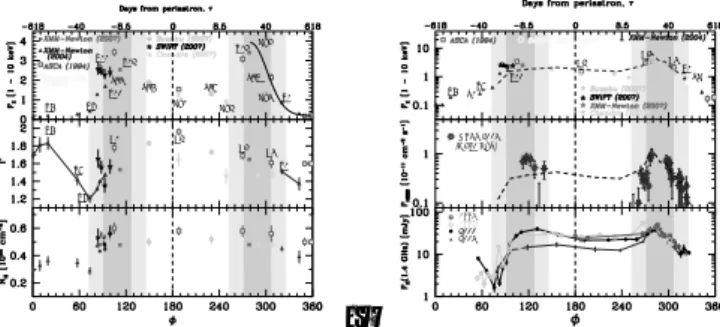
Left panel of Fig. 1 summarizes flux and spectral evolu- tion of PSR B1259–63 in 1-10 keV energy range. The his- torical data ofXMM-Newton(X1 – X10) andBeppoSAX points are taken from Chernyakova et al. 2006, ASCA data are taken from Hirayama et al. 1999. A sim- ple power law model with photoelectrical absorption de- scribes the data well in most observations, with no ev- idence for any line features. Observations Sz3 and Sz4 where fit with simple power law results in inappropri-
X5 X7 X10
X11
Sz4 Sz5 Sz6
Ch1 Ch2
X12
X13Ch3
Ch4 Sz8
X1 X5
X6 X7
A1 A2
A3 A4
X1
0pt
X5 S1X6 X10
A2 A3 A4
X1SC
HESS 2004 (> 380 GeV)
19941997 20002004
Fig. 1. PSR B1259–63 spectral orbital evolution. 1 – 10 keV flux of the source is given in units of 10−11ergs cm−2s−1.
ate high value of the reduced χ2 were studied in detail in Uchiyama et al. 2009. It was found that for these observations broad band (0.6-50 keV) spectrum is much better fitted with a broken power law model with a spec- tral break from Γ1 = 1.25±0.04 below Ebr ∼5 keV to Γ2= 1.6±0.05 above.
From Figure 1 one can see:
• Long-term stability of X-ray orbital modulation
• The evolution of the flux during both disk pas- sages can be approximately described by the fast- rise/slow-decay patterns, with the rise time a factor
This document is provided by JAXA.
The Energetic Cosmos : from Suzaku to ASTRO-H 49
of∼10 shorter than the decay time.
• Similarity of the X-ray and radio light curves during the disk passages. To illustrate this point we plot with a dash line a scaled 2004 radio light curve on a X-ray panel of Figure 1.
• Pre-periastron spectral hardening, with the photon index reaching a value smaller than 1.5 was observed in 2004 just before the sharp flux rise, and in 2007 during a local flux minimum.
It is not clear yet whether the observed X-ray emis- sion from PSR B1259–63 is due to the inverse Comp- ton (IC) (Chernyakova et al. 2006), or synchrotron (Ta- vani& Arons 1997, Khangulyan et al. 2007, Uchiyama et al. 2009) emission. Unfortunately X-ray data alone do not allow us to distinguish between the synchrotron and IC origin of the X-ray emission from the source.
All observed peculiarities of the X-ray spectral evolu- tion could be explained within the frame of each model (Chernyakova et al. 2009). However, the origin of the observed spectral hardening can be readily clarified with the help of the simultaneous TeV observations. If the ob- served X rays have an IC origin, then the observed hard- ening during the drop of the flux is primarly connected to the hardening of electron spectrum below∼10 MeV, so that no tight correlation between the X-ray spectral evolution and the TeV energy band emission is expected.
On the other hand, in the case of synchrotron origin of the observed X-rays, the spectral hardening can be produced if the electron cooling is dominated by the IC energy loss in the Klein-Nishina regime. This implies that the IC flux from the system in the very-high-energy band at the moment of the spectral hardening should dominate over the X-ray flux.
Another clue on the origin of the observed X-rays could be found form the study of the PSR B1259–63 orbital evolution. On Figure 2 one can see that time profile of the two X-ray flares associated with the pulsar passage through the disk looks very similar (right panel), unlike their true anomaly profile (left panel).
This could indicate that X-ray flares can be a result of cooling of the energetic particles injected to the disk during the pulsar passage. Indeed, in this case injected particles will run away with the disk radial velocity vr and their luminosity will decrease as L∼L0/D2 (D is the distance to the Be star). If the density profile of the Be star disk isρ(D)∼ρ0(D/D0)−n, thenvr(D) = ˙D∼ v0(D/D0)n−2. In case n=3 (Connors et al. 2002) this gives L=L0exp
−2Dv0
0∆t
. On right panel of Figure 2 we model data as follows. We assumed a linear rise of the flux for 10 days starting at τ1 = −29,τ2 = 12 and then the subsequent exponential decay withτd= 35 days characteristic decay time. Taking the binary separation
100 150 200 250 300
0 0.5 1 1.5 2 2.5 3 3.5 4 4.5 5
-20 0 20 40 60 80 100 120
0 0.5 1 1.5 2 2.5 3 3.5 4 4.5 5
Fig. 2. Dependence of the PSR B1259-63 flux on orbital phase (left) and time (right).
as a typical distance scale of a problem, D0 ≃2×1013 cm one findsv0=D0/(2τd)∼3×106cm/s. Synchrotron emission of the 10 MeV electrons will in it turn produce the observed radio emission (Connors et al. 2002), which makes natural the observed similarity of the X-ray and radio light curves, see Figure 1.
The similarity of the time profiles of the flares pro- duced by two disk crossings is readily explained within IC model. At the same time, this similarity is inconsis- tent with a model in which the X-ray flux is supposed to be produced via synchrotron emission. from the apex of the bow-shaped contact surface of the pulsar and stel- lar wind Tavani&Arons 1997. Indeed, in this case the synchrotron cooling time of the X-ray emitting electrons is much shorter than the decay time of the flare and the time profile of the flare is determined mostly by the evolution of the distance of the apex point from the pul- sar. Decrease of this distance during the pulsar passage through the disk leads to the increase of the magnetic field at the apex and, as a result, increase of the syn- chrotron flux from the system. The distance of the apex of the contact surface from the pulsar is a function of the pressure of the stellar wind which is, in turn, a func- tion of (θ−θd,1,2) whereθd,1, θd,2 =θd,1+ 180 are the phases of the two disk crossings. One expects that the light curves of the flares corresponding to the two disk passages,F1,2(θ) would be nearly symmetric around the phasesθd,1,2. The left panel of Fig. 2 shows that this is clearly not the case for the first disk crossing.
References
Aharonian F.A. et al. 2005 A&A, 442,1
Chernyakova M. et al. 2006 MNRAS, 367, 1201 Chernyakova M. et al. 2009 MNRAS, 397, 2123 Connors T.W. et al. 2002 MNRAS, 336, 1201 Johnston S. et al. 2005 MNRAS, 358, 1069 Hirayama M. et al. 1999 ApJ, 521, 718 Khangulyan D. et al. 2007 MNRAS, 380, 320 Tavani M., Arons J. 1997 ApJ, , 477, 439 Uchiyama Y. et al. 2009 ApJ, 698, 911
This document is provided by JAXA.