Distribution of Quaternary Fold, especially Rate and Axis Direction in Japan
Sohei KAIZUKA
INTRODUCTION
As a member of the Research Group for the Quaternary Tectonic Map of Japan
(Q.T.M.J.), the author has been engaged in collecting information on Quaternary foldings in Japan・The group has published a prelimina士y and the second reports on the Quaternary Tectonic Map of Japan, in which the distribution of the Quaternary fold axes was included(Hatori et a1.,1964; Kaizuka et a1.,1966). The group is now preparing the final Quatemary Tectonic Map of Japan(scale,1:2,000,000)・
Through the preparation of the above publications, the author found a relation between the rate and wave−1ength of fold as presented in a previous number of this publication(Kaizuka,1967), and some regiollal characteristics of the Quaternary folds in Japan were noted, which will be presented in the following Pages・
This work was based on the reference cards for Quaternary crustal move−
ments in Japan, which were abstracted from periodicals and books by the members ofQ.T.M.J.
REGIONAL DIsTRIBuTIoN oF THE QUATERNARY FoLDS
1
The term Quaternary fold used in this paper means the fold that is revealed by the folded structure of the Pleistocene or UpPer Pliocene sedirnentary beds, or by the folded Pleistocene terrace surfaces. This term does not include the present foldings recognized by re−leveling of bench marks. Generally, the Holocene folds are too weakly deformed to determine by ordinary geological and geomorphological methods. Therefore, the following discussion will not dea1 with Holocene iolds.
The dimension of the Quatemary folds in this paper is from O・5 to 30 km in wave−
length. Those of more than 30 km are treated as warping in Q・T・M・J・,and are expressed by isoPleths of upheaval and subsidence・ On the other hand, those of less than O.5km have not been drawn on usual geological maps, thus, they are neglected in Q.T.M.J.qnd the present paper.
Distribution of Anticlinal Axes
Fig. l shows the distribution of the anticlinal axes of the above defined Quater−
nary folds in Japan. The Quaternary folds are distributed densely in northeastern Japan, especially along the Japan sea coast of Tohoku, while they are sparse・in south−
western Japan. When this map is compared with the map showing the distribution of Neogene and Pleistocene deposits(Fig.4), it must be evident that the distribution of Quaternary folds coincides well with the distribution of Neogene and Pleistocene
12ぎ 132 t36 14cr 144 9° 1
9
44°
!
.1
ヒ』 ャ・ 書 喪 」
9
翌
〃
40 麗
、幽 δ
多
凶 〃 冨ト
§す
36 o 関
ノ
32°
ダ o o/ 9
o 桐ρ !°
@ ぺ奪諺
@趨紗
ゐ / o@尺 砺θ4町τ
掾C 二望霧§ う
魁
○ノ o
1300km
132° 136° 140° 144噂
1. Fig・1 Distribution Qf anticlinal axes of Quaternary folds in Japan
44
4ぴ
36
32
This coincidence partly on the reason that a great number of Quaternary folds in Fig.1were derived from the folded structure of the upper Pliocene and Pleisto−
cene strata. About one third of the folded axes in Fig.1, however, were discovered from deformed marine and fluvial terrace surfaces. Therefore, the coincidence depends not only upon a superficial accordance between the distribution of the source material and that of the derived evidence from the same source, but also upon an essential reason, i.e., on the younger and mqre deformable rocks such as the Neogene−Pleistocene deposits, folding occurs easier than on older and more rigid rocks. This will also be supported血the latter part of this paper from other evi−
dences.
Relation Between Rate and Wave−Length
The mean rate of folding is calculated by dividing G by T, where T is time duration from the age of the folded terrace surface or folded stratum to the present;
Gis gradient of fold. The gradient(G)is obtained from either of two equations:
G・オ.・rG・・an x, where H i・wav・・h・ight;L・wave−1・ng・h;x・・ngl・・f slope at a limb of the fold。
The relationship between thus obtained G/T and L is shown in Fig。2. ThiS
・噴脇
1000
500
oo
50
10
@ 5
]OZくエQ
1
oち〜
凶か
A 5 F。蕊
詩6
7轟・
●「nF ゑ
露 OF ● △F
十 F一
十
「 F
や
o
◇十
8
甑.
◇ X o ・
<卜◇ ◇
棄 × ▲
▲
● A1 o △ △
O A2 ▲ ▲
◇A3
◇A4 △
十 B
× G
▲ D
△ E
.1
0.5 5 10 50 100km
WA, VE −LENGTH(L)
Fig・2 Relatio亘between change of gradient or change of wave−
height and wave−lellgth of Quaternary fold in Japan A1: Niigata Area B: South Fossa−Magna A2: Uetsu Area C: East Hokkaido A3: Ishikari Area D: Kanto Area A4: Toyama Area E: Kinki Area
diagram is essentially similar to the previously presented correlation diagram for some Japanese and foreign foldings(Kaizuka,1967)・Both diagrams indicate that the shorter the wave−length, the more rapid the rate of folding, and also indicate that increase of wave−height without remarkable fault seems to have an upper limit,
about 2 mm/year.
Fig.2also shows that the change of gradient is moStly less than 10−6/year.
This value iβmuch the same with the accumulating ratio of horizontal shear strain,
calculated ffom re−trianguiation data in the past 50−60 years in ce且tral and south−
western Japan(Kasahara and sugimura,1964). In Fig.2, however, there exist a rapid rat・・f f・1ding, m・re than lO−6/year in Niig・ta area.
Geographical Distribution of the Rate
Fig.3shows the distribution of the value G/T. Hereby, the regional difference
}2ぽ 132° 136・ }4σ 14ず 口O o
。航
449
CHANGE OF GRADIENT
@ (Xl(ウY)
潤@<10
A3
3
@ /・義 /c. ㎡
● 10−20 モ 20・−50
、命゜
◇ 50−100 σ \
◎100−300
19
40°
●
●
4〔ナ 1
A2
「
◆・1 多
1
!
ノ/!
・・,・呪シ・
36°
3ざ !
@1m D
一、、魂 o
冴 、 艦
ダ 1 o
o
ノ●
3才 32°
○! 0 300km
B2 136° }40° 144°
Fig・3 Distribution of the rate(G/T)of Quaternary fold血g in Japan
of the rate of folding is evident, even though the calculation of G/T is only tし湛ative
(Kaizuka,1967). Based on this fact and also on the regional difference of axis−
direction(Fig.1), and wave−length(Fig.2), the author will attempt to classify the Quaternary folding areas in Japan・
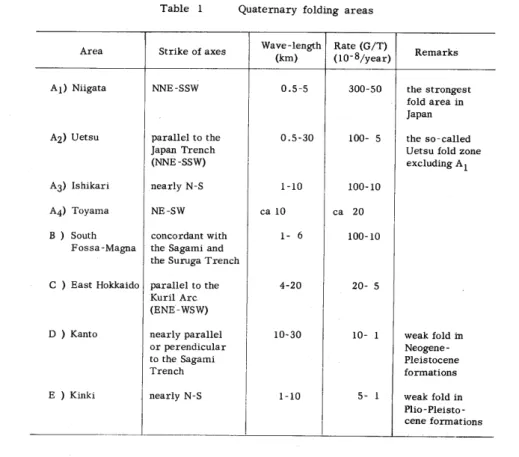
Quate皿ary Folding Areas
A・indi・at・d in Fig.3, th・f・11・wing area・are classifi・d p・・vi・i・nally(T・b1・1)・
A3 and A4 are ・ubdivi・i・n・f a nearly・・ntinu・us f°1d z°ne・
The areas, A1・A2・
1,hikari−U。t・u−T・yama z・n・, in whi・h th・directi・n・・f f・1d・ax・・are c・n・・rdant with the direction of the Northern Japan Arc・
In Fig.2, each fold is given by a symbol of each fold area.
DISCUSSIONS ON THE FORMATION OF THE QuATERNARY FOLDINGS
Relation Between the Rate of Folding and the Thickness of the Neogene−Pleistocene Sedi耳1entary Rocks.
ln a previous report, the author notes that the Quaternary foldings having
Table 1 Quaternary folding areas
Area Strike of axes Wave−1ength
@ (km)
Rate(G/T)
i10}8/year) Remarks
A1)Niigata NNE−SSW 0.5−5 300−50 the stro聡gest
fold area in Japan A2)Uetsu parallel to the 0.5−30 100−5 the so−called
Japan Trench Uetsu fold zone
(NNE−SSW) eXcluding A1
A3)Ishikari nearly N−S 1−10 100−10
A4)Toyama NE−SW ca lO ca 20
B)South concordant with 1−6 100−10 Fossa−Magna the Sagami and
the Suruga Trench
C)East Hokkaido parallel to the 4−20 20−5 Kuril Arc
(ENE−WSW)
D)Kanto nearly paralle1 10−30 10−1 weak fold tn
or perendicular Neogene一
to the Sagami Pleistocene
Trench formations
E)Kinki nearly N−S 1−10 5−1 weak fold in Plio−Pleisto。
cene formations
sh・rter wave−1・ngth・and greater rat・・were f・rm・d・n thi・k N・・9・n・・r N・・9・ne−
P1・i・t・cen・f・rmati・n・, whi1・th・se having 1・nger wave−1・ngth・and・maller rat。。
were on older and more rigid rocks than Neogene formations(Kaizuka,1967). This regularity may also be found in comparing Fig.3and Fig.4, ih which the thickness
°fN・・9・ne−Pl・i・t・cen・f・rmati・n・is c・mpi1・d by K・chinzei in 1968. Quantitativ・ly,
af・ld・f m・re than 5 x lO−7/year in rat・i・g・nerally・d・termin・d if th・N・・9・ne−
Pleistocene thickness is more than 4 km. The exceptions are the Kanto Area and the northern Ishikari Area, where the Neogene−Pleistocene seems to be too thick for such small rates of folding.
A・main fact・r・c・nt・・11ing the rat・・f f・lding, th・f・ll・wing tw・m・y b・
counted: one is the nature of rocks for tectonic stress, the other is the state of tect°nic stress『fi・1d in the cru・t・The ab・v・m・nti・ned thi・kness・f N・・9・ne−
Plai・t・cen・d・p・・it・are c・ncern・d with th・n・ture・f the r・ck・. Whi1・, a, f。r th。
state of stress−field, information on the direction of maximum compressive stress in th・Q璽aternarγand th・pre・ent hav・been increa・ed recently in Japan.
Relation Between the Direction of Quaternary Fold−Axis and that of − Compressive Stress being Active in the Quaternary and the Present血 the Crust of the Japanese Islands
F・・mf・cal mechani・m,・ei・m・1・gi・t・have ext・n・ively・xamin・d the axi。。f maxlmum compressive stres s(e.g.Honda,°1960;Ichikawa,1965). Fig.5shows
Fig・4
!彪
霧
Thickness contours of the Neogene and Pleistocene formation in Japan(compiled by K. Chinzei,1968).
Contour interval: 2km
Oblique lines: nothing or very thin layer of the Neogene−
Pleistocene deposits
axes of maximum compressive stresses at the origins of very shallow earthquakes
(earthquak・・in the cru・t)in 1927−1966(H・nd・,・t・1・,1967)・lt w・・kn・wn th・t th・
axes were nearly horizonta1. As shown in Fig.5, the distribution of the maximum
。・mpressive axi・di・6・ti・n i・m・・tly・y・t・mati・, and nearly perpendicular t・th・
trend of Honshu in northeastern Japan, and nearly parallel to the tre耳d of south−
w・・tern J・p・n,・xcept in th・s・uth F・ssa−M・gna,…und shik・ku l・1and and th・Kii Peninsula. Comparing Fig.5with Fig.1,it is obvious that there exists a close relati・n・hip b・tween th・directi・n・・f th・f・ld−axes and th・・tres、s sy・t・m d・tect・d from very shallow earthquakes. That・is, the pressure direction is alrnost perpen−
dicular to the direction of the Quaternary fold−axis, even in the above mentioned exceptional regions of the South Fossa−Magna and Shikoku−Kii.
The distribution of maximum compressive stress in the Quaternary was dis−
closed by Matsuda and Sugir、・ura from the studies of conjugate sets of strike−slip faults in central Japan(Fig.6, reproduction from Matsuda,1967)・This tendency
。f。。mpressiv・・tress directi・n i・in acc・rd with that・f central J・pan in Fig・5・
Furthermore, Kasahara and Sugimura(1964)pointed out that the direction of the minimum principal axis of strain些n western Japan, which was calculated from re−
triangulation data 6f the past 50−60.years, is generally in accord with the compres−
132° 136° 140° 144°
44°
獣
蟻
40°
R6°
P「
R2°
多
oo
一 一 黶@ 9、
@ 。。・ 嗣4 \
\
0 300km
Fig・5
132° 136° 140° 144°
Distribution of the directiQn of rnaximum compressive stress disclosed by focal mechanism of very shallow earthquakes during the period from 1927 to 1966(after Honda et al.,1967)
44°
40°
36°
32°
Thμs, the above mentioned four independent evidences, i.e., state of stress analyzed from present earthquakes and triangulations, Quaternary faults and folds,
1ead us to the conclusion that the Quatemary foldings in Japan seem to be a product of the stress system having been active during the Quaternary and even in the present・
SUMMARY AND CONCLUSIONS
The geographical distributions of the anticlinal axis and rate of Quaternary fold in Japan are presented in Fig・1and.3 respectively・ Eight Quaternary fold areas of Japan are classified based upon axis direction, wave−length, and the rate of folding.
The directions of the fold axes are generally perpendicular to the direction of−maxi−
mum compressive stress detected from the recent earthquakes and Quaternary strike−
slip faults. Comparing Fig.4with Fig.5, the close relationship between rate of QuaterIlary folding and thickness of the Neogene−Pleistocene sedimentary rocks is evident. This suggests that the rate of folding may somewhat depend upon the thick−
ness of weakly consolidated sediments.
Fig・6
、
Distribution of direction of maximum compressive stress estimated frQm active strike−slip faults(after Matsuda,
1967)
Light dotted line: active strike−slip fault Heavy solid l血e: local direction of maximum compresslve stress
Heavy broken lille: general direction Qf maximum compresslve stress
ACKNOWLEDGEMENTS
The author wishes to express his thanks to the Q.T.M.J. members for their help and advice, especially to DL A. Sugimura for reading the manuscript. He is also indebted to Dr. K,Ch血zei of the Geologigal lnstitute, the University of Tokyo,
for his preparation of an original map, which is reproduced as Fig.4.
REFERENCES CITED
Hatori, K., Kaizuka, S., Naruse, Y., Ota, Y.,Sugimura, A. and Yoshikawa, T.,
1965: Quaternary tectonic map of Japan(a preliminary note).
Jour. Geodet. soc.Japan, vol. lo, P.111−115.
Honda, H.,1960: The generation of seismic waves. Pub. Dom血ion Obs.,
Ottawa, vo1.24, p.329−334.
Honda, H., Masatsuka, A. and Ichikawa, M.,1967:Mechanism of earthquakes and stresses producing them in Japan and its vicinity(third paper)・Geophys・
Mag.,vo1.33, p.271−279.
Ichikawa, M.,1965:The mechanism of earthquakes occurrtng in central and so血thwestern Japan, and some related problems. Papers in Meteorol.and Geophys.,vol.16, P.104 − 156.
Kaizuka, s. 1967: Rate of folding j血the Quaternary and the present・Geogr・Rep・
Tokyo Metrop.Univ.,vo1.2, p.1−10.
,Sugimura, A.,Ota, Y., Naruse, Y., Yoshikawa, T. and Hatori, K.,1967:
Quaternary tectonic map of Japan(the second report). Ouaternaria, vo1。8,
p.289−295.
Kasahara, K. and Sugimura, A.,1964: Spatial distribution of horizontal secular
Mat。u二享a思n襟n嶋1。審雅轟譜nl認 s盤三m鷲1颪゜v。1.2。,
no.4, P.230−235. (in Japanese). 〆
■
■
一9一