エネルギー科学研究科
エネルギー社会・環境科学専攻修士論文
題目:
A Proposal and Evaluation of Presentation
Methods on AR-based Support System
for Decommissioning of Nuclear Power Plants
指導教員:
Prof. Hiroshi Shimoda
氏名:
Yongxin Wang
Abstract
Title: A Proposal and Evaluation of Presentation Methods on AR-based Support
System for Decommissioning of Nuclear Power Plants
(AR を用いた原子力プラント解体作業支援システムの情報提示手法の提案と評価)
Shimoda Laboratory, Yongxin Wang
Abstract:
As many existing nuclear power plants reach their service life, it is necessary to do the decommissioning work safe and efficiently. Augmented Reality (AR) is a very effective and useful interface design concept for presenting augmented objects. In the previous study, an AR-based support system for decommissioning work of nuclear power plants has been developed which can detect whether a collision between a dismantling target object and the surroundings happens or not. However due to the dismantled facility itself and the limited activity area, it is difficult for the workers to understand the situation between the target object and the surroundings.
In this research, three presentation methods are proposed which can present distance and location information between the target object and the surroundings clearly even if there is occlusion problem occurred between them. The first method is Transparent Model and Pointing Line Method (Line Method), in which transparency of the target object and thickness of the pointing line, used to point the endpoints of the distance were changed to present distance and location information. The second method is Grids Model Method (Grids Method), in which additional grids are used to show the shape of the target object and the surroundings. The size of the grids used to present pointing position changes with time passing. These changeable grids may lead to a quick attention of workers on pointing area. The last method is Model Rotation and Shift Method (Moving Method), in which the target object is forcibly rotated and shifted from original location so that pointing position becomes visible without hiding its surroundings. In the first stage of evaluation, to find out a best parameter pattern in each presentation method, three presentation methods with different parameters were evaluated by 4 evaluators who scored the difficulty of understanding the location of the pointing position. Also the accuracy of pointing position understood by evaluators were evaluated. In the second stage of evaluation, best-performed parameter patterns were compared. Finally, the Moving Method got highest evaluation totally, and the Line Method were scored for a high performance in subjective assessment. Although the comparison result shows a best-performed presentation method in simulation eval-uation work, other new presentation methods and parameter patterns are the future work.
Contents
Chapter 1 Introduction 1
Chapter 2 Background and Purpose of This Research 4
2.1 Existing Decommissioning Support System . . . 4
2.2 Existing Presentation Methods . . . 6
2.3 Purpose of This Research . . . 8
Chapter 3 Proposal of Presentation Methods 10 3.1 Issues in Decommissioning Work using AR-based Support System . . . 10
3.2 Overview of The Presentation Methods . . . 12
3.3 Proposal of Transparent Model and Pointing Line Method . . . 14
3.4 Proposal of Grids Model Method . . . 16
3.5 Proposal of Model Rotation and Shift Method . . . 17
Chapter 4 Evaluation of Presentation Methods 22 4.1 Purpose of The Evaluation . . . 22
4.2 Overview of The Evaluation Method . . . 22
4.3 Environment used for The Evaluation . . . 24
4.3.1 Evaluation Environment and Devices . . . 24
4.3.2 Environment Model Reconstruction . . . 28
4.4 Evaluation of Transparent Model and Pointing Line Method . . . 30
4.4.1 Purpose of Evaluation . . . 30
4.4.2 Details of Evaluation . . . 30
4.4.3 Results of Evaluation . . . 35
4.5 Evaluation of Grids Model Method . . . 39
4.5.1 Purpose of Evaluation . . . 39
4.5.2 Details of Evaluation . . . 40
4.6 Evaluation of Model Rotation and Shift Method . . . 48
4.6.1 Purpose of Evaluation . . . 48
4.6.2 Details of Evaluation . . . 48
4.6.3 Results of Evaluation . . . 50
4.7 Summary of The First Stage Evaluation . . . 55
4.8 Comparison of Proposed Presentation Methods . . . 55
4.8.1 Purpose of Comparison Evaluation . . . 55
4.8.2 Details of Comparison Evaluation . . . 57
4.8.3 Results of Comparison Evaluation . . . 57
Chapter 5 Conclusion 62
Acknowledgement 63
Bibliography 64
Appendix A Tracking using Markers 67
Appendix B Details of First Stage of Evaluation 71
Appendix C Questionnaire in Transparent Model and Pointing Line Method 74
Appendix D Questionnaire in Grids Model Method 82
Appendix E Questionnaire in Model Rotation and Shift Method 90
List of Figures
2.1 Screen shot of the AR-based support system (collision area is shown in
red) developed by Aoyama [10] . . . 6
2.2 Supporting annotations for distance and location information [12] . . . 7
2.3 Labeling used in image-based approach [13] . . . 7
2.4 Consistently modulating lightness of occluder [14] . . . 8
3.1 A removing process in decommissioning work . . . 11
3.2 Side view of dismantled facility and real-world environment . . . 13
3.3 Concept of information presentation method using a Transparent Model and Pointing Line Method (Line Method) . . . 15
3.4 An example of wire frame of the target object . . . 16
3.5 Concept of information presentation method using a Grids Model Method (Grids Method) . . . 18
3.6 An example of additional cube grids in the target object . . . 19
3.7 Concept of information presentation method using a Model Rotation and Shift Method (Moving Method) . . . 20
3.8 The relation between the target object and image plane . . . 21
4.1 Flow of two stages of the evaluation . . . 23
4.2 Flow of the first stage of evaluation experiment . . . 24
4.3 Flow of the second stage of evaluation experiment . . . 25
4.4 Top view of evaluation environment . . . 25
4.5 Simulation environment of carrying decommission . . . 26
4.6 Markers arranged in real-world environment . . . 27
4.7 Measuring result of markers arrangement . . . 27
4.8 Tablet PC used for presentation methods evaluation . . . 28
4.9 Appearance of RGB-D camera used for scanning environment . . . 29
4.11 Protocol of evaluation of the Line Method . . . 31
4.12 Real-world environment picture for participants to write pointing position 32 4.13 The target object picture for participants to write pointing position . . 32
4.14 Screen shot example of four parameter patterns in Line Method evaluation 34 4.15 Means and standard deviations of scores for subjective questions in Line Method . . . 36
4.16 Pointing position wrote by participants on the real-world environment . 37 4.17 Pointing position wrote by participants on the target object . . . 38
4.18 True pointing position on the target object . . . 39
4.19 Means and standard deviations of average error of presented pointing position in Line Method . . . 40
4.20 Protocol of evaluation of Grids Method . . . 42
4.21 Screen shot example of four parameter patterns in Grids Method evalu-ation . . . 43
4.22 Means and standard deviations of scores for subjective questions in Grids Method . . . 44
4.23 Means and standard deviations of distance error of presented pointing position in Grids Method . . . 46
4.24 Protocol of evaluation of Moving Method . . . 49
4.25 Screen shot example of four parameter patterns in Moving Method eval-uation . . . 51
4.26 Means and standard deviations of scores for subjective questions in Mov-ing Method . . . 52
4.27 Means and standard deviations of distance error of presented pointing position in Moving Method . . . 53
4.28 Protocol of comparison evaluation . . . 56
4.29 Means and standard deviations of scores for subjective questions . . . . 59
4.30 Means and standard deviations of distance error of presented pointing position at environment and the target object . . . 60
A.1 Setup of world coordinate . . . 67
A.2 Laser range finder and camera connected with computer . . . 68
A.4 Laser range finder used for marker measurement . . . 69 A.5 Computer used for marker measurement . . . 70
List of Tables
3.1 Possible methods used to deal with the occlusion problem . . . 14
4.1 IDE and libraries used for developing AR-based support system . . . . 28
4.2 Specification of tablet PC used for presentation methods evaluation . . 28
4.3 Technical specification of Xtion Pro Live . . . 29
4.4 7-Level likert scale and corresponding numeric scores . . . 33
4.5 Parameter patterns used in Transparent Model and Pointing Line Method 34 4.6 Scores on subjective questions in Line Method . . . 41
4.7 Parameter patterns used in Grids Model Method . . . 42
4.8 Scores on subjective questions in Grids Method . . . 47
4.9 Parameter patterns used in Model Rotation and Shift Method . . . 50
4.10 Scores on subjective questions in Moving Method . . . 54
4.11 Best parameter pattern in each presentation method . . . 55
4.12 Order of presentation method in comparison evaluation . . . 58
4.13 Scores on subjective questions in comparison evaluation . . . 61
A.1 Specification of camera used for marker measurement . . . 68
A.2 Specification of laser range finder used for marker measurement . . . . 70
Chapter 1 Introduction
Human beings are constantly making more environmental, green and recyclable en-ergy to be used in daily life as electricity, transportation, logistics and so on. However being limited by existing technologies, no other kind of energy performs more pow-erfully and efficiently than nuclear energy. Developed countries like France [1] and Japan [2] started using nuclear power energy as one of their main energies, having rich experiences of operating nuclear power plants. At the same time many developing countries attempt to construct nuclear power plants to substitute traditional thermal power plants. Although nuclear energy is a potential energy in the future, operating nuclear power plants requires high-level technologies in safety maintenance. Once ma-chines or parts in nuclear power plants reach their service life, it becomes necessary to remove them. There are over 100 mines, 90 power reactors, 250 research facilities and many other facilities have been, or are being, decommissioned successfully world-wide [3]. These successful decommissioning works are very important experience for workers and researchers concentrating on improving the safety and efficiency of decom-missioning work, because they provide useful methods of solving problems occurred during decommissioning work. Decommissioning work of nuclear power plants involves dismantling nuclear reactors and plant itself, which is followed by this list.
1. Removing radioactive materials and wastes
2. Cleaning up whole site
3. Protecting the surrounding environment from potentially harmful radioactive ma-terials
Internal environment in nuclear power plant is very complicated so that the decom-missioning work indoor is limited by its narrow space and complex surroundings. Even the nuclear power plant has been stopped operating, there are still some machines or parts working for maintaining. After a facility was dismantled, it will be moved to a
collision with the surroundings during the movement, especially a large-scale object. A real-time location relationship between the target object and the surroundings is nec-essary for workers carrying dismantled facility, when moving through a narrow space or dangerous space.
Augmented Reality (AR) is a very effective and useful interface design concept which has been rapidly promoted in recent years [4]. There have been many AR-based systems created for various fields, such as medical treatment [5], maintenance work [6], outdoor navigation [7] and so on. AR-based support systems for decommissioning work of nuclear power plant have been developed [8]. Fugen Decommissioning Engineering Center (Fugen) [9] turned it into a research center for decommissioning work of nuclear power plant in 2003, after the main reactor stopped operating. Now several types of decommissioning work and safety tests are being conducted there. Amongst researches in Fugen, an AR-based support system which can increase efficiency and improve safety is developed [10]. Augmented objects and information can be displayed over the image of real-world environment using AR technology. This AR-based support system can detect whether a collision between the target object and its surroundings happens or not. If it happens, collision area turns red. However, it can not present information clearly when an occlusion problem between the target object and its surroundings occurred. Occlusion problem is that when a virtual object supposes to occlude real objects, it may cause confusion in workers’ perception [11]. As it is not allowed for workers to move freely during decommissioning work, it is difficult to understand the situation between the target object and the surroundings.
In this research, to present information more legibly, presentation methods are pro-posed to solve the unclear distance presentation when occlusion between the target ob-ject and its surroundings occurs. After an AR-system installed with the proposed pre-sentation methods, evaluations were conducted to evaluate which prepre-sentation method performed the best during the simulated decommissioning work.
This thesis consists of 5 chapters including this introduction chapter. In chapter 2, the background and purpose of this research is introduced, and existing AR-based support systems are discussed. In chapter 3, three presentation methods are proposed, which can present distance and location information between the target object and its surroundings even occlusion occurred. In chapter 4, evaluation of presentation methods
mentioned in chapter 3 are discussed. Conclusion and future works will be mentioned in chapter 5.
Chapter 2 Background and Purpose of
This Research
In this chapter, an existing AR-based support system for decommissioning work of nuclear power plants and the existing methods of information presentation are intro-duced. After the issues in the existing systems were explained, the purpose of this research is introduced.
2.1
Existing Decommissioning Support System
Advanced thermal reactor in Fugen, was commissioned in March 1979 and was stopped service in March 2003. After the main reactor stopped operating, Fugen was turned into a research center for decommissioning work of nuclear power plants. Amongst the researches being conducted are the safe removal of radioactive materials left behind from decommissioning works and the improving the safety and security of decommissioning exercise [9]. Decommissioning work of nuclear power plants is a difficult and technical process. Different from traditional thermal power plants, decom-missioning work in nuclear power plants includes clean-up of radioactive materials and further demolition of machines in the plants. When radioactive materials or elements decayed to stable elements, main components remained in the plants, including the re-actor vessel, fuel pools and others, are removed from the plants. In order to reduce the harm to workers of decommissioning works and other people by radioactive materials, a strict and safe plan is necessary before actual decommissioning work can commence. When workers are carrying dismantled facilities to a narrow space or the surroundings are complicated, a problem is that workers sometimes can not know the situation between carrying target objects and the surroundings. This situation is dangerous because an accident may occur. On the side, when a large-scale object is being carried via a narrow space, knowing if it will collide with the surroundings is useful to workers. However, workers are confused with location relationship between the target object
and the surroundings during carrying work. The distance and location information between the target object and the surroundings, is difficult to know. Invisible side between the target object and the surroundings is a common problem, also known as occlusion problem, in computer visual field.
Aimed at making a plan of a safe decommissioning work of nuclear power plants, a research about AR-based support system which can simulate decommissioning work in nuclear power plants was done by Aoyama [10]. In the research, a simulation of decommissioning work can be experienced, in which target objects were presented as CG model which presented on the real-world environment. Fig.2.1 shows an exam-ple of screen shot of AR-based support system developed by Aoyama. During the simulation, workers can move the CG model on a tablet PC installed with AR-based support system, and know the location relationship between the target object and the surroundings. When the target object collided with the surrounding, collision area turned red. It can be used in the preparation step of planning decommissioning work. For example, while carrying one dismantled target object via a narrow space, workers can use this system to verify is there enough space for the target object to pass safety. During the process of moving facility, location relationship between the target ob-ject and the surroundings is an important information for workers. However, when the target object come in front of environment, the existing decommissioning support systems does not present among facilities clearly. The reason why it is difficult to know the situation between the target object and the surroundings is that the target object itself hides the surroundings. When this kind of occlusion problem occurred, the information such as with which the target object may collide is difficult to be presented. Moving around and viewing the target object from another location is a normal method. However, moving around a large-scale target object wastes time. And due to the complex environment inside nuclear power plant, it may not allowed to move freely. A presentation method is useful during decommissioning work, which can present distance and location information clearly without workers’ moving to another place, even if occlusion problem occurs between the target object and its surroundings.
The surroundings
Marker used for tracking
CG model presented as
the target object
Collision area between the target
object and its surroundings
Figure 2.1: Screen shot of the AR-based support system (collision area is shown in red) developed by Aoyama [10]
2.2
Existing Presentation Methods
In order to present distance or location information by AR, many researches have been done. Leutert [12] proposed an AR interface to directly and intuitively visualize complex information. In this research, AR support function is used to present distances between workpiece and robot. Fig.2.2 is an example of the supporting system in which several colored lines and numbers are being used for presenting distance and location information. Although it shows distance between workpiece and robot clearly from side, workpiece is a small target object so that occlusion between workpiece and the robot occurs rarely. Therefore, the information presentation method when occlusion occurs was not mentioned in this research.
Raphael.G [13] introduced a novel view management technique for placing labels in AR systems. Fig.2.3 is an example of labeling on real environment by their approach. To solve the common issue in AR systems that limiting the efficient representation
Figure 2.2: Supporting annotations for distance and location information [12]
and optimal layout of the augmented information on the real world, they discussed an adaptive representation method. Leader lines of each label is modified in lightness with the surroundings so that labels can be distinguished from the surroundings. How-ever, the relative location relationship among objects where occlusion occurs was not mentioned in this research.
lows viewer to explore hidden structure within the real-world environment [14]. Fig.2.4 shows the objects after ghosted view with consistently modulating lightness of occluder. They consider the information of the scene before and after shown in ghosted view, and calculate adjustment of preserved occluding features to enhance the depth per-ception. It allows workers to see not only preserve features, but also to see features after ghosted view. This presentation method allows participants to know the shape of objects occluding the surroundings, however the relative location relationship can not be presented clearly in it.
Figure 2.4: Consistently modulating lightness of occluder [14]
2.3
Purpose of This Research
The purpose of this research is to find out a well-performed presentation method during decommissioning work in nuclear power plants, which can present augmented information such as distance and location information between the target object and the surroundings clearly even if there is occlusion between the target object and the surroundings.
In order to find out a well-performed presentation method, three presentation meth-ods were proposed and evaluated by subjective evaluations where participants scored on each presentation method. Several parameter patterns in each proposed
presenta-tion method were being set to a evaluapresenta-tion test to find out which parameter patterns performed best in each presentation method. After a best-performed parameter pattern in each presentation method being achieved, a comparison among three best-performed methods was conducted.
By proposed presentation method, an AR-based support system which can make the decommissioning work in nuclear power plants more effectively and safely, is expected to be developed. Additionally the occlusion problem is a common question while using AR application, this research can be adopted not only in nuclear power plants but also in many other fields.
Chapter 3 Proposal of Presentation
Methods
In this chapter, issues in decommissioning work using AR-based support system is introduced first. Then presentation methods are explained, which can present distance and location information between the target object and its surroundings even occlusion occurred. Then the details of each presentation method are explained in three aspects: details of design, advantages and disadvantages.
3.1
Issues in Decommissioning Work using AR-based
Support System
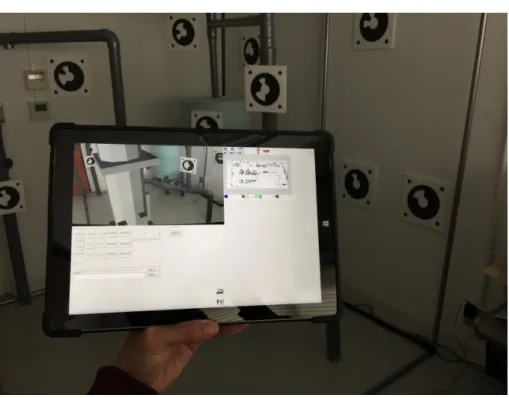
In chapter 2, existing AR-based support systems and presentation methods have been discussed. Unfortunately, some realistic problems are still remaining in the AR-based support systems for decommissioning work. Fig.3.1 shows a dismantling process in decommissioning work using AR technology. A worker is using a tablet PC installed with an AR-based support system for simulation of a dismantling work. The target ob-ject shown in orange, is being set on a trolley. The trolley carrying dismantled facility will be moved via a passage surrounded with other facilities in the real-world environ-ment. The blue arc angle represents the view angle of the camera suited on tablet PC. One function of this AR-based support system is that the location relationship between dismantled facility and real-world environment can be presented so that the workers can know whether the dismantled facility is being collision with other facilities in the surroundings during the moving process.
View Angle
of Camera on
Tablet PC
The Real-world
Environment
A Trolley carrying
Dismantled Facility
The Real-world EnvironmentWorker using
AR-based
Support System
Pointing Positionsbetween Dismantled Facility and
Real-world Environment
The Real-world Environment
Pointing Positions between Dismantled Facility and
Real-world Environment Occlusion does not happen Occlusion happened
However, the trolley comes into the view angle of camera, some parts of facilities in the surroundings were hidden by the dismantled facility carried on trolley like ”Occlu-sion happened” shown in Fig.3.1. If the workers move to another side of dismantled facility, invisible location relationship of dismantled facility and the surroundings can be seen clear as shown in Fig.3.2. However, being limited to the narrow space of nuclear power plant and other irresistible situation, it is not allowed for the workers to move freely in the decommissioning work area. Making the target object into transparency is a candidate method to present occlusion area between the target object and its sur-roundings. However, it is difficult for workers to understand back side of the target object due to the influence of the target object itself. To reduce the influence from the target object itself, methods that visualize the unreadable area between the target object and the surroundings are proposed in this research.
3.2
Overview of The Presentation Methods
In this study three presentation methods are proposed which can present distance and location information between the target object and the surroundings even if there is occlusion between them. Details of calculating shortest distance and position between the target object and its surroundings are not mentioned in this research. It is supposed that the distance and location information used in this research are calculated by other existing methods. To present distance and location information when occlusion problem happened, the target object, the surroundings, the middle area between the target object and the surroundings are being taken into consideration.
In order to find out a best-performed presentation method for decommissioning work in nuclear power plant, three elements are considered to solve the occlusion problems. They are the target object, the surroundings and the middle area between the target object and its surroundings. Table3.1 shows the possible methods which can deal with the occlusion problem. For the target object, it is the main reason of occlusion problem. Set the target object into transparency is a method to present back side of the target object clearly. The more transparent it is, the more clear occlusion area will be presented. However, too much transparency of the target object may cause a difficulty of understanding shape of the target object itself. It may not allowed for workers to
A Trolley carrying
Dismantled Facility
The Real-world
Environment
View Angle
of Camera
on Tablet PC
?
Workers using AR-based
Support System
Pointing Positions
between
Dismantled Facility
and
Real-world Environment
Figure 3.2: Side view of dismantled facility and real-world environment
move freely inside the nuclear power plant, the wireframe and additional cube grids are used to present shape of the target object which is set into complete transparency. For the surroundings, they are hidden by the target object which causes the difficulty to understand the distance and location information of it. Additional cube grids are used to present shape of the surroundings. For the middle area between the target object and its surroundings, a pointing line and annotation are used to present the location and the distance and location information between the target object and its surroundings.
Considered all above, in this research Transparent Model and Pointing Line Method (Line Method), Grids Model Method (Grids Method), Model Rotation and Shift Method (Moving Method) are proposed as in the following sections.
Table 3.1: Possible methods used to deal with the occlusion problem Elements Possible Methods
The target object transparency, wireframe, additional grids The surroundings additional grids
The occlusion area pointing line, distance and location information
3.3
Proposal of Transparent Model and Pointing
Line Method
As shown in Fig.3.2 before, the main reason why it is difficult to understand the distance and location information between the target object and its surroundings is the occlusion problem occurred between them. To solve occlusion problem, Transparent Model and Pointing Line Method (Line Method) is proposed in which a colored pointing line is located between the target object and its surroundings. The ends of the line point at the shortest distance positions on the target object and its surroundings. The target object was conducted into semi-transparency in order to show a perceptive view of the target object which can present location relationship between the target object and its surroundings clearly as shown in Fig.3.3. It is expected that the target object and its surroundings can be presented clearly using the Line Method.
In the Line Method, changing transparency of the target object and thickness of the pointing line may influence the difficulty of understanding the distance and location information between the target object and its surroundings.
Considering the real-world environment in nuclear power plant is a complex and dim situation, the contrast of rectangle and text is being increased to present the text annotation clearly no matter with environment. To reduce the influence of text annotation, the position of text annotation presented on AR display is adjusted to avoid to hides the target object or the surroundings.
The advantage of this method is that back side of the target object can be seen without a movement by workers, this may help the workers to understand the real decommissioning work more correctly. Workers can see through the target object to know the location relationship between the target object and its surroundings thanks to the transparency of the target object. The red-colored line also assists workers to
Real-world
Environment
Distance
Information
AR Display
Worker using AR-based Support System
Pointing
position at
target object
Pointing position at
surroundings
Distance:
47cm
Figure 3.3: Concept of information presentation method using a Transparent Model and Pointing Line Method (Line Method)
find out the pointing position where the distance and location information is presented. The disadvantage of this method is the difficulty to present back side surface of the target object.
3.4
Proposal of Grids Model Method
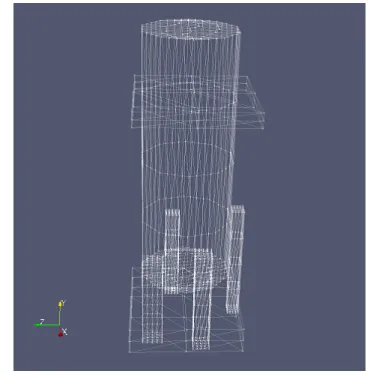
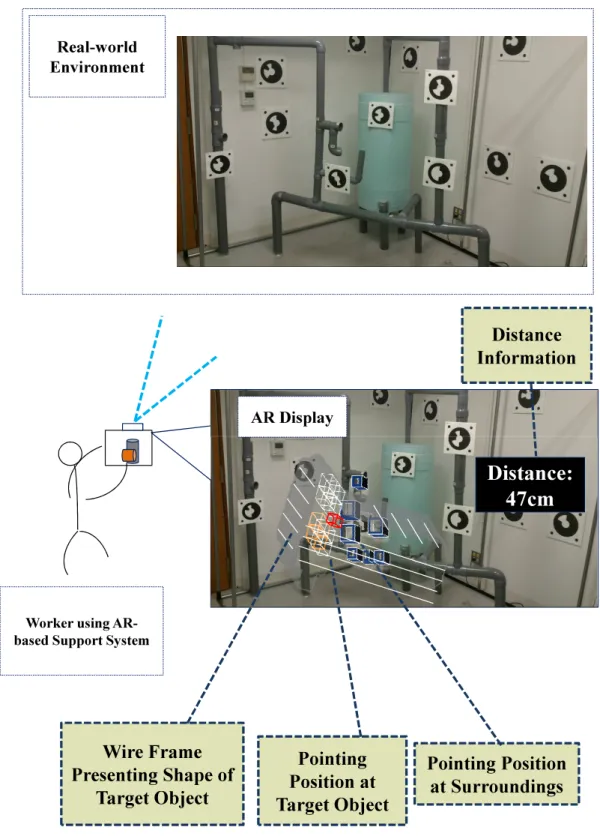
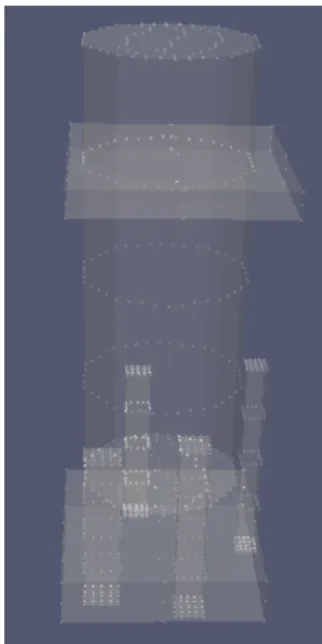
Fig.3.5 shows the concept of Grids Model Method (Grids Method). The target object is set into transparency to get a good perceptive view by seeing through itself. In order to present the pointing position significantly, additional cube grids are added into the surface of the target object and the surroundings to show the shape of them. There are two kinds of grids in the method to present shape of the target object and the surroundings. Small grids are used in the surface of the target object and the surroundings to show the shape of them, and large grids are used inside the target object and the surroundings to show the pointing position and its nearby area. The large grids’ size changes with time passing. These changeable grids may lead to a quick attention of workers on pointing area. To present a clear shape of the target object after it has been set into a complete transparency, wire frame was also used in this method, as shown in Fig.3.4, which fill inside surface of the target object to show the surface shape of the target object. Thanks to the additional wire frame in the target object, three dimensional sense can be presented to worker better than complete transparency without any additional element.
Figure 3.4: An example of wire frame of the target object
presented clearly which may help the workers to understand the distance and location information more easily. However, in this presentation method, grids are used to present pointing position on the target object and its surroundings, similar grids may confuse worker to understand the location of pointing position.
Fig.3.6 shows that additional cube grids presented in the target object. Red-colored cube grids are the pointing position intended to present, meanwhile the orange-colored cube grids represented the area nearby red-colored cube grids. The target object is filled full of grids in same size at first. These grids are set into transparent which only the pointing area and its nearby area will be set into color. After a pointing position being set, center grid is used to present this pointing position. Then all the grids with a range of 200mm from center grid are calculated. These grids are called nearby grids. The nearby grids are set by color atlas corresponding to the distance from center grid. The real-world environment is presented with purple-colored grids on surface.
There are two parameters included in the Grids Method, which additional cube grids are being introduced. Maximum size of grids and rate of change are being took into considerations in the Grids Method. Changing maximum size of grids may influence the presentation of pointing area, becoming more easily for workers to understand. Rate of change of grids may influence the time of workers’ attention on pointing position displayed.
Advantage of the Grids Method is that workers can know shape of the target object and its surroundings without moving to another place. Different from presentation methods using points to show pointing position, the Grids Method can perform a good depth perception on plane AR display. Disadvantage of this method is that the additional grids may confuse workers to understand the location relationship between the target object and grids, because dynamic grids at the target object may cause interference with other grids at the real-world environment.
3.5
Proposal of Model Rotation and Shift Method
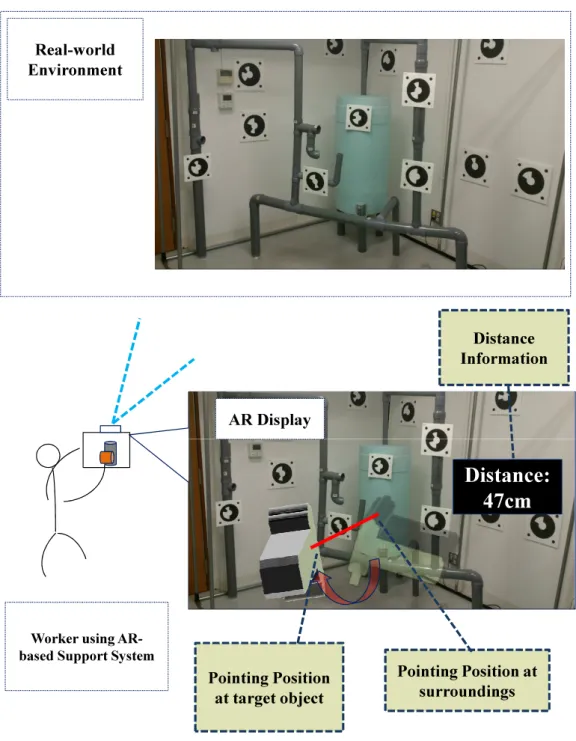
Model Rotation and Shift Method (Moving Method) is proposed that forcibly rotate and shift the target object from original location (transparent target object in Fig.3.7) to final location (non-transparent target object in Fig.3.7, of which pointing position
Distance
Information
AR Display
Real-world
Environment
Worker using
AR-based Support System
Pointing
Position at
Target Object
Pointing Position
at Surroundings
Distance:
47cm
Wire Frame
Presenting Shape of
Target Object
Figure 3.5: Concept of information presentation method using a Grids Model Method (Grids Method)
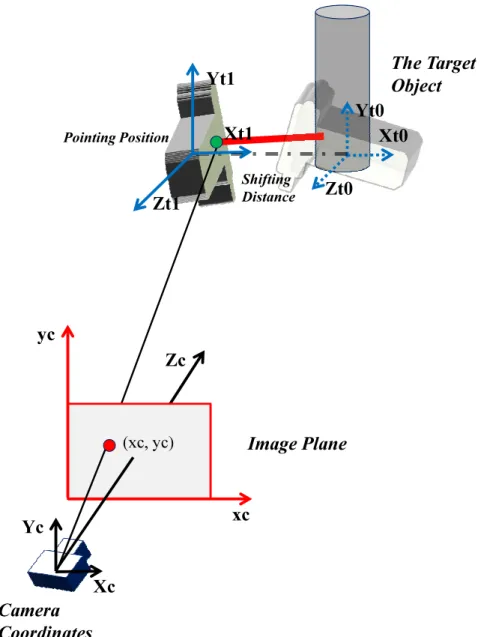
becomes visible without hiding its surroundings). Fig.3.8 shows the relationship be-tween the target object and image plane.
Figure 3.6: An example of additional cube grids in the target object
In this method, projection coordinate of pointing position presented by the AR-based support system on image plane is calculated firstly. If pointing position at the target object is invisible from current viewpoint, the target object is forcibly rotated towards worker slowly until it becomes visible. Once pointing position at the target object becomes visible, rotation of the target object will stop. A further shifting distance is an additional option which can show the real-world environment hidden by the target object.
Rotation speed and shifting distance are being took into considerations in the Moving Method. Changing rotation speed of the target object may present a different process for workers to understand the appearance of the target object. Adding a different shifting distance may influence the occlusion problem between the target object and its surroundings.
Advantage of the Moving Method is that rotating shows back side of the target object clearly, pointing positions on both the target object and its surroundings can be presented obviously. Shifting the target object shows the real-world environment hidden by the target object clearly. However, disadvantage of this method is the difficulty to understand the pointing position at the target object due to its shifting far away from original location. Workers need to imagine the original pose of the target object which may cause a misunderstanding of back side of the target object.
Distance
Information
AR Display
Real-world
Environment
Worker using
AR-based Support System
Distance:
47cm
Pointing Position
at target object
Pointing Position at
surroundings
Figure 3.7: Concept of information presentation method using a Model Rotation and Shift Method (Moving Method)
Yt0 Xt0 Zt0
The Target
Object
yc Pointing Position Yt1 Xt1 Zt1 Shifting DistanceCamera
Coordinates
Yc Xc Zc xc(xc, yc)
Image Plane
Chapter 4 Evaluation of Presentation
Methods
In this chapter, the evaluation of the proposed presentation methods is mentioned. In order to find out which proposed presentation method performed best, two stages of evaluation were conducted. Both are evaluated from two aspects, one is which method presented on AR display is easy to be understood, the other aspect is position error between pointing position presented and position participants understood. As which parameter pattern in each proposed presentation method performed well is unknown, a best-performed parameter pattern of each proposed method should be found out in first stages of evaluation. After that, best-performed presentation method was evaluated among three methods with their best-pattern.
4.1
Purpose of The Evaluation
The purpose of this evaluation is to find out a best-performed method, which is the most easiest methods for participants to understand the pointing positions and present pointing position with the highest accuracy.
4.2
Overview of The Evaluation Method
In order to find out which of the proposed presentation methods perform best, two stages of evaluation are conducted by subjective assessment and error evaluation. Best-performed means the presentation method can be understood the most easily by the workers and the position error between pointing position understood by participants and presented by the system is the smallest.
Fig.4.1 shows the overview of the evaluation which are conducted in two stages. Firstly, best-performed parameter pattern in each presentation method is found out in the first stage of evaluation. It is because, although three presentation methods
were proposed, different parameter patterns in each presentation method may have a different result. So evaluations to find out which parameter pattern in each presentation method performed the best was conducted.
In second stage of evaluation, experiment was conducted to find out best-performed method among three proposed presentation methods.
Par
am
eter
Patt
ern
1
Line MethodPar
am
eter
Patt
ern
2
Par
am
eter
Patt
ern
3
Par
am
eter
Patt
ern
4
Best-performed
Parameter
Pattern
First stage of EvaluationPar
am
eter
Patt
ern
1
Grids MethodPar
am
eter
Patt
ern
2
Par
am
eter
Patt
ern
3
Par
am
eter
Patt
ern
4
Best-performed
Parameter
Pattern
First stage of EvaluationPar
am
eter
Patt
ern
1
Moving MethodPar
am
eter
Patt
ern
2
Par
am
eter
Patt
ern
3
Par
am
eter
Patt
ern
4
Best-performed
Parameter
Pattern
First stage of EvaluationSecond stage of Evaluation
Best-performed
Presentation Method
Figure 4.1: Flow of two stages of the evaluation
In order to increase efficiency of whole evaluation, the first stage evaluation of three proposed methods were conducted continuously for one participant. Fig.4.2 shows the flow of one participant joined in first stage of evaluation. Firstly, a explanation of the purpose and details of this evaluation experiment was stated by experimenter. It is allowed that participants can drop out during the evaluation. If there is no questions, participant sign on a consent form of this evaluation. Participant experiences three
proposed presentation methods by the sequence of the Line Method, the Grids Method, the Moving Method. Total time for the first stage of evaluation of one participant costs about 40 minutes. Evaluation of Line Method Evaluation of Grids Method
Participant 1
(40min)
Sign on Consent Form
Evaluation of Moving Method
Figure 4.2: Flow of the first stage of evaluation experiment
Fig.4.3 shows the flow of one participant joined in second stage of evaluation. Three best-performed parameter patterns in each presentation method were showed to partic-ipant. Considering order effect, the sequence of presentation methods for each partici-pant was set randomly. Total time for the second stage of evaluation of one participartici-pant costs about 30 minutes.
4.3
Environment used for The Evaluation
4.3.1
Evaluation Environment and Devices
In this subsection, evaluation environment will be introduced, including assembling of simulated decommissioning area, marker measurement for tracking and environment modeling by kinect fusion [15].
Fig.4.4 shows top view of evaluation environment. Evaluation room mainly includes Simulation Area, User Activity Area and Desk. Simulation Area is a real-world envi-ronment of carrying decommissioning work.
Participant 1
(30min)
Evaluation of Method One Evaluation of Method TwoSign on Consent Form
Method Two
Evaluation of Method Three
Figure 4.3: Flow of the second stage of evaluation experiment
2.1m
2.1m
Simulation Environment of
Carrying Decommissioning
Desk
Entrance
User Activity
Area
Simulation environment is shown in Fig.4.5. The plastic pipes were assembled to-gether to simulate a part of internal environment of nuclear power plant where a decom-missioning work is undergoing. Markers [16] are located in the real-world environment and used for tracking. User Activity Area is where participant can move during evalua-tion on this AR-based support system. Setting a limitaevalua-tion space for participant is that it is not allowed to move freely in real decommissioning work in nuclear power plant. This user activity area is a simulation of real activity area during decommissioning work.
Plastic Pipes Markers for
tracking
Figure 4.5: Simulation environment of carrying decommission
Fig.4.6 shows the markers arranged on real-world environment. Markers were printed on cloth so that it is hard to be affected with damp, and pasted on a same-size plastic board by glue stick. On the right of Fig.4.6 is an example of the marker used for tracking in this research. 12 markers were used for tracking including 7 pieces of 100-mm radius markers and 5 pieces of 75-mm radius markers.
Fig.4.7 shows the marker arrangement measured by Automatic Marker Measurement System. Details of tracking method is shown in Appendix A. The whole AR-based sup-port system was developed by a notebook shown in Table4.1. Considered the complex internal environment of nuclear power plant and limited space, hand held device is a suitable device for AR-based support system. Common hand held devices have the dis-advantage that the limited size of display and lower operational capability. To reduce
Figure 4.6: Markers arranged in real-world environment
Figure 4.7: Measuring result of markers arrangement
this disadvantage, a tablet PC was used in this research.
Fig.4.8 shows the tablet PC being used for evaluation. The specification of the tablet PC is shown in Table4.2. During the evaluation, a rear camera in tablet PC is used for tracking and real-time display of real-world environment. A camera calibration tool is used for rear camera calibration, which is GML Camera Calibration toolbox [17].
Table 4.1: IDE and libraries used for developing AR-based support system OS Windows 7 Professional(64bit)
IDE Microsoft Visual Studio 2010 Libraries Boost 1.51, VTK 5.10, OpenCV 2.4.3
Figure 4.8: Tablet PC used for presentation methods evaluation
Table 4.2: Specification of tablet PC used for presentation methods evaluation Computer type Microsoft Surface Pro 3
OS Windows 8(64bit) CPU Core i5 1.9GHz
Memory 4GB
Display Size 12 inch
Weight 800g
Rear Camera 5 MP, 1080P Display 2160x1440 (216ppi)
4.3.2
Environment Model Reconstruction
Augmented distance information was presented over the displayed image of the envi-ronment in AR-based system. In order to present shape of the real-world envienvi-ronment
by additional grids in the Grids Method, 3D model of the real-world environment needs to be reconstructed. InfiniTAM [18] is a multi-platform framework for real-time, large-scale depth fusion and tracking, an Open Source created on KinectFusion [15] and Volumetric Methods [18], which can integrate multiple depth images into a full 3D model. Depth images of real-world environment for using InfiniTAM are tooken by Asus Xtion Pro Live. Asus Xtion Pro Live is a 3D sensor which can be used for making motion sensing systems. Fig.4.9 shows the appearance of Asus Xtion Pro Live. Table4.3 shows technical specification of Asus Xtion Pro Live. In order to calibrate Asu Xtion Pro Live, a camera calibration tool for OpenNI based RGB-D sensors is used [19]. After camera calibrated, a capture of real-world environment was done by Asus Xtion Pro Live. It is important to take all the images slowly to ensure all the captures are clear enough for 3D model reconstruction. Fig.4.10 shows the 3D model reconstruction result of real-world environment.
Figure 4.9: Appearance of RGB-D camera used for scanning environment
Table 4.3: Technical specification of Xtion Pro Live Interface USB 2.0 and 3.0 Image Sensor RGB and Depth Max.Image Resolution 640 x 480 Video Capture Resolution SXGA (1280*1024)
Figure 4.10: Result of evaluation environment after 3D model reconstruction
4.4
Evaluation of Transparent Model and Pointing
Line Method
4.4.1
Purpose of Evaluation
The Line Method is a presentation method in which transparency of CG Model and thickness of pointing line are parameters, which will affect the performance of understanding the pointing position. As back side of the target object is invisible in existing AR-based support system, making the CG model into transparency can present back side of the target object more clearer. However, different transparency of the target object may lead to different performance result of the Line Method. Purpose of this evaluation is to find out best-performed parameter pattern in the Line Method.
4.4.2
Details of Evaluation
4.4.2.1 Protocol of Evaluation
Fig.4.11 shows the experimental protocol for the Line Method evaluation. Four parameter patterns were shown to participants. Evaluation materials is shown in Ap-pendix B. After a participant came into the evaluation room, he sit next to a desk where evaluation materials and questionnaire are on. At the beginning, experimenter
explain the purpose of this evaluation. Then experimenter explained the evaluation flow of the Line Method in 0.5 minutes, and verifying there is no question from par-ticipant, participant was instructed to stand up to use AR system installed with the Line Method. During the usage exercise, experimenter explained the interface of pro-posed presentation method on AR-based support system. After participant did usage exercise of the Line Method, participant sit down and glance over the questionnaire on the desk. Experimenter instructs participant to experience the support system. Once participant understand the pointing position on real-world environment and the target object, they answer the questionnaire. There are subjective questions and objec-tive questions prepared in questionnaire. For the subjecobjec-tive questions, participant was asked to write the pointing position on real-world environment and the target object at prepared pictures as shown in Fig.4.12 and Fig.4.13. Fig.4.12 shows the picture for participant to write answer on real-world environment. Fig.4.13 shows the picture for participant to write answer on the target object.
Explanation (0.5min)
Usage exercise (0.5min)
Sign on consent form (0.5min)
Evaluation of High-Transparency-Thin-Line
(0.5min)
Answer questionnaire (0.5min)
Interview (1min)
Evaluation of High-Transparency-Thick-Line
(0.5min)
Answer questionnaire (0.5min)
Interview (1min)
Evaluation of Low-Transparency-Thin-Line
(0.5min)
Answer questionnaire (0.5min)
Interview (1min)
Evaluation of Low-Transparency-Thick-Line
(0.5min)
Answer questionnaire (0.5min)
Interview (1min)
Figure 4.11: Protocol of evaluation of the Line Method
For the subjective questions, participant was asked to write how difficult to under-stand the pointing position presented by the Line Method. After participant finished questionnaire, experimenter review the answer and ask for the reason on the answer scored below ”4”. Details of categorical answers and corresponding numeric scores are
Figure 4.12: Real-world environment picture for participants to write pointing position
Table 4.4: 7-Level likert scale and corresponding numeric scores 7-level scale Score
Strongly agree 7 Agree 6 Somewhat agree 5 Neutral 4 Somewhat disagree 3 Disagree 2 Strongly disagree 1
shown in Table4.4. After interview, the experience of presentation method 1 in pattern 1 is completed. Participant experiences other three parameter patterns by the same way and select which pattern they preferred to.
Questions used to analyze the difficulty for participants to understand the pointing position of the Line Method are shown below.
Q1-1 It is easy to understand the pointing position presented at the target object.
Q1-2 It is easy to understand the pointing position presented at real-world environment.
Participants score for each question using points from 1 to 7, ”Strongly disagree”, ”Disagree”, ”Somewhat disagree”, ”Neutral”, ”Somewhat agree”, ”Agree”, ”Strongly agree”.
4.4.2.2 Parameter Patterns of Evaluation
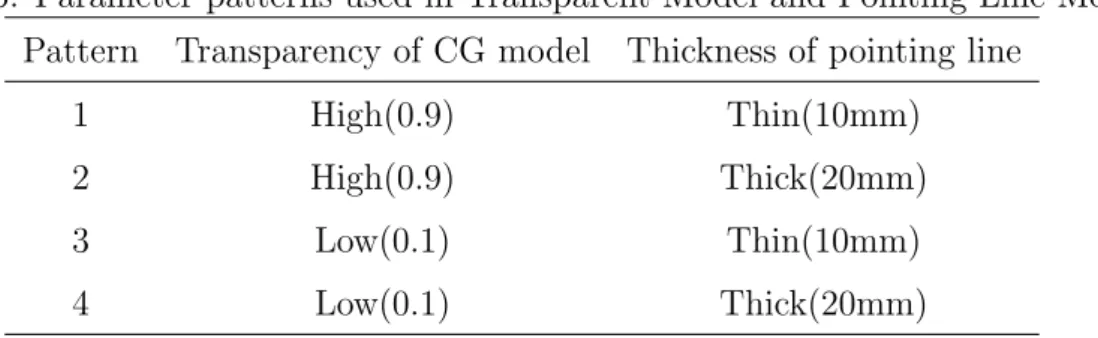
Table4.5 shows the parameter-patterns evaluated in this evaluation. A high-transparency CG model and a low-transparency CG model were prepared in this evaluation. These four parameter-patterns were selected during the preliminary experiment and shown to every participant. Transparency of CG model was set from 0 (non-transparent) to 1 (complete transparent). Besides, to presenting the distance between the target object and the surroundings, a red-colored pointing line is be adopted.
Fig.4.14 shows the screen shot of four parameter patterns in the Line Method evalua-tion. A transparency CG model was presented on AR display which camera is oriented
Table 4.5: Parameter patterns used in Transparent Model and Pointing Line Method Pattern Transparency of CG model Thickness of pointing line
1 High(0.9) Thin(10mm)
2 High(0.9) Thick(20mm)
3 Low(0.1) Thin(10mm)
4 Low(0.1) Thick(20mm)
Transparency: 0.9
Thickness of Pointing Line: 10mm
Thickness of Pointing Line: 20mm
Transparency: 0.9
Transparency: 0.1
Thickness of Pointing Line: 10mm
Thickness of Pointing Line: 20mm
Transparency: 0.1
4.4.2.3 Participants in Evaluation
4 graduate students from Kyoto University joined this evaluation of presentation method.
4.4.3
Results of Evaluation
Answers of Q1-1 and Q1-2 are used for subjective assessment. Pointing positions on the environment and the target object wrote by participants are used for objective assessment.
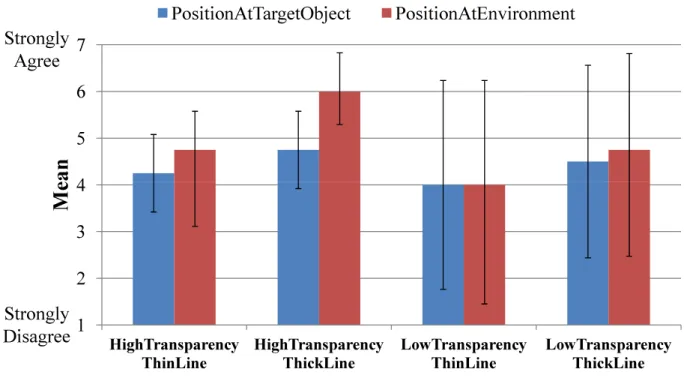
4.4.3.1 Results of Subjective Questions
Answers of Q1-1 and Q1-2 are analyzed by using mean and standard deviation. The answer of Q1-1 is shown blue bars in Fig.4.15. High-Transparency-Thick-Line was scored highest among four parameter patterns. Standard deviation of it is the most the smallest one among all parameter patterns. The answer of Q1-2 is shown red bars in Fig.4.15. High-Transparency-Thin-Line was scored highest among four parameter patterns and the standard deviation is quite small. For standard deviation, there is no significant difference between Thick-Line and High-Transparency-Thin-Line. It can be considered High-Transparency-Thick-Line performed best among four parameter patterns.
4.4.3.2 Results of Objective Questions
Fig.4.16 shows an example of measurement method using participants’ answer wrote on the picture of the real-world environment. Participants write pointing position, which they understood during the Line Method evaluation on real-world environment, using a cross mark on the picture of the environment printed on the questionnaires sheet. All the pictures of real-world environment were set into same size in all ques-tionnaires. Height (Y) and width (X) of cross mark are measured from bottom and left of the picture of the real-world environment using a ruler. Height (Y0) and width (X0) of presented pointing position are measured which uses the pointing position wrote on the picture of the real-world environment according to laser range finder. Distance (D) between the cross mark (X, Y) and pointing position presented during this evaluation
4
5
6
7
M
ea
n
PositionAtTargetObject
PositionAtEnvironment
Strongly
Agree
1
2
3
4
HighTransparencyThinLine HighTransparencyThickLine LowTransparencyThinLine LowTransparencyThickLine
M
ea
n
Strongly
Disagree
Figure 4.15: Means and standard deviations of scores for subjective questions in Line Method
(X0, Y0) was calculated and used as the distance error on real-world environment. Fig.4.17 shows an example of measurement method using participants’ answer on the picture of the target object wrote by participant. Participants write pointing position they have understood during the Line Method evaluation on the target object, using a cross mark on the picture of the target object printed on the questionnaires sheet. Fig.4.18 shows an example of measurement method of true pointing position used in the Line Method Evaluation. The target object and the coordinates of presented pointing position are shown by the 3D CG software, and a screen shot is printed from the 3D CG software.
Distance between the cross mark (X, Y) and pointing position presented during this evaluation (A, B) was calculated and used as the distance error at the target object.
Fig.4.19 shows the distance error of pointing position wrote by participants on the picture of world environment and the target object. For the picture of the real-world environment, distance error of High-Transparency-Thin-Line is smallest among four parameter patterns. Although error and standard deviation of High-Transparency-Thick-Line is slightly bigger than those of High-Transparency-Thin-Line, the differ-ence between distance error of High-TransThick-Line and High-Trans
parency-X Y Questionnaire Y0 X0
D
Figure 4.16: Pointing position wrote by participants on the real-world environment
Thin-Line is no more than 2 mm. It can be said High-Transparency-Thick-Line per-formed as well as High-Transparency-Thin-Line. For the picture of the target object, distance error of High-Transparency-Thick-Line is the smallest among four parameter patterns.
4.4.3.3 Interview Results and Analysis of Line Method Evaluation
High-Transparency-Thick-Line was scored the highest among four parameter pat-terns in blue, red bars in Fig.4.15 and the red bar in Fig.4.19 is the smallest. Only in the result shown in the blue bar in Fig.4.19, distance error of High-Transparency-Thick-Line is larger than High-Transparency-Thin-High-Transparency-Thick-Line. However the difference between High-Transparency-Thin-Line and High-Transparency-Thick-Line is only a little. It can be considered High-Transparency-Thick-Line performed best totally.
As mentioned before, reasons of questions those scored under ”4”, is interviewed to participants. Table4.6 shows the scores answered for Q1-1 and Q1-2.
For High-Transparency-Thin-Line, there are two participants scored under ”4” on Q1-1 and Q1-2. Participant 4 scored ”3” for pointing position on the target object and ”2” for pointing position on real-world environment. When endpoints of pointing line comes to surface of the target object or the real-world environment where no significant shape is shown, it is difficult to recognize pointing position. Participant 3 scored ”4”
X Y
Figure 4.17: Pointing position wrote by participants on the target object
for pointing position on the target object. He said that whether high transparency or low transparency, shape of the target object can be understood well. However, when pointing line comes to vertical, it is difficult to know the location of endpoints of pointing line. He was confused with the location relationship of the target object and its surroundings.
For Low-Transparency-Thin-Line and Low-Transparency-Thick-Line, there are ”1” and ”2” being scored. According to interview to participants, low transparency of the target object did not reduce the bad influence from the target object itself. Back side of the target object is visible but not enough compared to high transparency.
However, high transparency of the target object is not satisfied to everyone. Partici-pant 4 preferred low transparency than high transparency, because low transparency of the target object presents shape of the target object more significant than high trans-parency of the target object. A well-presented of surface shape of the target object is the main reason he preferred Low Transparency parameter pattern.
In conclusion of the Line Method evaluation, High-Transparency-Thick-Line is the best parameter pattern in the Line Method. High transparency of the target object presents back side of the target object better than low transparency of the target object commonly, because users can see through the target object and understand the location relationship between the target object and the surroundings easily. In some cases, Low
True Pointing Position B
A
Figure 4.18: True pointing position on the target object
Transparency parameter pattern is preferred to those who want to see surface shape of the target object clearly.
4.5
Evaluation of Grids Model Method
4.5.1
Purpose of Evaluation
The Grids Method is a presentation method that additional cube grids are used to present shape of the target object and real-world environment, to present distance and location information clearly even there is occlusion between the target object and its surroundings. In the Grids Method, the target object is presented with wire frame to show its shape as well as additional cube grids to enhance three dimension. Different from the Line Method, cube grids are added both on the target object and its surroundings instead of pointing line. Pointing position on surface of the target object and its surroundings were presented with red-colored cubes. Different parameter patterns of cube size and rate of change may lead to different performance result of the Grids Method. Purpose of this evaluation is to find out best-performed parameter
5
10
15
20
25
30
Di
sta
nc
e E
rro
r [
mm
]
PositionAtEnvironment
PositionAtTargetObject
0
5
HighTransparencyThinLine HighTransparencyThickLine LowTransparencyThinLine LowTransparencyThickLine
Figure 4.19: Means and standard deviations of average error of presented pointing position in Line Method
pattern in the Grids Method.
4.5.2
Details of Evaluation
4.5.2.1 Protocol of Evaluation
The protocol of evaluation of the Grids Method is the same as the one of the Line Method except the parameter patterns and subjective questions. Evaluation of the Grids Method was conducted in the same environment as the Line Method evaluation. Fig.4.20 shows the details of process in evaluation of Grids Method.
Participants write pointing position understood during evaluation on the pictures of the target object and real-world environment the same as they did in the Line Method evaluation. However, parameter patterns and questionnaires are different from those in the Line Method. Two more questions for subjective assessment are added in the Grids Method evaluation. Questions used to analyze the difficulty for participants to understand the pointing position of the Grids Method are shown below.
Q2-1 The size of cubes in red and purple is appropriate.
Q2-2 The rate of change of cubes in red and purple is appropriate.
Table 4.6: Scores on subjective questions in Line Method
Participant
1
2
3
4
Parameter Pattern
Questions
A. High-Transparency/
Thin-Line
Q1-1
5
5
4
3
Q1-2
5
6
6
2
B. High-Transparency/
Thick-Line
Q1-1
6
4
5
4
Q1-2
7
5
6
6
C. Low-Transparency/
Thin-Line
Q1-1
1
3
7
5
Q1-2
1
2
7
6
D. Low-Transparency/
Thick-Line
Q1-1
2
3
7
6
Q1-2
2
3
7
7
Best-performed Parameter Pattern
B
A
ALL D
Q2-4 It is easy to understand the pointing position presented at real-world environment.
For subjective assessment, participants score for each question using points from 1 to 7, ”Strongly disagree”, ”Disagree”, ”Somewhat disagree”, ”Neutral”, ”Somewhat agree”, ”Agree”, ”Strongly agree”. The questionnaires sheet is shown in Appendix C.
4.5.2.2 Parameter Patterns of Evaluation
Table4.7 shows the parameter-pattern evaluated in this evaluation. These four parameter-patterns were shown to every participant. Fig.4.21 shows the screen shoot of four parameter patterns in the Grids Method evaluation. Red-colored grids rep-resent shape of a part of the target object. The central red-colored grid reprep-resents pointing position at the target object. Purple-colored grids represent shape of a part of real-world environment. The central purple-colored grid represents pointing position
Evaluation of Big-Size-Slow-Rate
(0.5min)
Answer questionnaire (0.5min)
Interview (1min)
Evaluation of Big-Size-Quick-Rate
(0.5min)
Answer questionnaire (0.5min)
Interview (1min)
Evaluation of Small-Size-Slow-Rate
(0.5min)
Answer questionnaire (0.5min)
Interview (1min)
Evaluation of Small-Size-Quick-Rate(0.5min)
Answer questionnaire (0.5min)
Answer questionnaire (0.5min)
Interview (1min)
Figure 4.20: Protocol of evaluation of Grids Method
at real-world environment.
Table 4.7: Parameter patterns used in Grids Model Method Pattern Maximum Size of Grids Rate of Change
1 Big(80mm) Slow(12.5cm/s round) 2 Big(80mm) Quick(50cm/s round) 3 Small(20mm) Slow(12.5cm/s round) 4 Small(20mm) Quick(50cm/s round)
4.5.2.3 Participants in Evaluation
4 graduate students from Kyoto University joined this evaluation of presentation method.
4.5.3
Results of Evaluation
Answers from Q2-1 to Q2-4 are used for subjective assessment. Pointing positions on the real-world environment and the target object wrote by participants are used for objective assessment.
Maximum Size of Grids: 80mm
Rate of Change: 12.5cm/s round
Maximum Size of Grids: 80mm
Rate of Change: 50cm/s round
Maximum Size of Grids: 20mm
Rate of Change: 12.5cm/s round
Maximum Size of Grids: 20mm
Rate of Change: 50cm/s round
Figure 4.21: Screen shot example of four parameter patterns in Grids Method evalua-tion
4.5.3.1 Results of Subjective Questions
Answers from Q2-1 to Q2-4 are analyzed by using mean and standard deviation. The answer of Q2-1 is shown in Fig.4.22.
Blues bars show the mean of Q2-1 with error bars representing standard deviation. It is difficult to decide which of big-size or small-size of cube grids performed better in this graph, because Big-Size-Quick-Rate performed a slightly higher than Small-Size-Slow-Rate. Different patterns with size of grids and rate of change lead to a different results for participants to understand the distance and location information presented. Red bars show the results of Q2-2. Big-Size-Quick-Rate was scored higher than Small-Size-Slow-Rate, however, standard deviation of Big-Size-Quick-Rate is larger than the one of Small-Size-Slow-Rate. Green bars show the results of Small-Size-Slow-Rate. Although difference among four parameter patterns is no so significant than in Q2-1 and Q2-2,
3 4 5 6 7 M ea n
Size RateOfChange PositionAtTargetObject PositionAtEnvironment
Strongly Agree
1 2
BigSizeSlowRate BigSizeQuickRate SmallSizeSlowRate SmallSizeQuickRate
Strongly Disagree
Figure 4.22: Means and standard deviations of scores for subjective questions in Grids Method
Big-Size-Quick-Rate was scored highest among four parameter patterns. Purple bars show the mean with standard deviation of Q2-4. Different from previous questions, Big-Size-Slow-Rate was scored highest as Small-Size-Quick-Rate. Both answers in Q2-4 are better than answers in Q2-3 which suggest pointing position at real-world environment is much more easily to be understood than pointing position at the target object in the Grids Method.
4.5.3.2 Results of Objective Questions
Participants were asked to draw pointing positions at real-world environment and the target object which they understood during the Grids Method evaluation. Distance error of all the answers were measured the same as the measurement method used in the Line Method.
Fig.4.23 shows the distance error of pointing position draw by participants on the picture of the world environment and the target object. For the picture of the real-world environment, distance error of Small-Size-Slow-Rate is the smallest among four parameter patterns followed by Big-Size-Quick-Rate. Standard deviations of distance error of Big-Size-Quick-Rate is smaller than the one of Small-Size-Slow-Rate, which represents a large difference of answers in Small-Size-Slow-Rate. For the picture of the target object, Big-Size-Quick-Rate was scored near Big-Size-Slow-Rate. Big-size of grids performed a clear shape of the target object than small-size ones.
4.5.3.3 Interview Results and Analysis of Grids Method Evaluation
Table4.8 shows the results from Q2-1 to Q2-4.
Big-Size-Quick-Rate was scored the highest among four parameter patterns in blue, red, green bars shown in Fig.4.22. In purple bars, it was scored lower than Big-Size-Slow-Rate and Small-Size-Quick-Rate. However there is a little difference among them. Although distance errors of Big-Size-Quick-Rate are not the smallest one in Fig.4.23. There is a little difference between it and the smallest one. It can be considered Big-Size-Quick-Rate scored the highest totally.
For Big-Size-Slow-Rate, there are 7 answers scored under ”4”. Participant 1 scored ”2” in Q2-3 because it is difficult for him to understand which of red-colored grids representing pointing position. The reason is that location of grids confused him, it is