1. Introduction
Chemical transportation accidents make a serious damage on human lives, local infrastructures and the social econo- my. Risk assessment, therefore is an effective and impor- tant methodology for the decision making of accident prevention and damage reduction. A reasonable discussion and judgment as a result of the risk assessment are needed for the traffic control of the vehicles which loads danger- ous goods. Although the risk assessment has a long history in many industrial fields, hazardous material transporta- tion have more difficulty in defining properties of hazard source which moves time to time than static facilities such as chemical or nuclear plants
1)~13).
Risk is defined as a combination of the probability (or frequency) of the event and its consequence
1). Since trans- portation risk assessment of dangerous goods also consists of two elements such as the frequency of the accident and its consequence, predicting the traffic accident frequency is indispensable to calculate the frequency of vehicles which loads dangerous goods.
Frequency of each event is calculated as the product of the frequency of the traffic accident and the probability of the possible outcome case which follows the release. The
frequency of the accident is usually given as a function of the type of road, such as highway, local etc., which can be easily identified for a given route based on the statistical data
14). However when examine the accident frequency of the road without accident data or the road under design one must predict or estimate the frequency from the exist- ed statistics. This paper describes the prediction method of the traffic accident frequency with the cluster analysis technique using the road attributes such as the number of vehicle, the travel speed, the number of lanes, lane width etc.. The cluster analysis of motor highway in Kanto area was firstly carried out based on the statistical data of motor highway accidents in Japan. Then the result of cluster analysis was applied to the motor highway of Yokohama city, and the validity of the method was examined using the Mann-Whitney’s U-test and the predicted accident fre- quency was compared with the actual accident frequency data.
2. Prediction procedure of accident frequency of dangerous goods transportation
Since the major cause of the accident of chemical trans- portation is derived from traffic accidents. Especially on
Prediction of accident frequency for road transport of dangerous goods
using cluster analysis
Kana Kumeta, Atsumi Miyake
†, and Terushige Ogawa
Department of Safety Engineering, Yokohama National University, 79-5, Tokiwadai, Hodogaya-ku, Yokohama 240-8501, JAPAN
†Corresponding address: atsumi@ynu.ac.jp
Received: May 27, 2005 Accepted: December 14, 2005
Abstract
Since the traffic accidents cause serious damage to human lives and economical activity, the transportation risk assess- ment of dangerous goods is a valuable and useful methodology for the decision making of accident prevention and dam- age reduction. This paper describes the prediction method of the accident frequency, which is one of the factors of the transportation risk analysis, with the road attributes using the cluster analysis technique. The cluster analysis of motor highway in Kanto area was performed based on the statistical data of motor highway accidents in Japan. The result of cluster analysis was applied to the motor highway of Yokohama city, and the validity of the method was examined using the Mann-Whitney’s U-test. It was found that the predicted accident frequency showed a good agreement with the actual accident frequency data.
Keywords : Transportation risk assessment, Dangerous goods, Accident frequency, Cluster analysis
Research
paper
the motor highway, 87 % of traffic accidents of vehicles which load dangerous goods is caused by the traffic acci- dents
15).
In this study, it is assumed that final events such as leakage, fire or explosion are derived when the vehicles encounter the accidents. Figure 1 shows the prediction pro- cedure of the frequency of events. Frequency of each final event is estimated as the product of the frequency of the traffic accident and the probability of each final event.
3. Probability of final event
According to the dangerous goods classification system of United Nations, the probability of each event that was derived from traffic accidents was calculated based on the dangerous goods accident statistics on the motor highway in Japan from 1965 to 2004
15). Table 1 shows the number of accident and its probability.
Within 169 cases of the collected accident data there was
Frequency of trafficaccident
· Prediction on accidents frequency by cluster analysis
Probability of the event
· Calculation with the past accidents data
Data base of chemical transportation accidents
· The date of the accident
· Evens
(fire, leak, traffic accident)
· Loaded goods type, volume
Traffic Census
· Road attributes
(Traffic, Congestion degree, Travel speed... )
· Section length
· Number of annual accidents
Frequency of the event
Fig. 1 Prediction scheme of the frequency of dangerous
goods transportation.
UN Transport
Code: Class 1 Class 2 Class 3 Class 4
classification of Explosives Gases Flammable liquids Flammable solids
substances
accidents probability accidents probability accidents probability accidents probability
Traffic accidents 1 1.00 5 0.33 12 0.13 1 0.33
Leak 0 0.00 7 0.47 56 0.63 1 0.33
Fire 0 0.00 3 0.20 20 0.22 1 0.33
Explosion 0 0.00 0 0.00 1 0.01 0 0.00
Total 1 1.00 15 1.00 89 1.00 3 1.00
UN Transport Class 5 Class 6 Class 9
Code: Oxidizing substances toxic and infection Class 8 Miscellaneous
classification of substances Organic peroxides substances Corrosive substances dangerous substances
accidents probability accidents probability accidents probability accidents probability
Traffic accidents 2 1.00 2 0.17 4 0.25 0 -
Leak 0 0.00 8 0.67 11 0.69 0 -
Fire 0 0.00 2 0.17 1 0.06 0 -
Explosion 0 0.00 0 0.00 0 0.00 0 -
Total 2 1.00 12 1.00 16 1.00 0 -
UN Transport
Code: Miscellaneous Total
classification of substances
accidents probability accidents probability
Traffic accidents 2 0.14 29 0.19
Leak 10 0.71 93 0.61
Fire 2 0.14 29 0.19
Explosion 0 0.00 1 0.01
Total 14 1.00 152 1.00
Table 1 Event probability for each class of dangerous goods in motor highway in Japan. (1965 - 2004)
no data of the leakage, fire or explosion due to the loaded explosives, and the explosion of the high pressure gas was also not found among them. Using these data with the accident frequency described below the frequency of the final event is calculated.
4. Prediction of accident frequency using cluster analysis
Cluster analysis is the method to evaluate the similarity between intended objects and to classify large number of samples into several categories. As the classification can be used to predict the variable, the method that enables to classify the roads using their attributes and to predict on traffic accidents frequency was investigated. The road attributes used in this analysis were as follows; the reduced lane widths, the congestion degree, the ratio of the central reserve, the traffic volume during 24 hours, the width of lane, the traffic volume at peak hour, the average travel speed at peak hour, the official speed limit, the number of lane and the accident frequency. First, each of the roads attributes of 232 sections of motor highways in Kanto area were obtained
14). Since the differences in units and ranges of each attribute influence the similarity among intended objects, the attributes were transformed to non-dimen- sional form and were normalized. The approximate fitting curve was used to obtain the transformational functions based on the relation between each attribute and the aver- age frequency of the accidents of 1219 sections of motor highways in Japan. Table 2 shows the road attributes, the transformational functions and the determination coeffi- cients; R
2.
The similarities between objects were evaluated by the similarity coefficient. In this study, the Euclidean distance coefficient e
jk’
16)was used as the similarity coefficient.
(1)
Where,
Wiis the weight of i th attribute,
Xijis the
i thattribute of object
j, and n is the number of attributes.ejk
’can give weight to each attribute according to the strength of the influence of the attribute on the accident
frequency. W
iis decided based on the determination coef- ficients of the fitting curve. Then the Euclidean distances were calculated with each pair of the object. The smaller the Euclidean distance is, the higher the similarity of two objects is. Each object exists in a separate cluster at the first stage, and they were merged with the object which has the similarity. This step was repeated until the cluster became the optimum number with UPGA (unweighted pair-group method using arithmetic averages) cluster- ing method. UPGA clustering method where the distance between clusters is defined to be the distance between the cluster means. In this study, Beale’s pseudo F number was used to decide the adequate number of clusters
17).
(2)
where
c1is the number of the total clusters in the first clustering, c
2is the number of total clusters in the second clustering, S
1and
S2are the sum of squares within clus- ter distances calculated from the first and second cluster means respectively, and k
1and k
2are equal to c
1-2/pand c
2-2/prespectively and p is the number of the original variables.
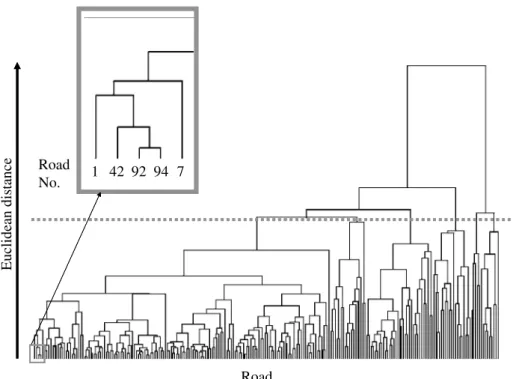
The cluster mergence process is drawn in a hierarchical tree diagram
18). Figure 2 shows the clustering process of motor highway in Kanto area.
It was identified that the roads which accident frequen- cies were unknown belong to the cluster. For Identification that the object belong to the cluster, the similarities between the unknown object and each cluster were calcu- lated by the same similarity coefficient used for classifica- tion and by the same clustering method used for classifica- tion. Either of a complete set or the set that reduced only for a main attribute of an attribute of objects were used for identification. In this study, the similarities were cal- culated by Euclidean distance and UPGA with 9 attributes expect accident frequency. When the road which accident frequency was unknown belonged to the particular cluster, the accident frequency was predicted to be the average accident frequency of the roads included in the belonging cluster. According to Beale’s
F number calculation, theoptimum number of clusters of roads in Yokohama city
Road attribute [X] Transformational function
R2 WiReduced lane widths [m]
Y = 9.93 E-8 exp (-2.77 E-2·X)0.12 1
Congestion degree [-]
Y = 8.02 E-8 exp (3.41 E-1·X)0.12 1
Central reserve ratio [-]
Y = 9.99 E-8 exp (3.37 E-1·X)0.15 2 24 hour traffic [vehicles day
-1]
Y = 7.26 E-8 exp (5.59 E-6·X)0.35 4 Lane widths[m lane
-1]
Y = 1.09 E-6 exp (-6.61 E-1·X)0.36 4 Peak hour traffic [vehicles h
-1]
Y = 7.07 E-8 exp (9.56 E-5·X)0.48 5 Peak hour average travel speed [km h
-1]
Y = 3.06 E-7 exp (-1.52 E-2·X)0.59 6
Speed limit [km h
-1]
Y = 1.15 E-6 exp (-3.05 E-2·X)0.79 8
Number of lane [-]
Y = 7.41 E-8 exp (6.66 E-2·X)0.97 10
Accidents frequency[events vehiche
-1km
-1]
Y = X1.00 10
Table 2 Road attributes and transformational functions.was calculated to be six and the result of cluster analysis of accident frequency for Kanto area is shown in Fig. 3. The normalized attribute values of each cluster are shown in Fig. 4, which shows the characteristics of six final clusters.
Table 3 shows the final result of the cluster analysis of 23 sections of the motor highway in Yokohama city. In Table 3 the predicted frequency values of each cluster are shown with the actual frequency of each road, and also with the significance probabilities determined by the Mann- Whitney’s U-test
19).
For verifying prediction validity, the difference between distributions of Yokohama city roads accident frequency and accident frequency of roads belong the cluster was tested by the Mann-Whitney’s U-test. According to the Mann-Whitney’s U-test, when the significant probability
was no less than 0.1, it was judged that there was no sig- nificant difference in the actual value and the predicted value. From the U-test results, it was concluded that the appropriate predictions were performed for the clusters (1), (3), (4) and (5), i.e. 19 roads out of 23 cases.
From the result of the cluster analysis of each road attri- bute in the classified each cluster, it was found that the degree of congestion had an influence on the accident frequency. Moreover, the accident frequency of the roads which the traffic was extremely little also showed high value. We hope that the result of this work will be a help when one intent to apply accident data to the road control and the risk management of the dangerous goods transpor- tation.
Euclidean distance
1 42 92 94 7 Road
No.
Road
Fig. 2 Hierarchical tree diagram of traffic accident of Kanto area as a result of cluster analysis.
232 sections
(1) (2) (3) (4) (5) (6)
19 sections 1.3 E-7
9 sections 2.9 E-7 5 sections
3.4 E-7 33 sections
1.8 E-7 148 sections
6.9 E-8
18 sections 8.7 E-8
Unit: events vehicle
-1km
-1 Fig. 3 Result of cluster analysis of accident frequency for roads of Kanto area.0.00 0.50 1.00 1.50 2.00 2.50 3.00 3.50
Reduced lane widths Congestion de gree Central reserv e ratio 24hour traf fi c Lane widths Peak hour traf fi c Peak hour av erage tra vel speed Speed limit Number of lane Accidents frequenc y
Attributes
Attrib utes v alue [-]
Cluster (1) Cluster (2) Cluster (3) Cluster (4) Cluster (5) Cluster (6)
Fig. 4 Normalized attribute values of each cluster.
Accident frequency Accident frequency
Cluster No. predicted value Yokohama road No. observed value M-W U-test [event vehicle-1 km-1] [event vehicle-1 km-1]
(1) 6.9 E-08 233 6.6 E-08 0.32
234 7.2 E-08
235 1.6 E-07
(2) 8.7 E-08 236 7.8 E-08 0.02
241 1.9 E-07
248 3.3 E-07
249 3.7 E-07
(3) 1.8 E-07 237 1.8 E-07 0.17
244 5.7 E-08
245 9.3 E-08
246 1.2 E-07
247 1.5 E-07
250 6.2 E-08
251 3.3 E-07
253 2.4 E-07
254 1.8 E-07
255 9.9 E-08
(4) 1.3 E-07 238 6.8 E-08 0.94
239 1.1 E-07
240 2.1 E-07
(5) 3.4 E-07 242 3.7 E-07 0.18
243 2.9 E-07
252 1.5 E-07
Table 3 Results of cluster analysis of accident frequency for roads of Yokohama.
5. Conclusion
The predicting method of the traffic accident frequency with the roads attribute values was investigated by using the cluster analysis technique. The cluster analysis of motor highways in Kanto area was performed based on the accidents data analysis of the motor highways in Japan.
The result of the cluster analysis was applied to the pre- diction of the accident frequency of the motor highways in Yokohama City, and the validity of the methodology was examined with the Mann-Whitney’s U-test. It was found that the predicted accident frequency showed a good agreement with the actual accident frequency data.
Acknowledgement
This work was supported by a Grant-in-Aid for Scientific Research from the Japan Ministry of Education, Sports, Culture, Science and Technology, and also by a Grant- in-Aid from the Foundation for the Promotion of the Industrial Explosives Technology of Japan.
References
1) F. P. Lees, Loss prevention in the process industries (2nd ed.), Butterworth Heinemann (1996).
2) Center for Chemical Process Safety, Guidelines for chemical process quantitative risk analysis (2nd ed.), AIChE (2000).
3) ADR (European Agreement concerning the International Carriage of Dangerous Goods by Road), Economic Commission for Europe (ECE / TRANS / 100), Inland Transport Committee, UN, New York (1993).
4) Center for Chemical Process Safety, Guidelines for chemical transport risk analysis, AIChE (1995).
5) Committee for the Prevention of Disasters, Guidelines for quantitative risk assessment (Purple Book), CPR 18E, Sdu Uitgevers (1999).
6) OECD and PIARC, Safety in tunnels-Transport of dangerous goods through road tunnels (2001).
7) P. Cassini, J. Hazardous Materials, 61, 133-138 (1998).
8) S. Contini, J. Hazardous Materials, 78, 223-245 (2000).
9) N. P. Hfj, and W. Kroger, Safety Science, 40, 337-357 (2002).
10) B. Fabiano, F. Curro, E. Palazzi, and R. Pastorino, J.
Hazardous Materials, 93, 1-15 (2002).
11) A. Miyake, K. Kumeta, and T. Ogawa, Proc. Asia-Pacific Symposium on Safety (APSS-2003), 385-387, Taipei (2003).
12) A. Miyake, J. Maekawa, K. Kumeta and T. Ogawa, Proc.
11th Int’l Symposium on Loss Prevention and Safety Promotion in the Process Industries, PG3176-3179, Prague (2004).
13) R. Bubbico, S. Di Cave, B. Mazzarotta, J. Loss Prev. Proc.
Ind., 17, 477-482 (2004).
14) Road Bureau, Road traffic census fiscal 1999, Ministry of Land, Infrastructure and Transport (2001).
15) Research Institute for Safety Engineering, Accident data of dangerous goods transportation on motor highway in Japan (2003).
16) H. C. Rosemburg, Cluster analysis for researches, pp.
264-267, p. 276 (1992), Uchida Rokakuho.
17) K-M. Lee, T. J. Herrman, J. Lingenfelser, and D. S. Jackson, J. Cereal Science, 41, 85-93 (2005).
18) B. Everitt, Graphical techniques for multivariate data, pp.
53-62 (1988), MPC.
19) D. E. Johnson, Applied multivariate methods for data analysts, Duxbury Press (1998).
クラスター分析を用いた危険物道路輸送における 事故発生頻度予測手法の検討
粂田佳奈,三宅淳巳†,小川輝繁
危険物道路輸送中の事故は人命,経済活動に重大な被害を与えるため,リスクアセスメントは事故防止や被 害抑制の意思決定のための有効かつ重要な方法である。危険物輸送時のリスクは事故発生頻度とその被害の2 つの要素から成るが,危険物積載車両の事故発生頻度を推測するためには,交通事故の発生頻度を推測するこ とが必要である。そこで本稿では,危険物道路輸送における事故頻度について,クラスター分析を用い,道路 の属性値から交通事故頻度を推測する手法について検討した。全国自動車専用道路における事故事例解析を基 に,関東地方の自動車専用道路についてクラスター分析を行った。クラスター分析の結果を横浜市の自動車専 用道路に適用し,Mann-Whitney の U 検定により手法の妥当性について検証した。その結果,クラスター分析 を基に推定した事故頻度と実測値に基づく検定は良好な一致を示した。
横浜国立大学大学院 工学研究院 〒 240-8501 横浜市保土ヶ谷区常盤台 79-5
†Corresponding address: atsumi@ynu.ac.jp