Nuclear karyopherin-α2 expression in primary lesions and metastatic lymph nodes was associated with poor prognosis and progression in gastric cancer
Bolag Altan, Takehiko Yokobori*, Erito Mochiki, Tetsuro Ohno, Kyoichi Ogata, Atsushi Ogawa, Mitsuhiro Yanai, Tsutomu Kobayashi,
Baigalimaa Luvsandagva
1, Takayuki Asao and Hiroyuki Kuwano
Department of General Surgical Science and 1Department of Obstetrics and Gynecology, Gunma University Graduate School of Medicine, Maebashi, Gunma 371-8511, Japan
*To whom correspondence should be addressed. Tel: +81 27 2208 224;
Fax: +81 27 2208 230;
Email: [email protected]
Karyopherin-α2 (KPNA2) functions as an adaptor that trans- ports several proteins to the nucleus. We investigated the clini- cal and functional significance of KPNA2 in gastric cancer (GC).
Immunohistochemistry was performed to examine KPNA2 expres- sion in primary GC and metastatic lymph nodes. Next, KPNA2 was suppressed by small interfering RNA (siRNA) to examine KPNA2 function in proliferation and cisplatin-induced apoptosis of GC cell lines. Nuclear expression of KPNA2 in marginal regions of primary GC was stronger than in central regions of GC and normal tissues.
The high expression of marginal KPNA2 was significantly associ- ated with β-catenin accumulation in the nucleus and poor prognosis in two independent GC cohorts (discovery cohort, n = 90, P = 0.018;
validation cohort, n = 89, P = 0.0125). We detected correlations between nuclear KPNA2 expression in marginal region and pro- gression of macroscopic type (P = 0.036), tumor depth (P = 0.013), lymph node metastasis (P = 0.0064), venous invasion (P = 0.034) and clinical stage (P = 0.0006). Nuclear KPNA2 expression in mar- ginal regions of metastatic lymph nodes was significantly higher than in the central region. It was associated with poor survival of GC patients with lymph node metastasis (n = 96; center, P = 0.4384;
marginal, P < 0.0001). KPNA2 suppression enhanced cisplatin- induced apoptosis and reduced proliferation in the KPNA2 siRNA group compared with the control siRNA group. The expression of the DNA repair gene NBS1 (NBN) in the nucleus was suppressed in KPNA2-suppressed cells. KPNA2 might be a useful prognostic marker and an effective therapeutic target for GC.
Introduction
Gastric cancer (GC) is now one of the most common malignancies worldwide (1,2). Despite the development and identification of novel anticancer agents and treatment methods, GC is still an aggressive malignancy. In patients with recurrent or refractory GC, the prognosis is poor (3). To prevent recurrence after curative resection and treat- ment with anticancer agents, cancer therapies must be improved.
In this study, we focused on karyopherin-α2 (KPNA2). We were the first to report the high expression level of the KPNA2 gene in GC com- pared with normal gastric mucosa using re-analysis of a GEO data- base. KPNA2 is thus recognized as a GC-specific gene (4,5). KPNA2 is a member of the importin family. It consists of an IBB domain, eight armadillo repeats that are involved in recognition and binding to nuclear localization signals and a C-terminal acidic domain (6).
Importin-α is a major component of nuclear pore complexes required for transporting various macromolecules larger than 50 KDa or other complex proteins (7,8). The nuclear transport signaling pathway was previously identified as important for tumorigenesis and tumor devel- opment in several cancers (8).
Recent studies have reported that KPNA2 functions as a novel oncogenic factor in human breast cancer and in non-small cell lung cancer (9,10). Moreover, high expression of KPNA2 was associated with poor prognosis and cancer progression in non-muscle-invasive bladder cancer (11), epithelial ovarian cancer (12) and esophageal squamous cell carcinoma (13). In comparison, the expression levels of KPNA2 were reported to be very low in various normal tissues (14,15). These reports suggest that KPNA2 represents a new thera- peutic target and a useful biomarker to predict malignant potential.
However, there is still inadequate information regarding KPNA2 expression and clinicopathological significance in GC.
The purpose of this study was to clarify KPNA2 function in GC cell lines in vitro. We also examined the clinical significance of KPNA2 in primary GC and metastatic lymph nodes. Therefore, immunohis- tochemistry was performed to evaluate the relationships between KPNA2 expression and clinicopathological significance in clinical GC samples. Finally, we examined the in vitro effects of small inter- fering RNA (siRNA)-mediated KPNA2 suppression on proliferation potency and cisplatin-induced apoptosis in human GC cell lines.
Materials and methods Clinical samples and cell lines
We used restricted primary GC tissues and pathological metastatic lymph nodes from 179 GC patients (127 males and 52 females) who underwent poten- tially curative surgery at Department of General Surgical Science, Gunma University Hospital, between 1996 and 2006. All clinical GC samples in this study were used in accordance with institutional guidelines and the Helsinki Declaration after obtaining written informed consent from all participants.
First, we randomly selected 90 patients from the 352 patients treated between January 1996 and August 2000. This group was regarded as the discovery cohort. Second, we randomly selected 90 patients from the 497 patients treated between September 2000 and December 2006. (One of the samples was lost.) This group was regarded as the validation cohort. Finally, we summed the two cohorts, which were regarded as the total cohort. In the total cohort, there were 158 primary GC samples in which the tumor depth was between submucosa (SM) and serosa infiltrating. With those samples, we examined the distribu- tion of KPNA2-high-expressing GC cells. This strategy was used because it was difficult to evaluate the distribution of mucosal cancer cells in the center and marginal regions. On the slide, the center of the tumor was defined as the central region and the invasive front was defined as the marginal region.
The median follow-up period was 45 months (range, 1–93 months). The clin- icopathological findings were based on the surgical records and pathology reports, and determined according to the Japanese Classification of Gastric Carcinoma outlined by the Japanese Gastric Cancer Association (16). The age of the patients ranged from 36 to 85 years with a mean of 64.2 ± 11.2 years.
Differentiated type (well and moderate differentiated) included 101 (56%) patients, and undifferentiated type (poorly differentiated and signet ring cells) included 78 (44%) patients. Tumor depth was classified into two categories:
early GC (including mucosa and SM), 39 (22%) patients, and advanced GC (including muscularis propria, subserosa, serosa exposed and serosa infiltrat- ing), 140 (78%) patients. Macroscopic type was classified in two categories:
localized type (including types 0, 1 and 2), 96 (54%) patients, and infiltrated type (including types 3, 4 and 5), 83 (46%) patients. Lymphatic and vascular invasion were divided into absent 43 (24%) patients and 94 (53%) patients, respectively, and positive 136 (76%) patients and 85 (47%) patients, respec- tively. Stages I, II, III and IV were 76 (43%), 36 (20%), 47 (26%) and 20 (11%) patients, respectively. Eleven resected adenoma samples were collected and analyzed to evaluate KPNA2 expression by immunohistochemistry as were GC samples.
Human GC cell lines KATO-III, MKN7, MKN45 and MKN74 were maintained in RPMI 1640 containing 10% fetal bovine serum and supplemented with 100 units/ml penicillin and streptomycin sulfate, and cultured in a humidified 5% CO2 incubator at 37°C.
Immunohistochemistry
The resected surgical specimens were fixed with 10% formaldehyde, embedded in paraffin blocks, cut into 4 μm thick sections and mounted Abbreviations: GC, gastric cancer; KPNA2, karyopherin-α2; siRNA, small
interfering RNA; SM, submucosa.
at Gunma University on May 20, 2014http://carcin.oxfordjournals.org/Downloaded from
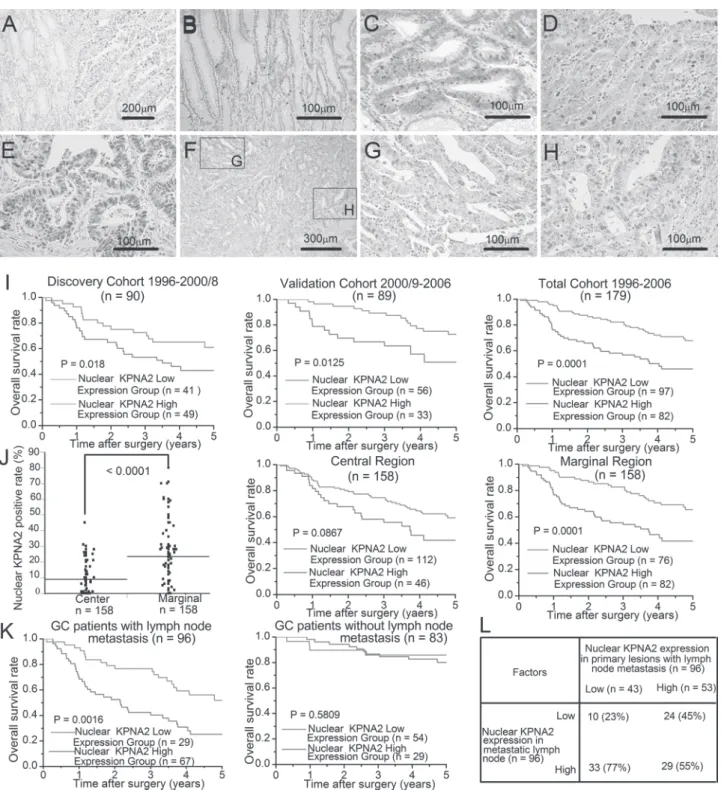
Fig. 1. Immunohistochemical staining of nuclear KPNA2 in primary GC. (A) Nuclear KPNA2 expression in GC and normal gastric mucosa (×20 magnification).
(B) Nuclear KPNA2 expression around crypt bottom of normal gastric gland (×20 magnification). (C–E) Nuclear KPNA2 expression in representative gastric adenoma, early GC and advanced GC section, respectively (×20 magnification). (F) Low-power view of nuclear KPNA2 localization in a representative advanced GC section (×5 magnification). (G and H) High-power view of the central region (G) and the marginal region (H) in a representative advanced GC section from Figure 1F (×20 magnification). (I) Cancer-specific survival curves of GC patients according to their nuclear KPNA2 expression scores. The survival rate of the high-nuclear KPNA2-expression group was significantly lower than that of the low-expression group in two independent GC cohorts (discovery cohort, n = 90, P = 0.018; validation cohort, n = 89, P = 0.0125). (J) Left panel: mean value of nuclear KPNA2 expression level in central region and marginal region of primary GC (P < 0.0001). Middle and right panels: cancer-specific survival frequencies of 158 patients (tumor depth > SM) according to the nuclear KPNA2 expression levels in the central region (P = 0.0867) and the marginal region (P = 0.0001), respectively. (K) Cancer-specific survival curves of GC patients with lymph node metastasis according to their nuclear KPNA2 expression scores (P = 0.0016). Cancer-specific survival curves of GC patients without lymph node metastasis according to their nuclear KPNA2 expression scores (P = 0.5809). (L) The relationships between nuclear KPNA2 expression in primary lesions and in metastatic lymph nodes of patients with pathological lymph node metastasis.
at Gunma University on May 20, 2014http://carcin.oxfordjournals.org/Downloaded from
on glass slides. The staining procedure was performed by standard strepta- vidin–biotin peroxidase complex methods. All sections were incubated at 60°C for 60 min and deparaffinized in xylene, rehydrated and incubated with fresh 0.3% hydrogen peroxide in 100% methanol for 30 min at room temperature to block endogenous peroxidase activity. After rehydration through a graded series of the ethanol treatments, antigen retrieval was car- ried out in 10 mM citrate buffer (pH 6.4) at 98–100°C for 20 min, and then sections were passively cooled to 30°C. After rinsing the section in 0.1 M phosphate-buffered saline (pH 7.4), non-specific binding sites were blocked by incubation with 10% normal rabbit or goat serum for 30 min. The sec- tions were then incubated with goat anti-KPNA2 polyclonal antibody (Santa Cruz Biotechnology), rabbit anti-β-catenin (6B3) monoclonal antibody (Cell Signaling Technology) and rabbit anti-Ki67 (Clone SP6) monoclonal antibody (Thermo Scientific) at a dilution of 1:200 in phosphate-buffered saline containing 1% bovine serum albumin overnight at 4°C and at room temperature for 30 min. The sections were washed in phosphate-buffered saline, incubated with biotinylated anti-mouse IgG, A and M solution (Nichirei Co., Tokyo, Japan) for 30 min at room temperature and finally incubated in a streptavidin–biotin peroxidase complex solution (Nichirei Co.) for 30 min. Chromogen, 3,3-diaminobenzidine tetrahydrochloride, was applied as a 0.02% solution containing 0.005% hydrogen peroxide in a 50 mM ammonium acetate–citrate acid buffer (pH 6.0). The sections were lightly counterstained in Mayer’s hematoxylin and mounted. It was reported that esophageal squamous cell carcinomas expressed high levels of KPNA2 (13). Thus, we conducted KPNA2 immunostaining procedures on four esophageal squamous cell carcinoma samples as positive controls and negative controls with the methods described in this study.
Evaluation of immunostaining
Immunohistochemical slides were scanned and evaluated by two experienced researchers; the inter-observed κ value was 0.839. The intensity of nuclear KPNA2 and β-catenin stains was scored as follows: 0, no staining; 1+, weak staining; 2+, moderate staining and 3+, strong staining. The percentage of
nuclear stained cells was calculated by examining at least 2000 cancer cells in 10 representative areas. The nuclear KPNA2 and nuclear β-catenin staining percentages were scored as follows: 0, no staining; 1+, ~1–10%; 2+, ~11–50%
and 3+, ~51–100%. The score was defined as the percentage score multiplied by the intensity score (0, 1+, 2+, 3+, 4+, 6+ and 9+). The optimal cut-off point for predicting CG patients’ survival time according to the KPNA2 expression was defined as the high (4+, 6+ and 9+) or the low (0, 1+, 2+ and 3+) expres- sion group in the discovery cohort. Clinical significance of the cut-off value was validated in the validation cohort. The percentage of Ki-67-stained cells was calculated by examining at least 2000 cancer cells in 10 representative areas (×200), where 1+ (<2%), 2+ (~3–20%) and 3+ (>20%). They were then classified into low (1+ and 2+) or high (3+) expression groups.
KPNA2 RNA interference
KPNA2-specific siRNAs (silencer™ pre-designed siRNA 1: CAGAUACCUG CUGGGCUAUUUCCUA and siRNA 2: ACCUGCUGGGCUAUUUCCUAC CUUA) and a scrambled siRNA as a negative control (siTrio negative control 1) were purchased from Invitrogen and Hokkaido System Science, respec- tively. MKN7 and the MKN45 cell lines were seeded at 1 × 10⁵ cells per well in a volume of 2 ml in six-well flat bottom plates and incubated in a humidified atmosphere (37°C and 5% CO2). After 24 h of incubation, 500 μl Opti-MEM I reduced-serum medium liquid (Invitrogen), 5 μl lipofectamine RNAiMAX and siRNA (scrambled siRNA or KPNA2 siRNAs) were mixed and incubated for 20 min. Then, the reagents were added to each well. The RNA interference assay was performed after 24 h of incubation.
Protein extraction and western blot analysis
Western blotting was used to confirm the expression of KPNA2 and β-actin proteins in GC cell lines. Total proteins were extracted from KATO-III, MKN7, MKN45 and MKN74 with PROPREP™ protein extraction solution (iNtRON Biotechnology). Total protein was electrophoresed through Nu pol- yacrylamide gel electrophoresis 4–12% Bis–Tris gels (Invitrogen) and then electrotransferred to polyvinylidene difluoride membranes using an iBlot Gel Transfer Device. The membrane was blocked with 5% skim milk and the pro- teins were detected using anti-KPNA2 goat polyclonal antibody (1:1000) and anti-NBS1 rabbit monoclonal antibody (1:1000; Cell Signaling Technology);
anti-β-actin mouse monoclonal antibody (clone AC-74; Sigma) diluted 1:1000 served as a control. Bands and band intensity were detected and calculated using ECL Prime Western Blotting Detection Reagent and Image Quant LAS 4000.
Table I. KPNA2 expression and clinicopathological factors from 179 GC patients
Factors KPNA2 expression (n = 179)
Low High P value
n = 97 n = 82
Age 63.5 ± 10.2 65.0 ± 10.1 0.31
Gender 0.27
Male 66 (52.0%) 61 (48.0%)
Female 31 (59.6%) 21 (40.4%)
Macroscopic type 0.036*
Localized 59 (61.5%) 37 (38.5%)
Infiltrated 38 (45.8%) 45 (54.2%)
Histology 0.26
Well, moderate 51 (50.5%) 50 (49.5%)
Poor, signet 46 (59.0%) 32 (41.0%)
Tumor depth 0.013*
Mucosa, SM 28 (71.8%) 11 (28.2%)
Muscularis propria, subserosa, serosa exposed, serosa infiltrating
69 (49.3%) 71 (50.7%)
Lymph node metastasis 0.0064*
Absent 54 (65.1%) 29 (34.9%)
Present 43 (44.2%) 53 (55.8%)
Lymphatic invasion 0.096
Absent 28 (65.1%) 15 (34.9%)
Present 69 (50.7%) 67 (49.3%)
Venous invasion 0.034*
Absent 58 (61.7%) 36 (38.3%)
Present 39 (45.9%) 46 (54.1%)
Stage 0.0006*
I 50 (65.8%) 26 (34.2%)
II 21 (58.3%) 15 (41.7%)
III 23 (48.9%) 24 (51.1%)
IV 3 (15.0%) 17 (85.0%)
Moderate, moderately differentiated; poor, poorly differentiated; signet, signet ring cell; well, well differentiated.
*P < 0.05
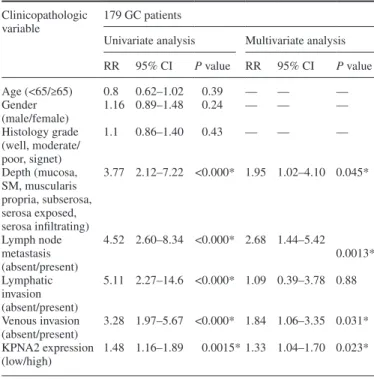
Table II. Univariate and multivariate analyses of clinicopathological factors affecting cancer-specific survival rates following surgery
Clinicopathologic variable
179 GC patients
Univariate analysis Multivariate analysis RR 95% CI P value RR 95% CI P value
Age (<65/≥65) 0.8 0.62–1.02 0.39 — — —
Gender
(male/female) 1.16 0.89–1.48 0.24 — — —
Histology grade (well, moderate/
poor, signet)
1.1 0.86–1.40 0.43 — — —
Depth (mucosa, SM, muscularis propria, subserosa, serosa exposed, serosa infiltrating)
3.77 2.12–7.22 <0.000* 1.95 1.02–4.10 0.045*
Lymph node metastasis (absent/present)
4.52 2.60–8.34 <0.000* 2.68 1.44–5.42 0.0013*
Lymphatic invasion (absent/present)
5.11 2.27–14.6 <0.000* 1.09 0.39–3.78 0.88
Venous invasion (absent/present)
3.28 1.97–5.67 <0.000* 1.84 1.06–3.35 0.031*
KPNA2 expression (low/high)
1.48 1.16–1.89 0.0015* 1.33 1.04–1.70 0.023*
CI, confidence interval; moderate, moderately differentiated; poor, poorly differentiated; RR, relative risk; signet, signet ring cell; well, well differentiated.
*P < 0.05.
at Gunma University on May 20, 2014http://carcin.oxfordjournals.org/Downloaded from
Cell proliferation assay
Cell proliferation analysis was performed on MKN7 and MKN45 cells, both the transfected negative control and KPNA2 siRNA-treated cells. These cells were cultured in 96-well microtiter plates in 100 μl of medium containing 10% fetal bovine serum at 3 × 10³ cells per well. After initial cell seeding, the cell viability was analyzed using a Cell Counting Kit-8 (Dojindo Laboratories, Tokyo, Japan). Ten microliters of the cell counting solution was added to each well after 0, 24, 48, 72, 96 and 120 h and incubated at 37°C in a humidi- fied 5% CO2 atmosphere for 2 h. The cell proliferation rates were determined at 450 nm using an Emax-precision microtiter plate reader (Molecular Devices, Sunnyvale, CA). All results were derived from six sets of duplicated experiments.
Apoptosis assay
MKN7 cells transfected with KPNA2 siRNA were dispensed into 96-well plates. Twenty-four hours after the initial seeding, cisplatin was added for 48 h (cisplatin: final concentrations, 0, 1.0, 10, 100 and 1000 μM), and then cisplatin-induced apoptosis was evaluated using the fluorometric ApoOne Homogeneous Caspase-3/7 Assay (Promega Corporation, Madison, WI). All samples were performed in duplicate.
Statistical analysis
Statistically significant differences were analyzed with Student’s t-test for continuous variables and the chi-square test for categorical variables.
Survival curves were generated according to the Kaplan–Meier method.
The differences between survival curves were examined using the log-rank test. In addition, univariate and multivariate survival analyses were per- formed using Cox’s proportional hazards model. Analysis of variance was used to assess the statistical significance of in vitro assays. Results were considered statistically significant when the relevant P value was <0.05.
All statistical analyses were performed using JMP 5.0 software (SAS Institute, Cary, NC).
Results
Nuclear KPNA2 protein expression in primary GC
The expression levels of KPNA2 protein in the nucleus were higher than those in the cytoplasm and were higher in GC tissues than in the normal gastric gland (Figure 1A). High expression of nuclear
KPNA2 was observed in 0% (0/179) of normal gastric mucosa, 36.4% (4/11) of adenomas, 28.2% (11/39) in early GC and 50.7%
(71/140) of advanced GC (Figure 1B–E; Supplementary Table 1, available at Carcinogenesis Online). The expression levels of nuclear KPNA2 were stronger in marginal regions than in central regions (Figure 1F–H). Esophageal squamous cell carcinoma samples were stained with KPNA2 antibody as positive and negative control sec- tions (Supplementary Figure A and B, available at Carcinogenesis Online).
Clinicopathologic significance of nuclear KPNA2 expression in primary GC
The high expression levels of nuclear KPNA2 in 179 GC tissues were significantly associated with progression of macroscopic type (P = 0.036), tumor depth (P = 0.013), lymph node metas- tasis (P = 0.0064), venous invasion (P = 0.034) and clinical stage (P = 0.0008; Table I).
Overall survival in the nuclear KPNA2-high-expression group (n = 49) of the discovery cohort (n = 90) was significantly shorter than that of the low-expression group (n = 41, P = 0.018). With the validation cohort, the overall survival in the KPNA2-high- expression group (n = 33) was significantly shorter than that of the low-expression group (n = 56, P = 0.0125; Figure 1I). The same results were observed in the total cohort (n = 179, P = 0.0001;
Figure 1I). The multivariate regression analysis revealed that high expression of nuclear KPNA2 in 179 GC samples was an independent prognostic factor (P = 0.023) as were tumor depth (P = 0.045), lymph node metastasis (P = 0.0013) and venous inva- sion (P = 0.031; Table II).
Prognostic value of nuclear KPNA2 was stronger in the marginal region than in the central region
In the 158 invasive primary GC samples (SM ≤ tumor depth), the frequency of patients who were positive for nuclear KPNA2 was significantly higher in the marginal regions than in the central
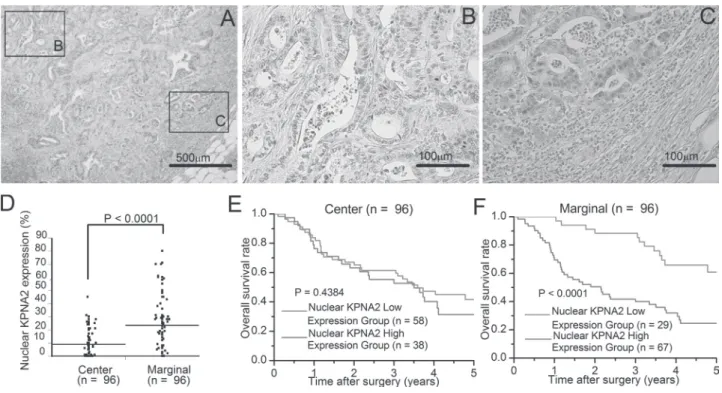
Fig. 2. Immunohistochemical staining of nuclear KPNA2 in metastatic lymph nodes. (A) Low-power view of nuclear KPNA2 localization in a representative metastatic lymph node of advanced GC (×20 magnification). (B) High-power view of central region of Figure 2A. (C) High-power view of marginal region of Figure 2A. (D) Mean value of nuclear KPNA2 expression level in central and marginal regions of metastatic lymph node metastasis (n = 96; P < 0.0001).
(E and F) Cancer-specific survival rates of 96 patients with pathological metastatic lymph node metastasis according to the nuclear KPNA2 expression levels in the central (P = 0.4384) and marginal (P = 0.0001) regions of metastatic lymph node sections, respectively.
at Gunma University on May 20, 2014http://carcin.oxfordjournals.org/Downloaded from
region (P < 0.0001; Figure 1J). We determined the relationship between the overall survival rates of the 158 invasive primary GC patients and nuclear KPNA2 expression in the marginal and central regions. Patients with high nuclear KPNA2 in marginal regions had a significantly poorer prognosis than those with low nuclear KPNA2 (P = 0.0001). In contrast, the expression of nuclear KPNA2 in the central region was not associated with poor prognosis (Figure 1J).
Nuclear KPNA2 expression in 96 GC tissues with lymph node metastasis and in metastatic lymph nodes
Among the 179 GC patients, pathological metastatic lymph nodes were diagnosed in 96 patients. The expression levels of nuclear KPNA2 in the primary lesions of those 96 patients were higher than in the primary lesions of 83 patients lacking metastatic lymph nodes.
The survival rate of the group with high expression of nuclear KPNA2 in the primary lesions with lymph node metastasis (n = 96) was sig- nificantly higher than those of the low-expression group (P = 0.0016;
Figure 1K). In that same group of 96 patients, 33 of 43 (77%) patients, who showed low expression of nuclear KPNA2 in the primary lesion, had high expression of KPNA2 in the metastatic lymph nodes (Figure 1L).
Nuclear KPNA2 expression in metastatic lymph nodes of GC
As observed in primary GC tissues, the nuclear expression levels of KPNA2 in the metastatic lymph nodes were stronger in marginal regions than in central regions (Figure 2A–C). The frequency of KPNA2-positive nuclei in the 96 formalin-fixed paraffin-embedded sections of metastatic lymph nodes was significantly higher in mar- ginal regions than in central regions (P < 0.0001; Figure 2D). Next, we examined the relationships between overall survival rates and nuclear KPNA2 expression in the marginal and central region of met- astatic lymph nodes. As was the case with primary GC data, patients with high nuclear expression of KPNA2 in marginal regions of meta- static lymph nodes had a significantly poorer prognosis than those with low nuclear expression of KPNA2 (P < 0.0001; Figure 2F), and the expression of nuclear KPNA2 in central regions was not associ- ated with poor prognosis (Figure 2E).
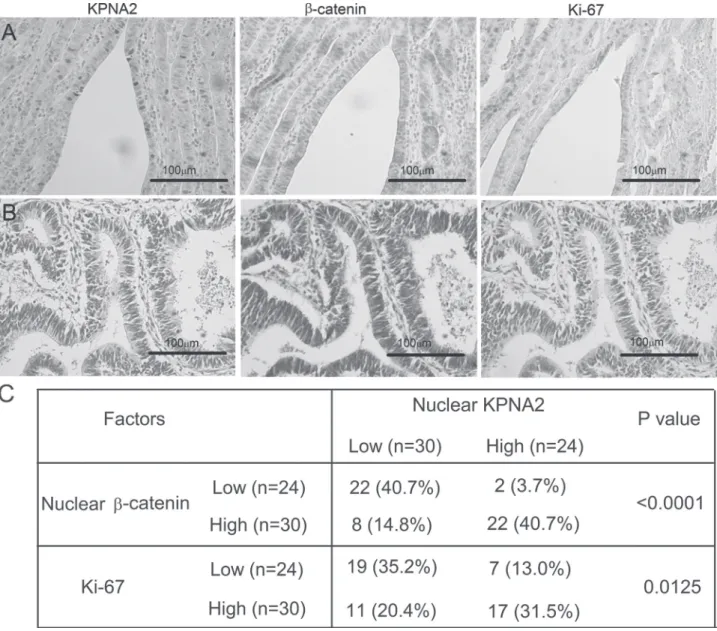
Relationships between nuclear KPNA2 expression and accumulation of nuclear β-catenin and Ki-67 expression
Among the 179 GC samples immunostained with KPNA2 antibody, we were able to obtain several serial sections from 54 GC patients.
Therefore, we examined the relationships between nuclear β-catenin,
Fig. 3. Correlation of nuclear KPNA2, nuclear β-catenin and Ki-67 expression in primary GC. (A) Nuclear β-catenin and Ki-67 expression in representative serial GC sections with high nuclear KPNA2 expression. (B) Cytoplasmic β-catenin and Ki-67 expression in representative serial GC sections with low nuclear KPNA2 expression. (C) The relationships between nuclear KPNA2 expression, nuclear β-catenin and Ki-67 expression in 54 serial GC sections.
at Gunma University on May 20, 2014http://carcin.oxfordjournals.org/Downloaded from
Ki-67 and nuclear KPNA2. High expression of KPNA2 in the serial sections was observed in 44% (24/54) of the patients. We found that accumulation of nuclear β-catenin [91.6% (22/24)] and expression of Ki-67 [70.8% (17/24)] in the region of high nuclear KPNA2 staining were both greater than in low expression regions (P < 0.0001 and P = 0.0125; Figure 3A–C). Importantly, the expression of β-catenin in the low KPNA2 sections was restricted to the cytoplasm.
KPNA2 regulates proliferation potency and cisplatin-induced apoptosis in GC cell lines
We evaluated KPNA2 expression levels in KATO-III, MKN7, MKN45 and MKN74 cell lines by western blot (Figure 4A). KPNA2 expres- sion was detected in all GC cell lines. Therefore, we used MKN7 and MKN45 to analyze the effects of KPNA2 suppression in GC cell lines in vitro.
We transfected KPNA2 siRNAs into MKN7 and MKN45 for up to 192 h to strongly knockdown KPNA2 protein. KPNA2 expression was suppressed in MKN7 and MKN45 cells treated with KPNA2
siRNA1 and siRNA2 (Figure 4B). The proliferation potency in groups treated with KPNA2 siRNA was significantly suppressed (Figure 4C).
NBS1 is a component of the MRE11-RAD50-NBS1 complex, a central player associated with repair of double-strand breaks. The expression of NBS1 in the nucleus was suppressed in the KPNA2 siRNA group compared with the control siRNA group (Figure 4D).
After knocking down KPNA2 for a second 96 h, we measured cas- pase-3 and caspase-7 activities to evaluate apoptosis induction in KPNA2-suppressed groups that had been treated with cisplatin (0, 1, 10, 100 and 1000 μM). As a result, the caspase activity in KPNA2- suppressed groups was apparently higher than that in the parent and the control cells (Figure 4E).
Discussion
In this study, we showed that the high expression of KPNA2 in pri- mary GC samples was associated with cancer progression and poor Fig. 4. Functional analysis of human GC cell lines treated with KPNA2 siRNA. (A) Expression of KPNA2 protein was detected in KATO-III, MKN7,
MKN45 and MKN74 cells by western blotting. β-actin was used as the loading control. Intensity was measured using Image Quant LAS 4000. (B) KPNA2 protein expression in MKN7 and MKN45 treated with KPNA2 siRNA1 or siRNA2 was detected by western blot. KPNA2 expression was suppressed in both KPNA2 siRNA1- and siRNA2-treated cells. β-actin was used as the loading control. Intensity was measured using Image Quant LAS 4000. (C) Proliferation of MKN7 and MKN45 cells after siRNA treatment for 96 and 192 h (siRNA transfection at 96 and 192 h after seeding). N-C: negative control (scrambled siRNA). (D) Western blot analysis of KPNA2 or NBS1 in total protein and nucleoprotein from KPNA2 siRNA cells and scrambled siRNA cells. These proteins were normalized to the level of β-actin. (E) Apoptosis induced in the KPNA2 siRNA-treated cells was enhanced compared with the control and parent cells.
N-C: negative control (scrambled siRNA), 192 h; KPNA2 siRNA transfection at 96 and 192 h after seeding.
at Gunma University on May 20, 2014http://carcin.oxfordjournals.org/Downloaded from
prognosis. Patients with high KPNA2 expression in marginal regions of primary GC and metastatic lymph nodes had poorer prognosis than low-expression groups. In our in vitro KPNA2 suppression analysis, significant cisplatin-induced apoptosis and reduced proliferation were observed in the KPNA2 siRNA treatment groups compared with the other groups.
Macromolecules larger than about 50 KDa or complex proteins, including cancer-related proteins, usually require multiple path- ways to deliver them into the nucleus (7). The KPNA2 nuclear import pathway is frequently activated in various cancers and is associated with tumorigenesis and cancer progression (9–12,17).
Moreover, KPNA2 is more highly expressed in various cancers than in normal tissues, and high expression of KPNA2 has pre- viously been confirmed as a predictor of poor prognosis in dif- ferent cancers (10,12,13,18,19). KPNA2 transports the cancer progression-related gene product NBS1 into the nucleus. NBS1 was reported to be associated with poor prognosis and the epithe- lial–mesenchymal transition via Snail induction in head and neck cancer (17,20,21). Snail, downstream from transforming growth factor-β, reportedly induces epithelial–mesenchymal transition through E-cadherin repression and nuclear β-catenin accumulation in several cancers (22). These reports suggested that KPNA2 might be associated with Wnt/β-catenin signaling. Therefore, we exam- ined the correlation of KPNA2, Ki-67 and β-catenin in clinical GC samples. We found that nuclear β-catenin and Ki-67 were sig- nificantly coexpressed in clinical GC samples expressing KPNA2.
Wnt/β-catenin activation in GC has been found in about 30% of patients and is related to GC progression (23,24). From these data, it was suggested that KPNA2 was at least partially responsible for inducing nuclear β-catenin accumulation and Wnt/β-catenin sign- aling activation in GC via the KPNA2/NBS1/Snail axis. Wnt/β- catenin signaling regulated by KPNA2 might be one of the causes of GC progression.
KPNA2 expression was stronger in marginal regions of primary GC and metastatic lymph nodes. Few studies have analyzed the mechanism of KPNA2 regulation in GC. In normal, transformed and cervical cancer cells, the E2F/Dp1 heterodimer upregulates KPNA2 expression by activation of the KPNA2 promoter (25). E2F activ- ity is regulated by extracellular growth factors, including hepato- cyte growth factor or basic fibroblast growth factor (26). Therefore, KPNA2 expression might be regulated by cancer stromal cells via secretion of one or more growth factors. Nuclear KPNA2 expression was higher in the marginal regions of GC tissues associated with can- cer stromal cells. Moreover, cancer cells in the marginal regions of the tumor reportedly acquire cancer stem cell features via hepatocyte growth factor stimulation. Hepatocyte growth factor is secreted by cancer stromal cells, including cancer-associated fibroblasts in colon cancer and esophageal cancer (27,28). From these observations, we suggest that KPNA2 expression in the marginal regions of primary GC and metastatic lymph nodes might be regulated by growth factors originating from cancer stromal cells.
In this study, it was important to develop a prognostic tool for GC patients to predict the risk of recurrence after curative resection. In a large-scale clinical study, it was reported that adjuvant chemotherapy for GC with lymph node metastasis is an effective treatment for recurrence prevention after curative operation (29). Importantly, half of the patients with metastatic lymph nodes were completely cured by surgery alone, although these patients would normally receive adjuvant chemotherapy treatment. On the other hand, some patients have recurred in spite of receiving adjuvant chemotherapy. In this study, we found that high expression of nuclear KPNA2 in marginal regions of metastatic lymph nodes was predominantly correlated with poor prognosis. Hence, KPNA2 may be a marker capable of identifying patients with a high risk of recurrence and more reliably indicate postoperative adjuvant therapy.
In conclusion, the expression of nuclear KPNA2 correlated with GC progression. KPNA2 expression could be a useful prognostic marker for GC, especially for lymph node-positive GC patients. In addition, KPNA2 regulated GC cell proliferation and resistance to
cisplatin in in vitro analysis. With respect to developing new molecu- lar cancer therapies, KPNA2 might be a promising candidate for tar- geted therapy in GC.
Supplementary material
Supplementary Table 1 and Figure A and B can be found at http://
carcin.oxfordjournals.org/
Funding
Grants-in-Aid for Scientific Research from the Japan Society for the Promotion of Science (22591450, 22591449, 23591857 and 30546726).
Acknowledgements
We thank Ms Y.Saito, Ms M.Shin, Ms T.Yano, Ms M.Ohno, Ms S.Muraoka, Ms Y.Matsui and Ms A.Ishida for their excellent assistance.
Conflict of Interest Statement: None declared.
References
1. Jemal,A. et al. (2011) Global cancer statistics. CA. Cancer J. Clin., 61, 69–90.
2. Parkin,D.M. et al. (2005) Global cancer statistics, 2002. CA. Cancer J. Clin., 55, 74–108.
3. Ohtsu,A. et al. (2006) Disparities in gastric cancer chemotherapy between the East and West. J. Clin. Oncol., 24, 2188–2196.
4. Yokobori,T. et al. (2010) Clinical significance of stanniocalcin 2 as a prog- nostic marker in gastric cancer. Ann. Surg. Oncol., 17, 2601–2607.
5. D’Errico,M. et al. (2009) Genome-wide expression profile of sporadic gas- tric cancers with microsatellite instability. Eur. J. Cancer, 45, 461–469.
6. Chook,Y.M. et al. (2001) Karyopherins and nuclear import. Curr. Opin.
Struct. Biol., 11, 703–715.
7. Davis,L.I. (1995) The nuclear pore complex. Annu. Rev. Biochem., 64, 865–896.
8. Lange,A. et al. (2007) Classical nuclear localization signals: defini- tion, function, and interaction with importin alpha. J. Biol. Chem., 282, 5101–5105.
9. Noetzel,E. et al. (2012) Nuclear transport receptor karyopherin-α2 pro- motes malignant breast cancer phenotypes in vitro. Oncogene, 31, 2101–2114.
10. Wang,C.I. et al. (2011) Importin subunit alpha-2 is identified as a potential biomarker for non-small cell lung cancer by integration of the cancer cell secretome and tissue transcriptome. Int. J. Cancer, 128, 2364–2372.
11. Jensen,J.B. et al. (2011) High expression of karyopherin-α2 defines poor prognosis in non-muscle-invasive bladder cancer and in patients with invasive bladder cancer undergoing radical cystectomy. Eur. Urol., 59, 841–848.
12. Zheng,M. et al. (2010) Overexpression of karyopherin-2 in epithelial ovar- ian cancer and correlation with poor prognosis. Obstet. Gynecol., 116, 884–891.
13. Sakai,M. et al. (2010) Significance of karyopherin-{alpha} 2 (KPNA2) expression in esophageal squamous cell carcinoma. Anticancer Res., 30, 851–856.
14. Nadler,S.G. et al. (1997) Differential expression and sequence-specific interaction of karyopherin alpha with nuclear localization sequences. J.
Biol. Chem., 272, 4310–4315.
15. Tsuji,L. et al. (1997) Identification of novel homologues of mouse importin alpha, the alpha subunit of the nuclear pore-targeting complex, and their tissue-specific expression. FEBS Lett., 416, 30–34.
16. Japanese Gastric Association. (1998) Japanese classification of gastric car- cinoma: 2nd English edition. Gastric Cancer, 1, 15.
17. Teng,S.C. et al. (2006) Importin KPNA2, NBS1, DNA repair and tumori- genesis. J. Mol. Histol., 37, 293–299.
18. Gluz,O. et al. (2008) Nuclear karyopherin alpha2 expression predicts poor survival in patients with advanced breast cancer irrespective of treatment intensity. Int. J. Cancer, 123, 1433–1438.
19. Winnepenninckx,V. et al. (2006) Gene expression profiling of primary cutaneous melanoma and clinical outcome. J. Natl Cancer Inst., 98, 472–482.
at Gunma University on May 20, 2014http://carcin.oxfordjournals.org/Downloaded from
20. Yang,M.H. et al. (2007) Overexpression of NBS1 induces epithelial-mes- enchymal transition and co-expression of NBS1 and Snail predicts metas- tasis of head and neck cancer. Oncogene, 26, 1459–1467.
21. Tseng,S.F. et al. (2005) Importin KPNA2 is required for proper nuclear localization and multiple functions of NBS1. J. Biol. Chem., 280, 39594–39600.
22. Kudo-Saito,C. et al. (2009) Cancer metastasis is accelerated through immunosuppression during Snail-induced EMT of cancer cells. Cancer Cell, 15, 195–206.
23. Oshima,H. et al. (2006) Carcinogenesis in mouse stomach by simulta- neous activation of the Wnt signaling and prostaglandin E2 pathway.
Gastroenterology, 131, 1086–1095.
24. Clements,W.M. et al. (2002) Beta-Catenin mutation is a frequent cause of Wnt pathway activation in gastric cancer. Cancer Res., 62, 3503–3506.
25. Watt,P.J., et al. (2011) Overexpression of Kpnbeta1 and Kpnalpha2 impor- tin proteins in cancer derives from deregulated E2F activity. PLoS One, 6, e27723.
26. Halaban,R. et al. (2000) Deregulated E2F transcriptional activity in auton- omously growing melanoma cells. J. Exp. Med., 191, 1005–1016.
27. Vermeulen,L. et al. (2010) Wnt activity defines colon cancer stem cells and is regulated by the microenvironment. Nat. Cell Biol., 12, 468–476.
28. Grugan,K.D. et al. (2010) Fibroblast-secreted hepatocyte growth factor plays a functional role in esophageal squamous cell carcinoma invasion.
Proc. Natl Acad. Sci. USA, 107, 11026–11031.
29. Sakuramoto,S. et al. (2007) Adjuvant chemotherapy for gastric cancer with S-1, an oral fluoropyrimidine. N. Engl. J. Med., 357, 1810–1820.
Received March 13, 2013; revised May 18, 2013; accepted May 30, 2013
at Gunma University on May 20, 2014http://carcin.oxfordjournals.org/Downloaded from