<論 説>
The Development of Border Economic Zones:
The Economic Potentiality of Asia’s Golden Triangle
*Satoko Okuyama†
Contents 1.Introduction 2.The Golden Triangle
2.1 Geography and History 2.2 Impediments to Development 2.3 Economic Overview
3.Progress of the Greater Mekong Subregion Program and ASEAN’s Free Trade Agreement Network
3.1 The Greater Mekong Subregion Program
3.2 Expansion of ASEAN’s Free Trade Agreement Network 3.3 Foreign Direct Investment
3.4 Rising Importance of China in Thailand, Myanmar, and Laos 4.Economic Potentiality of the Golden Triangle
4.1 Development of the Golden Triangle Area 4.2 Border Trade in Northern Thailand
4.3 Economic Growth Factors Affecting the Golden Triangle 5.Conclusions
1.Introduction
The Golden Triangle(GT)is a zone bordering Thailand, Myanmar, and Laos. This area, espe- cially Myanmar, is famous for opium products. The residents of this area are poor and earn their living through opium production. One of the reasons contributing to the poverty in this area is its poor accessibility on account of its inland location. However, financial and technical support from the Asian Development Bank(ADB), Japan, and China to Thailand, Myanmar and Laos has helped infrastructure development and thus, has improved accessibility to some extent. Such aid has also helped increase the economic potentiality of this area. In this paper, we discuss the eco- nomic environment of the GT and explore its economic potentiality.
In section 2, we will briefly discuss the geography, history, and economic environment of the GT. As stated earlier, the GT is an area bordering Thailand, Myanmar, and Laos. These countries
are members of the Association of Southeast Asian Nations(ASEAN). Recently, ASEAN success- fully negotiated a Free Trade Agreement(FTA)with other countries. The Greater Mekong Subregion(GMS)Program being implemented by the ADB helps promote subregional eco- nomic cooperation and enhances economic relations among the countries. Thailand, Myanmar, and Laos are also included in the GMS program. The program promotes Foreign Direct Invest- ment(FDI)flows to these countries and enhances border trade in the GT. It has facilitated the implementation of infrastructure projects in this area. Later, in section 3, we will explain in detail the economic factors, resulting from the ASEAN FTA and the GMS program, that are responsible for improved economic growth in this area. In Section 4, we examine border trade in the area and its economic potentiality as a whole. Section 5 concludes.
2.The Golden Triangle
In this section, we will review the geography and history of the GT and provide three reasons for its delayed development. We will also provide an economic overview of the GT, and focus on the intraregional gaps among the countries surrounding the GT, namely, Thailand, Myanmar, and Laos.
2.1 Geography and History
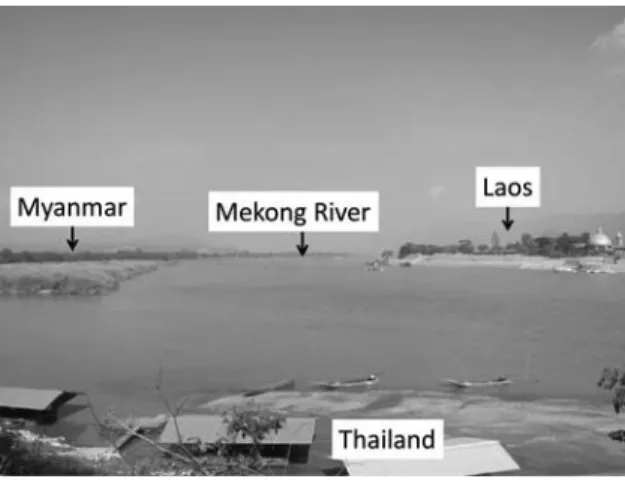
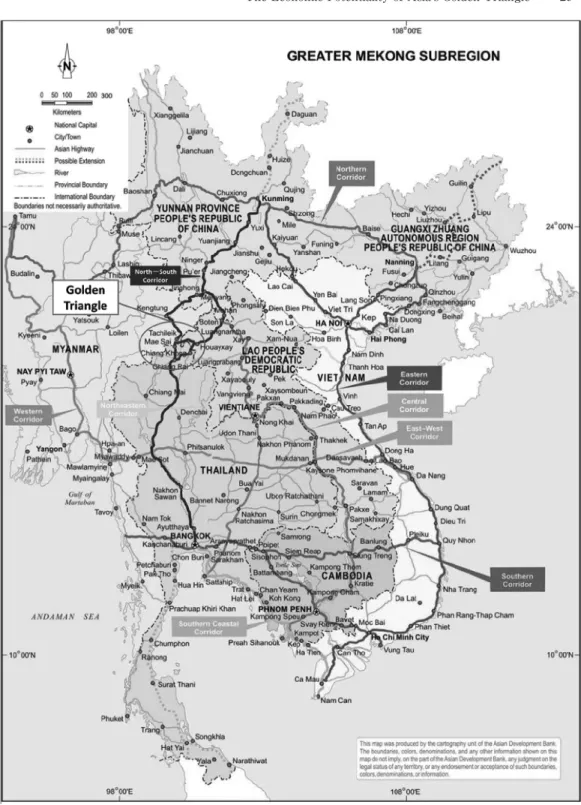
First, we examine the geographical features of the GT. The GT is an area bordering Thailand, Myanmar, and Laos(Figure 1). It includes a part of northern Thailand, northwestern Laos, and eastern Myanmar(Figure 2). The Yunnan province of China lies to the north of the GT. To- gether with the Yunnan province, the GT area has recently come to be known as the Golden
Quadrangle.
Let us now look at the border towns around the GT area. These towns have de- veloped with a focus on Thailand. The Sai River lies between Thailand and Myanmar.
There is a small bridge over the river, which has been used by the people of Thailand and Myanmar since early times.
The Thai border town is Mae Sai while Myanmar’s border town is Tachileik. The Mekong River lies between Thailand and Laos, with Chiang Khong being the Thai
Source: Author
Figure 1 The Golden Triangle
border town, and Houeixay, the Laos border town. The Thai-Lao Friendship Bridge is the first bridge connecting Chiang Khong to Houeixay. Although Thailand and China are not neighbors, people can travel from Jinghong(Yunnan)to Chiang Saen(Thailand)by ship over the Mekong River.
Mae Sai, Chiang Khong, and Chiang Saen are located in the Chiang Rai province in northern Thailand. The Gross Regional Product(GRP)per capita of Chiang Rai in 2009 was 48,744 Thai baht(THB), which is less than one-eighth of the GRP of Bangkok(THB 427,502)(NESDB
(2012)). Thus, the people who live in this area are poorer than those in Bangkok.
Source: Adapted from the ADB Technical Assistance Consultant’s Report(2012). Figure 2 Map of the Golden Triangle
The Economic Potentiality of Asia’s Golden Triangle 23
China’s Yunnan province is located inland in a mountainous area and has hence, seen little de- velopment. The GRP per capita of Yunnan in 2011 was 19,203 Chinese Yuan(CNY), which is less than one-fourth of the GRP of Beijing(the capital of China), CNY 80,495(China Statistical Yearbook 2012). The largest city in Yunnan province is Kunming. Roads connecting Yunnan to Bangkok and to the ports in Myanmar, which export to India and Europe, are important focal points for development of the province.
2.2 Impediments to Development
The GT is historically famous for its opium production. In Myanmar, opium production in- creased between 2007 and 2010(World Drug Report(2011)). In Thailand, however, opium pro- duction decreased during the same period because of the severe restrictions imposed by the gov- ernment. The people who live in this area are very poor and make a living through opium produc- tion. The Thai government encouraged people to switch to other profitable crops, such as coffee and tea. However, the situation remains unchanged in Myanmar and Laos.
Two factors have impeded development of this area, the first being poor accessibility. The GT area has many mountains and rivers and so, is isolated from other areas. In addition, as this area is inland and far from the sea, it is inconvenient to transport goods and people overseas. Conflicts in the GT area serve as another impediment to development. There have been many conflicts near the GT area as it is essentially a zone bordering Thailand, Laos, and Myanmar. Moreover, Thailand is a capitalist country while Myanmar and Laos are socialist countries. During the Cold War era, many conflicts−−the most prominent being the Vietnam War−−broke out in Indochina.
These geographical and historical factors inhibited the development of the GT.
However, since the end of the Cold War, there has been peace. After the signing of the Paris Peace Agreement in 1991, countries in the Indochina region have largely cooperated among themselves. With the ADB’s support, ASEAN countries(especially Thailand)have seen consid- erable infrastructure development and an improved economic environment. With better economic development, the poor in the GT area will be encouraged to take up activities other than opium production, and poverty in the GT area can be eliminated.
2.3 Economic Overview
In this section, we provide an economic overview of the countries/regions surrounding the GT area, that is, Thailand, Myanmar, Laos(henceforth referred to as TML), and China’s Yunnan province(henceforth referred to together as TMLY). Table 1 shows the macro data for Thailand, Myanmar, Laos, and the Yunnan Province.
Thailand has the largest GDP and the highest GDP per capita among TMLY, followed by Yun- nan province, with its GDP and GDP per capita being about 0.4 and 0.6 times, respectively of the corresponding values for Thailand. In comparison, the corresponding values of the other two countries are very low. In fact, Myanmar’s GDP per capita was 204th in the world in 2011(World Fact Book(2012)).
However, Myanmar’s area is the largest among TLMY, and Myanmar’s population and labor force almost equal those of Thailand. Therefore, in terms of scale, Myanmar’s economy has good potential to grow. On the other hand, the area of Laos is less than half of Myanmar’s area, and its population and labor force is less than one-tenth of those of Thailand.
At 65.5%, Thailand’s export-GDP ratio is the highest. The Thai economy depends heavily on for- eign countries. For comparison, in Japan, the export-GDP ratio is 14.1%, and in China, which is also called the world’s factory, the ratio is 26.1%. In contrast, Myanmar’s export-GDP ratio is very low owing to the economic sanctions imposed against it. However, in late 2012, these economic sanctions were almost lifted, and so, Myanmar’s exports are expected to rise considerably.
Figure 3 shows the average wage in Yangon(Myanmar), Bangkok(Thailand), Vientiane
(Laos), and the Yunnan province. We can see that wages are highest in Bangkok. The average monthly wage in Yangon and Vientiane is less than one-third that of Bangkok. Note that Yangon, Bangkok, and Vientiane are the largest cities in their respective countries. Thus, in the GT area, the average monthly wage is likely to be lower than that the wages in these cities. We can thus see the wage gap between Thailand and the other countries. This serves as an important point in terms of competitive superiority. Thailand has fairly well developed infrastructure; the country has a good road network and a stable electric supply. Companies in Thailand are more competitive as
Table 1 Macro-data for Countries/Areas Bordering the Golden Triangle Area(2011)
Thailand Myanmar Laos Yunnan
Nominal GDP(USD billions) 345.672 51.444 8.302 137.663 GDP per capita(USD) 5,394.71 824.19 1,320.26 2,972.63 Area(km2) 513,120 km2 676,578 km2 236,800 km2 394,000 km2
Population(millions) 67.60 60.4 6.38 46.31
Labor force(millions) 38.9 32.53 3.69 ―
Export(USD millions) 226,380 8,028.4 2,959.4 9,472.45 Import(USD millions) 228,878 13,688.6 4,657.95 6,556.32
Export/GDP(%) 65.5 2.8 35.6 6.9
Source: Area(except Yunnan): World Fact Book(2012),CIA.
Nominal GDP, GDP per capita, population, labor force, export, and import(except Yunnan): Key Indicators, ADB.
Data for Yunnan province: China Statistical Year Book(2012)
The Economic Potentiality of Asia’s Golden Triangle 25
0 200 400 600 800 1000 1200 1400 1600 1800
Yangon Bangkok Vientiane Yunnan
(USD)
Thai minimum wage
worker engineer manager
regular service
non-manu-manager
average
they can hire low-wage labor from Laos and Myanmar, who are paid wages that are less than the minimum wage level in Thailand.
3.Progress of the Greater Mekong Subregion Program and ASEAN’s Free Trade Agreement Network
In this section, we focus on international cooperation and international trade in the GT. We will study the GMS program first, followed by the ASEAN FTA network. Environmental changes have brought in the FDI into ASEAN since 2000’s. We will show the trend of the FDI in TMLY. Fi- nally, we show the rising importance of China in GT area.
3.1 The Greater Mekong Subregion Program
The GMS program includes Cambodia, China(specifically the Yunnan Province and the Guangxi Zhuang Autonomous Region), Laos, Myanmar, Thailand, and Vietnam. It commenced in 1992. The ADB took the initiative to promote the GMS program. The objective of the program is to promote subregional economic cooperation and enhance economic relations among the coun- tries. It covers nine priority sectors: agriculture, energy, environment, human resource develop-
Source: JETRO Report(2012). China Statistical Year Book 2012,National Bureau of Statistics of China.
Note: The average wages for all countries/regions except Yunnan are calculated using other terms for average wage in the re- spective country. “m-manager” stands for middle-manager, and “non-manu” for non-manufacturing jobs.
The Thai minimum wage is set to become THB 300 per day in January 2013. We use the average exchange rate in 2011 to convert THB to USD and we assume that a worker works 20 days in a month.
Figure 3 Average Monthly Wage by Job Category
ment, investment, telecommunications, tourism, transport infrastructure, and transport and trade facilitation(Ishida(2005)).
In order to ensure smooth implementation, the GMS program allows projects that are con- sented to by two countries(i. e., consensus from all the other countries is not necessary), unless it can also benefit the other countries. Moreover, the program minimizes red tape as far as possi- ble. The countries have already gathered good momentum and various discussions about infra- structure, trade rules, and enabling environments to help develop their areas of interest have taken place(Ishida(2005)).
One of the most important sectors in the program is the transport infrastructure sector. Many regions of GMS program countries lie inland. Therefore, highway construction and improvements to facilitate access among countries are high priority tasks. This program brought about the con- struction of three main economic corridors(see Figure 4): the North-South Corridor, which is the most important corridor for the GT; the East-West Corridor; and the Southern Corridor.
These corridors promote trade and improve logistics. Their routes are detailed as follows:
The North-South Corridor(NSC).The NSC is the backbone of the GMS program corridor network as it lies at the center of the region and intersects all the other eight GMS corridors.
The NSC connects Bangkok(Thailand)and Kunming(China). It separates into two routes(the Laos Route and the Myanmar Route)at Menyang(China), which join up again at Chiang Rai
(Thailand).
The Laos Route(R3A)runs as follows: Kumming(China, Yunnan Province)to Menyang
(China), Boten(Laos), Houayxay(Laos), Chiang Khong(Thailand), Chiang Rai(Thailand), and finally, Bangkok(Thailand).
The Myanmar Route(R3B)runs as follows: Kumming(China, Yunnan Province)to Men- yang(China), Jinghong(China), Kengtung(Myanmar), Tachileik(Myanmar), Mae Sai(Thai- land), Chiang Rai(Thailand), and finally, Bangkok(Thailand).
The NSC project will be close to completion when the Houayxay-Chiang Kong Mekong River Bridge(also known as the Fourth Thai-Lao Friendship Bridge)is built. Therefore, the NSC runs nearly through the GT and undoubtedly plays an important role for this area.
The East-West Corridor(EWC).The EWC connects Mawlamyine(Myanmar)and Da Nang
(Vietnam)and works as the land bridge of Indochina. The EWC bisects four of the six GMS
countries. Its route is as follows:
Mawlamyine(Myanmar)to Myawaddy(Myanmar), Mae Sot(Thailand), Mukdahan(Thai- The Economic Potentiality of Asia’s Golden Triangle 27
land), Kaysone(Laos), Dansavanh(Laos), Lao Bao(Vietnam), and Da Nang(Vietnam).
The Southern Corridor(SC).The SC links Dawei(Myanmar), Bangkok(Thailand), Phnom Penh(Cambodia), and Ho Chi Minh City(Vietnam). According to many studies, the SC is likely to become one of the major trade corridors of the GMS program because this corridor connects big cities. The route is as follows:
Dawei(Myanmer)to Bangkok(Thailand), PhnomPenh(Cambodia), Ho Chi Minh City(Vi- etnam), and Vung Tau(Vietnam).
Moreover, the GMS program also facilitates the construction of bridges(for example, the Thai- Lao Friendship Bridges)and new airports, and the refurbishment of trading ports. This physical infrastructure improves transport in Indochina.
The GMS program also includes software infrastructure in its ambit. One of the main projects in the software infrastructure sector is “single-stop custom inspection.” Usually, when people transport goods over the border, they have to be checked twice, once at the exporting country and then at the importing country. A single-stop custom inspection would consolidate these checks. As trade among the countries is clearly on the rise, single-stop custom inspection is al- ready underway.
3.2 Expansion of ASEAN’s Free Trade Agreement Network
During the last decade, many countries have signed FTAs with ASEAN, which cut tariffs sub- stantially and promote trade among them. With the exception of the Yunnan Province and the Guangxi Zhuang Autonomous Region, all GMS program countries are ASEAN members. ASEAN aspires to follow in the steps of the European Union(EU)and achieve the aspirations of its own free trade economic zone called AFTA(ASEAN Free Trade Area). AFTA was established in 1993 and included the ASEAN 6(Thailand, Singapore, Malaysia, Indonesia, Philippines, and Brunei), which enacted zero tariff rates on virtually all imports by 2010. Tariff cuts for the late-joining countries(Vietnam, Myanmar, Laos, and Cambodia)have been effective since 2006, with the tar- iffs slated to reduce to zero by 2015. Moreover, ASEAN has already concluded FTAs with Japan, India, Australia, New Zealand, Korea, and China. These FTAs are called ASEAN+1. ASEAN+3
(Japan, China, and Korea)and ASEAN+6(JCK and India, Australia, and New Zealand)are cur-
rently under study and negotiations may start in 2013.
In Figure 5, we compare the GDP of five free trade area: ASEAN, ASEAN+6, ASEAN+3, the North American Free Trade Agreement(NAFTA), and the EU. The GDP of ASEAN is smaller
Source: Adapted from ADB Technical Assistance Consultant’s Report.
Figure 4 Economic Corridors Being Built under the GMS Program
The Economic Potentiality of Asia’s Golden Triangle 29
ASEAN+6 ASEAN+3 NAFTA EU
ASEAN 0
5000 10000 15000 20000 25000
(billion dollars)
0 100 200 300 400 500 600 700
ASEAN NAFTA EU GMS
(millions)
than one-eighth the GDP of the NAFTA. However, the GDP of ASEAN+6 is larger than that of NAFTA and the EU, and almost equal to that of ASEAN+3. If the ASEAN+3 FTA were to be con- cluded, ASEAN would create quite a large free trade economic zone. Moreover, the population of ASEAN is almost equal to that of the NAFTA and the EU(Figure 6). It means that the potential growth of the ASEAN, ASEAN+3, and ASEAN+6 may exceed that of the NAFTA and the EU.
3.3 Foreign Direct Investment
Recently, many companies have adopted a fragmentation production system, whereby the pro- duction of products is fragmented across countries. A company adopts this system to produce in- dividual parts of a product in another country. For example, the iPad, a product of Apple Comput- ers, is made in Korea, Japan, Taiwan, and so on. Fragmentation entails subsequent expenditure regarding transportation, communication, tariff duties, and so on. These costs are called service link costs. Infrastructure improvement through the GMS program and the expansion of the FTA network decrease this service link cost and facilitate the implementation of the fragmentation pro- duction system. A stream of a fragmentation system typically comprises many companies from de- veloped countries manufacturing some or all product parts in China and ASEAN countries.
Figure 7 shows FDI to ASEAN between 2008 and 2010. We see an increase in FDI between 2008 and 2010 for all countries/regions. EU had the largest FDI volume in 2009 and 2010. FDI from Japan and the USA were almost the same for all the years, and both countries increased FDI to ASEAN. The intraregional investments in ASEAN were higher than those in Japan and the USA. In 2010, FDI increased by quite an extent, which could have been a result of the global eco- nomic recovery from the financial crisis of 2008.
Source: World Economic Outlook Database, IMF.
Figure 5 Nominal GDP of Selected FTAs
Source: World Economic Outlook Database, IMF.
Figure 6 Population by Regional Economic Zone
0 2,000 4,000 6,000 8,000 10,000 12,000 14,000 16,000 18,000
ASEAN USA Japan EU China Korea
2008 2009 2010
(million dollars)
0 20000 40000 60000 80000 100000 120000 140000 160000
2000 2002 2004 2006 2008 2010
0 2000 4000 6000 8000 10000
2000 2001 2002 2003 2004 2005 2006 2007 2008 2009 2010 2011
Cambodia Laos Myanmar Thailand
Vietnam
(million dollars) (million dollars)
Figure 8 shows the FDI stock of GMS countries. The FDI stock of Thailand and Vietnam in- creased during the 2000s. While the FDI stock of Thailand was the largest(about 50 times the FDI stock of Laos and 15 times that of Myanmar), it grew at a sluggish pace in 2008, 2009, and 2011. This is probably because of the financial crisis of 2008. Myanmar’s FDI, in contrast, grew faster than that of Laos. In 2010, Myanmar’s government held the country’s first national election in two decades. As the USA and other countries recognized this as a step toward democracy, they lifted economic sanctions imposed against Myanmar in 2012, and consequently, FDI to My- anmar is expected to accelerate.
Figure 9 shows the FDI stock-GDP ratio. GMS countries have a high proportion of FDI inflows, which shows the high degree of their dependence on foreign companies. In contrast, the Japa-
Source: ASEAN FDI Statistics Database.
Figure 7 FDI Inflows to ASEAN by Country
Source: UNCTAD Statistical Database.
Note: China is omitted in this graph.
Figure 8 FDI Stocks of GMS Countries
The Economic Potentiality of Asia’s Golden Triangle 31
53.2
32.1
16.9
40.4
60.3
3.9 0
10 20 30 40 50 60 70
Cambodia Laos Myanmar Thailand Vietnam Japan
(%)
nese FDI stock-GDP ratio was only 3.9% in 2011. These high FDI numbers and the consequent development of the GMS countries can be attributed to their governments’ policy to open up their borders to foreign businesses. Thus, the expanding FTA network and the acceptance of foreign companies are important factors for the growth of the economy in GMS countries.
3.4 Rising Importance of China in Thailand, Myanmar, and Laos
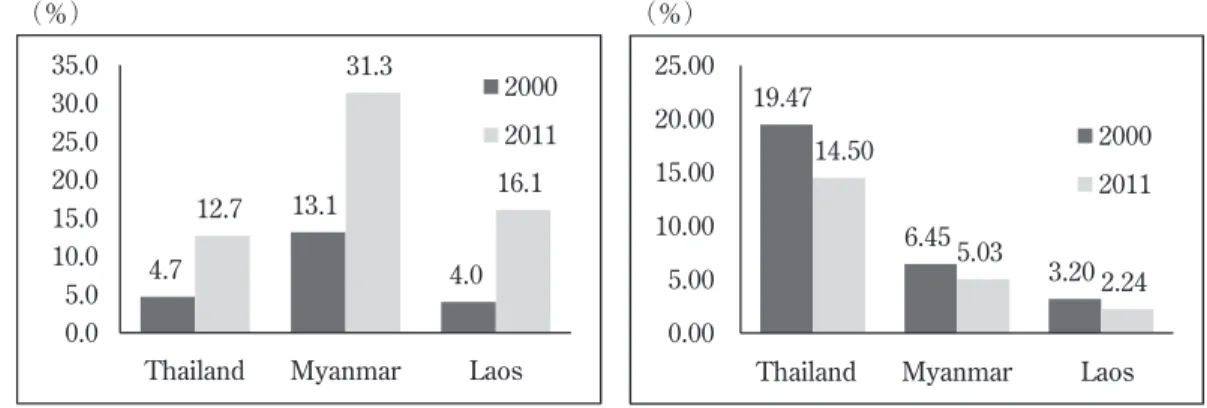
The importance of China as a trading partner increased during the 2000s for TML. Figure 10 shows China’s trade share in TML between 2000 and 2011; it tripled in Thailand and Myanmar and quadrupled in Laos. The Chinese share was particularly high in Myanmar, probably because of the sanctions imposed by other developed countries. However, this cannot be the only reason given that the other GMS countries also traded to a large extent with China. On the other hand, the Japanese trade share in TML decreased during the same period(Figure 11).
In terms of geography, China is an important country for TML. The progress of the GMS pro- gram and the ASEAN+China FTA will deepen the relationship between TML and China. Addition- ally, China enjoyed a good economic growth rate during the 2000 s and the Chinese GDP ranked second in the world during that decade. Given all these factors, the Chinese influence on TML is likely to intensify in the future.
Source: UNCTAD Statistical Database
Figure 9 FDI Stock-GDP Ratio(2011)
4.7
13.1
4.0 12.7
31.3
16.1
0.0 5.0 10.0 15.0 20.0 25.0 30.0
35.0 2000
2011
Thailand Myanmar Laos
(%)
19.47
6.45
3.20 14.50
5.03
2.24 0.00
5.00 10.00 15.00 20.00 25.00
2000 2011
Thailand Myanmar Laos
(%)
4.Economic Potentiality of the Golden Triangle
4.1 Development of the Golden Triangle Area
The GMS program has increased development around the GT area. In this section, we focus on the various projects in the GT area. One of the most important projects is the NSC, which con- nects Kunming(Yunnan province)to Bangkok(Thailand). It is the first priority of the GMS program. Laos, Myanmar, and Yunnan are very mountainous areas, and transportation by road is time consuming and dangerous. There are two routes from Kunming to Chiang Rai(Thailand), the first being the Myanmar route, and the second, the Laos route(see the Figures 2 and 3). Both routes used to be clay roads, but now, most of the route has been paved and expanded, thus helping people traverse the same distance in half the time. Presently, further improvements to the road surface and expansion of traffic lanes are underway(Figure 12).
The NSC includes the second Mae Sai Bridge, which has already been constructed between Mae Sai(Thailand)and Tachileik(Myanmar), as part of the GMS program. This bridge is used by load-carrying vehicles only. Figure 13 shows the new Customs House in Mae Sai, which intro- duced a single-stop custom inspection. Because the first Mae Sai Bridge was a comparatively smaller bridge, the second bridge will increase the volume of border trade between Thailand and Myanmar. Figure 14 shows that the trade volume through the bridge increased during 2004−
2008.
The last big project along the NSC is the construction of the fourth Thai-Lao Friendship Bridge. The lack of a bridge on the border between Chiang Khong(Thailand)and Houeixay
(Laos), over the Mekong River, requires people to switch from car to ship in order to cross the river. The fourth Thai-Lao Friendship Bridge, funded by the Thai and Chinese governments and
Source: Direction of Trade, IMF.
Figure 10 China’s Trade Share in TML
Source: Direction of Trade, IMF.
Figure 11 Japan’s Trade Share in TML The Economic Potentiality of Asia’s Golden Triangle 33
the ADB, which is currently being constructed, would directly connect road travelers to the Laos route(the R3A route)between Kunming(Yunnan)and Chiang Rai(Thailand). It will dramati- cally facilitate transport in this area.
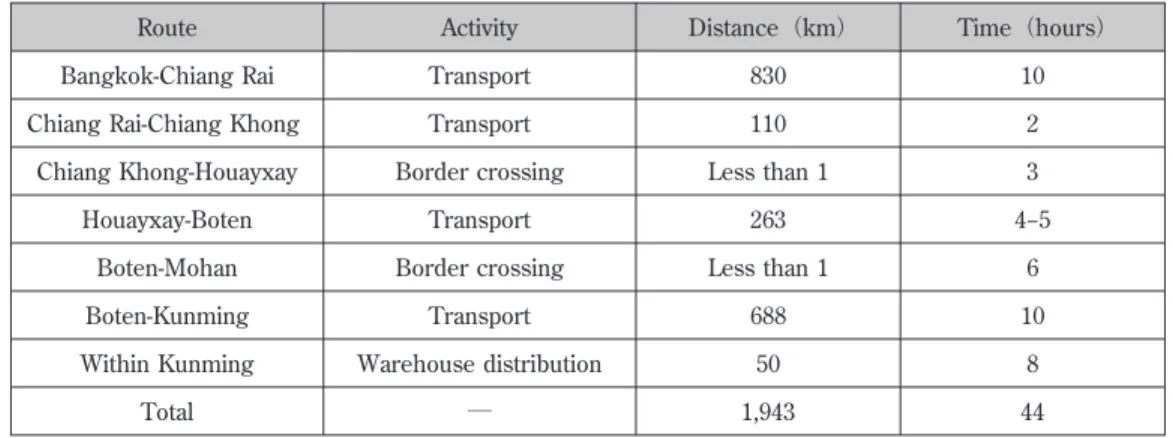
Table 2 shows the distances and travel time between Kunming(Yunnan)and Bangkok(Thai- land)via the Laos route(R3A). From Table 2, the transport time between Bangkok and Chiang Rai is 10 hours, while that between Chiang Rai and Kunming(including border-crossing time)is 34 hours. The completion of the Thai-Lao Friendship Bridge and improvement of the road surface in Laos will reduce this time by nearly half. Transportation by truck is faster than transportation by ship. Thus, in terms of logistics, the development of a highway network is important not just for the GT but also for China. At present, products made in China(for example, Hong Kong)
have to be transported to India or European countries through the south of the Malay Peninsula by ship. This is a costly and time-consuming detour for Chinese companies. Thus, the develop- ment of transit routes from China(Yunnan province)to Myanmar by a road or rail is important.
For this reason, the Chinese government supports the expansion of the Kyaukpyu Port in Myan- mar.
Table 3 shows the distances and travel times between Kunming(Yunnan)and Bangkok
(Thailand)via the Myanmar route(R3B). Comparing the two routes, distance by R3B is shorter than that by R3A by 52 km, while the total travel time for R3A is less than that of R3B by one hour only. It takes longer to travel by the Myanmar route for various reasons. The road connect- ing Tachilek to Mongla is too narrow to allow driving beyond a certain speed. Moreover, the vari- ous check and toll points along this segment prolong the time taken to reach the destination
(Tuneishi(2010)). Clearly, these barriers need to be overcome.
The Chiang Saen Port on the Mekong River also serves as an important logistics location for
Source: Author
Figure 12 Road Expansion in Mae Sai
Source: Author
Figure 13 The New Mae Sai Custom House
the GT. Many products are imported and exported between Thailand and the other three coun- tries. Total trade through the Chiang Saen Port amounted to THB 7076.3 million in 2008, which was over 50% of the total border trade in Northern Thailand(Figure 14). China(Yunnan prov- ince)is the biggest trading partner for Chiang Saen, with about 70% of the latter’s trade being with China. The second Chiang Saen Port opened in 2012. It has a larger capacity than the first Chiang Saen Port, and thus, it is expected to increase border trade between Thailand and China even further. Table 4 shows the distances and travel times between Kunming(Yunnan)and Bangkok(Thailand)via the Mekong River route. We see that the total travel time for the Mekong River route exceeds that of the land route. However, it is possible to export larger vol- umes by ship.
The Chiang Mai International Airport is of particular note to this paper. Chiang Mai is a core Table 2 Segments of Route R3A: Activities, Distance, and Time
Route Activity Distance(km) Time(hours)
Bangkok-Chiang Rai Transport 830 10
Chiang Rai-Chiang Khong Transport 110 2
Chiang Khong-Houayxay Border crossing Less than 1 3
Houayxay-Boten Transport 263 4−5
Boten-Mohan Border crossing Less than 1 6
Boten-Kunming Transport 688 10
Within Kunming Warehouse distribution 50 8
Total ― 1,943 44
Source: Thein Swe and Paul Chambers(2011).
Table 3 Segments of Route R3B: Activities, Distance, and Time
Route Activity Distance Time
Bangkok-Chiang Rai Transport 830 10
Chiang Rai-Mae Sai Transport 60 1
Mae Sai-Tachilek Border crossing Less than 1 2
Tachilek-Mongla Transport 275 10
Mongla-Daluo Border crossing Less than 1 6
Daluo-Kunming Transport 674 8
Within Kunming Warehouse distribution 50 8
Total ― 1,891 45
Source: Thein Swe and Paul Chambers(2011).
The Economic Potentiality of Asia’s Golden Triangle 35
3879.3 3879.3 3879.3
7124.3 7124.3
7124.3 6878.76878.76878.7 7769.17769.17769.1 7076.37076.37076.3 938.3
938.3 938.3
1511.4 1511.4
1511.4 1664.81664.81664.8 1374.81374.81374.8 2070.62070.62070.6 2668
2668 2668
2201.2 2201.2
2201.2 2600.52600.52600.5
3382.2 3382.2
3382.2 4245.34245.34245.3
(million THB)
0 2000 4000 6000 8000 10000 12000 14000 16000
2004 2005 2006 2007 2008
Chiang Saen Chiang Khong Mai Sai
city in northern Thailand and the airport has benefitted the area immensely. The total trade through Chiang Mai Airport totaled THB 111,702 million in 2008, which accounted for 90% of the total border trade for northern Thailand. We shall review more of this in the following section.
4.2 Border Trade in Northern Thailand
In this section, we discuss border trades between northern Thailand and Myanmar, Laos, and Table 4 Segments of the Mekong River Route: Activities, Distance, and Time
Route Activity Distance Time
Bangkok-Chiang Rai Transport 830 10
Chiang Rai-Chiang Saen Transport 110 1
Chiang Saen Loading/unloading, inspection fees Less than 1 1
Chiang Saen-Jinghong port Transport 360 30
Jinghong port Loading/unloading, inspection Less than 1 7
Jinghong port-Kunming Transport 534 8
Within Kunming Warehouse distribution 50 8
Total ― 1,836 65
Source: Thein Swe and Paul Chambers(2011).
Source: Data sourced from Customs Houses in Northern Thailand(Bank of Thailand, Northern Office). Calcula- tions based on Thein Swe and Paul Chambers(2011).
Figure 14 Northern Thailand’s Border Trade by Custom House
China(Yunnan province). First, consider the border trade with Myanmar. There are two routes between Thailand and Myanmar: the land route(Mae Sai(Thailand)-Tachileik(Myanmar)) and the river route(Chiang Saen Port(Thailand)). People mainly use the land route, which ac- counts for about 70% of the total share. As we mentioned previously, the second Thai-Myanmar Friendship Bridge(in Mai Sai)has already been constructed over the Sai River. However, due to political reasons, the bridge is not used as frequently as it should be. If this were to be reme- died, the trade volume between Thailand and Myanmar would increase.
Table 5 shows the border trade share between Thailand and Myanmar by customs house. All the gates in Table 5 are in Thailand. While Kanchanaburi has the largest share, this is only due to the import share of natural gas. If we were to exclude natural gas imports, the highest border trade would be at Tak/Mae Sot(Tak province). Mae Sot is a border town in the East-West Eco- nomic Corridor. At 4%, the share in border trade of the Mae Sai gate is the fourth largest. Exclud- ing the Kanchanaburi gate would increase its share to about 15%.
Figure 15 shows the volume of border trade between Myanmar and northern Thailand(Mae Sai and Chiang Saen). Thai trade balance largely shows a surplus, with increasing exports from Thailand. If the second Mae Sai Bridge is used to the largest degree possible, the trade volume is bound to increase even further.
Second, consider the border trade between Laos and northern Thailand. There are two gates in this case: the Chiang Khong and the Chiang Saen Port(both are located in Thailand). Figure 16
Table 5 Thailand-Myanmar Border Trade Share by Gates(Percentage)
Province
2006 2007
Total Trade
Value Export Value Import Value Total Trade
Value Export Value Import Value
Chiang Rai(Mae Sai) 4% 15% 1% 4% 15% 1%
Chiang Mai 0% 0% 0% 0% 0% 0%
Mae Hong Son 1% 3% 0% 1% 3% 0%
Tak(Mae Sot) 12% 48% 2% 12% 48% 1%
Kanchanaburi 75% 1% 95% 74% 1% 95%
Prachuap Khiri Khan 0% 1% 0% 0% 0% 0%
Ranong 9% 32% 2% 9% 33% 3%
Total 100% 100% 100% 100% 100% 100%
Note: Kanchanaburi’s share of total trade value includes its import share of natural gas. If we were to exclude natural gas im- ports, the highest border trade would be at Tak/Mae Sot.
Source: Estimated from the Report on Border Trade Thailand-Myanmar at Mae Sot, Tak Province, 2007.(This table is referenced by
[3]Kitti Limskul).
The Economic Potentiality of Asia’s Golden Triangle 37
0 2000 4000 6000 8000
Export Import Total
2004 2005 2006 2007 2008 million THB
0 1000 2000 3000
Export Import Total 2004 2005 2006 2007 2008
million THB
0 2000 4000 6000 8000
Export Import Total 2004 2005 2006 2007 2008
million THB
shows the extent of border trade between Laos and northern Thailand. We can see that Thai ex- ports and imports decreased and increased slightly, respectively. In total, the border trade with Laos grew at a sluggish pace. One of the reasons for this could be the construction of the First, Second, and Third Thai-Lao Friendship Bridges in the other areas of Thailand, thus leading to an increase in border trade with other areas of Thailand. If the fifth Thai-Lao Friendship Bridge is completed and Chiang Khong and Houeixay are connected by road, the trade volume of the northern region would increase drastically.
Finally, let us consider the Thai-Chinese(Tunnen)border trade. Only one route connects Yunnan and Thailand directly: the Chiang Saen-Jinghong Route along the Mekong River. Figure 17 shows the extent of border trade between China and northern Thailand. Exports from Thai-
Source: Customs Houses in Northern Thailand
(Bank of Thailand, Northern Office).
Figure 15 Border Trade between Myanmar and Northern Thailand
Source: Customs Houses in Northern Thailand
(Bank of Thailand, Northern Office).
Figure 16 Border Trade between Northern Thailand and Laos
Source: Bank of Thailand, Northern Office.
Figure 17 Border Trade between Northern Thailand and Yunnan
Source: Author
Figure 18 Stores near the Mae Sai Immigration Office
land increased drastically, while the corresponding imports decreased slightly. The opening of the new Chiang Saen Port in 2012 should further promote border trade with China. Moreover, as people also use the Myanmar and Laos routes to transport products, the trade volume between Thailand and China is probably larger than that indicated in Figure 17. Many mercantile stores in the Mae Sai border town sell commodities made in China(Figure 18).
Therefore, we see a surplus trade balance between northern Thailand and three countries. Ex- ports to Myanmar and China are increasing. However, exports to Laos through Chiang Khong and the Chiang Saen Port have been decreasing, probably due to the three Thai-Lao Friendship Bridges that serve as preferential trade routes. With the opening of the new Thai-Lao Friendship Bridge between Chiang Khong-Houayxay, trade between northern Thailand and Laos would in- crease.
4.3 Economic Growth Factors Affecting the Golden Triangle
So far, we have discussed the economic environment around the GT. In this section, we will fo- cus on the growth factors pertaining to the GT. We believe that there are three supply factors and two demand factors. The first factor on the supply side is the expanding free trade economic zone pertaining to ASEAN. As we saw in section 3, ASEAN’s FTA network expanded during the last decade and will expand further. This expansion reduces service link costs for a fragmentation production system. Thus, it will further facilitate fragmentation production and encourage foreign companies to shift larger parts of or all of their production to ASEAN countries.
The second factor is the intraregional gap among the three countries, especially the wage gap.
There is a huge gap in labor wages among Thailand, Myanmar, and Laos. Thailand has better physical(for example, highways, ports, and an international airport)and software(for example, the financial system, product control, and cost management)infrastructure. This infrastructure is crucial for sustaining a fragmentation system. However, the labor cost in Thailand is higher than that in the other two countries, with the average worker wage in Laos and Myanmar being lower than the Thai minimum wage(Figure 3). For this reason, workers from Laos and Myanmar are willing to work in Thailand at the Thai minimum wage(Kudo(2010)). Thus, the low labor cost and advanced infrastructure serve as big advantages and boost production in Thailand in particu- lar.
The third factor is the southward expanding policy of China. With the Yunnan province being inland, Chinese companies manufacturing products in the GT prefer to convey them to the port in Myanmar(for example, Kyaukpyu Port), as the transit time to India, Africa, and Europe would be shorter than if they were to use the Shanghai or Hong Kong Ports. The GT may thus become
The Economic Potentiality of Asia’s Golden Triangle 39
an important production center for China. In fact, some Chinese companies are already reaping the benefits of this advantage and have expanded their production activities here.
The fourth factor, this time on the demand side, is the existence of big markets. The location of the GT area provides high accessibility to two big markets: China and India. The total popula- tion of the two countries was about 2.6 billion in 2011, which accounted for 37% of the world population. Infrastructure improvement due to the GMS program has helped improve accessibility to China and India. Moreover, the lifting of economic sanctions off Myanmar is good news given the population of Myanmar(as high as that of Thailand)and its bountiful natural resources
(such as natural gas). This would translate into accelerated development of the country’s econ- omy and its transformation into a huge market.
The final factor contributing to the growth of the GT is its location; it is a zone bordering TML.
The flow of people and goods is disrupted by the border, so they get together easily in this area.
The scale of the economy should work in its favor. According to the theory of free economic zones, there are three steps traced by a border economic zone. In the first step, trade regulation is strict, there is very little flow of people and goods, and the superiority of the border zone is low. In the second step, the relaxation in regulations allows trade to expand. Although the market is not totally free, the scale of economy works in favor of the area and the superiority of the bor- der zone becomes high. Thus, the border economy is said to have been activated and becomes dynamic. In the final step, people in the area can trade freely over the border, and the superiority of the border zone is lost. We believe that the GT area is currently entering the second stage.
Hence, people will enjoy the benefit of the border zone for a few decades at least.
We expect that these factors will boost the economy of the GT area and help reduce its pov- erty. Finally, we also have to consider the environment of this area. Overdevelopment is bound to deplete and degrade the area’s natural resources. Given that tourism is a vital sector of the econ- omy for this area, it is important to ensure that the area is developed sustainably in the future.
5.Conclusions
In this paper, we study the possibility of economic growth in the GT, a zone bordering Thai- land, Myanmar, and Laos. Certain factors reveal high potential for economic growth in this area.
The first factor is the expanding ASEAN FTA network, which now includes countries such as Ja- pan and China. It facilitates trade between ASEAN countries and foreign companies, particularly those from developed nations. The second factor concerns the intraregional gaps in this area, es- pecially the wage gap. The low labor cost encourages people from Laos and Myanmar to seek work in Thailand. The advanced infrastructure also serves as a big advantage for the fragmenta-
tion production system and boosts production in Thailand in particular. The GMS program has also helped develop much-needed infrastructure in the GT. The third factor is the Chinese trade policy in this area. Chinese companies would like to build a center of production with high acces- sibility to seaports. The fourth factor is the existence of the big markets, such as China and India, and the location of the GT that provides high accessibility to these markets. Further, Myanmar shows great promise as a future market. The final factor is the superiority of the border economic zone. A border tends to stem the flow of people and goods, and they prefer to stay in the area bounded by the border. This increases the significance of the border area and helps improve the scale of its economy.
Given these factors, we postulate that the GT will experience economic growth in the near fu- ture. Currently, most Japanese companies have set up production bases in southern Thailand.
The presence of so many enabling factors predicts good economic growth in Thailand’s northern region, and thus, we recommend that Japanese companies follow in the footsteps of Chinese busi- nesses and turn their attention to the GT area.
References
1 ADB Technical Assistance Consultant’s Report(2012)“Initial Assessments of Road Transport Infrastruc- ture and Transport and Logistic Services for Trade Facilitation in the GMS Countries”, Asian Development Bank.
2 China Statistical Year Book 2012,National Bureau of Statistics of China.
3 Kitti Limskul “A Current Situation of the East-West Economic Corridor: A Case Study of Mae Sod Border Area between the Union of Myanmar and the Kingdom of Thailand,” working paper, Chulalongkorn Uni- versity.
4 hein Swe and Paul Chambers(2011)“Cashing In across the Golden Triangle.” Mekong Press.
5 “World Drug Report,”United Nations Office on Drugs and Crime.
National Economic and Social Development Board of Thailand, http://eng.nesdb.go.th/, Office of National Economic and Social Development Board in Thailnad, December 18, 2012.
The World Fact Book “https://www.cia.gov/library/publications/the-world-factbook/index.html”, Central In- telligence Agency, December 18, 2012.
6 石田正美(編)(2005)『メコン地域開発―残された東アジアのフロンティア』,アジア経済研究所.
7 石田正美(2007) 大メコン圏経済協力と3つの経済回廊 ,『大メコン圏経済協力―実現する3つの経済 回廊』,石田正美(編),アジア経済研究所,第1章.
8 JETRO(2012) 第22回アジア・オセアニア主要都市・地域の投資関連コスト比較 .
9 川田敦相(2011)『メコン広域経済圏―インフラ整備で一体開発』,勁草書房.
10 工藤年博(2010) ミャンマーの国境地域開発―ミャワディ=メソット国境を中心に ,『メコン地域国 境経済を見る』,石田正美(編),アジア経済研究所,第7章.
11 恒石隆雄(2010) 南北経済回廊上の国境貿易と経済圏の形成 ,『メコン地域国境経済を見る』,石田正 美(編),アジア経済研究所,第8章.
The Economic Potentiality of Asia’s Golden Triangle 41
12 日本政策投資銀行メコン経済研究会(編)(2005)『メコン流域国の経済発展戦略―市場経済化の可能性 と限界』,日本評論社.
* I would like to express my deepest gratitude to Prof. kitti Limskul who offered continuing support and constant encouragement. Finally, I gratefully appreciate the financial support of MEXT-Supported Program for the Strategic Research Foundation at Private Universities, 2010−2012, No. S1002006.
† Corresponding author. E-mail addresses: [email protected]