九州大学学術情報リポジトリ
Kyushu University Institutional Repository
Structural Decomposition Analysis of the Global CO2 Emissions
白新田, 佳代子
http://hdl.handle.net/2324/2236014
出版情報:九州大学, 2018, 博士(経済学), 課程博士 バージョン:
権利関係:
Structural Decomposition Analysis of the Global CO
2Emissions
A Dissertation Submitted in Partial Fulfilment of the Requirement for the Degree of
Ph.D. in Economics
Department of Economic Systems Graduate School of Economics
Kyushu University
by
Kayoko SHIRONITTA
1
Contents
Chapter 1 Introduction
... 31.1 The Present Situation Regarding Global Warming... 3
1.2 Economic Activities and their Impacts on the Climate Mitigation ... 9
1.3 Structure of this Dissertation ... 13
Chapter 2 Literature review and research objectives
... 142.1 Studies on relationship between economic activity and GHG emissions ... 14
2.2 Analysis of CO2 emission structure by production-based accounting ... 17
2.2.1 Production-based accounting ... 17
2.2.2 Index decomposition analysis for production-based CO2 emissions ... 18
2.3 Analysis of CO2 emission structure by consumption-based accounting ... 21
2.3.1 Consumption-based accounting ... 21
2.3.2 Structural decomposition analysis for consumption-based CO2 emissions... 23
2.4 Research objectives and contribution of this Dissertation... 25
Chapter 3 Global structural changes and their implication for territorial CO
2emissions
... 283.1 Introduction ... 28
3.2 Methodology ... 32
3.3 Data ... 37
3.4 Results and Discussion ... 38
3.4.1 Economic scale effect, industrial composition effect, and domestic technology effect ... 39
3.4.2 Export scale effect and export composition effect ... 44
3.4.4 Discussion ... 50
3.5 Conclusion ... 54
2
Chapter 4 Cross-country analysis of relationship between material input
structures and consumption-based CO
2emissions
... 564.1 Introduction ... 56
4.2 Methodology ... 60
4.3 Data ... 67
4.4 Results ... 69
4.4.1 CO2 multiplier effects of countries and regions ... 69
4.2. Decomposition of CO2 emission multipliers for 40 countries and regions ... 74
4.3. Relationship between the main CO2 multiplier effects and economic growth 81 4.5 Comparison with previous studies ... 84
4.6 Discussion and conclusions ... 87
Chapter 5 Conclusion
... 90Acknowledgement
... 94Appendix
... 97References
... 1033
Chapter 1 Introduction
1.1 The Present Situation Regarding Global Warming
The problems associated with global warming require immediate attention as the ramifications of perturbations to climate and an increase in the average temperature become apparent (World Metrological Organization, 1986; IPCC, 2014a). The International Panel of Climate Change (IPCC) recently stated that the “Human influence on the climate system is clear, and recent anthropogenic emissions of greenhouse gases are the highest in history. Recent climate changes have had widespread impacts on human and natural systems” (IPCC, 2014a, p.2). The IPCC summarized the risks that will arise if temperatures continue to rise in the future as follows: “(i) Risk of death, injury, ill- health, or disrupted livelihoods in low-lying coastal zones and small island developing states and other small islands, due to storm surges, coastal flooding, and sea level rise, (ii) Risk of severe ill-health and disrupted livelihoods for large urban populations due to inland flooding in some regions, (iii) Systemic risks due to extreme weather events leading to breakdown of infrastructure networks and critical services such as electricity, water supply, and health and emergency services, (iv) Risk of mortality and morbidity during periods of extreme heat, particularly for vulnerable urban populations and those working outdoors in urban or rural areas, (v) Risk of food insecurity and the breakdown of food systems linked to warming, drought, flooding, and precipitation variability and extremes, particularly for poorer populations in urban and rural settings, (vi) Risk of loss of rural livelihoods and income due to insufficient access to drinking and irrigation water and reduced agricultural productivity, particularly for farmers and pastoralists with minimal
4
capital in semi-arid regions, (vii) Risk of loss of marine and coastal ecosystems, biodiversity, and the ecosystem goods, functions, and services they provide for coastal livelihoods, especially for fishing communities in the tropics and the Arctic, (viii) Risk of loss of terrestrial and inland water ecosystems, biodiversity, and the ecosystem goods, functions, and services they provide for livelihoods” (see IPCC, 2014b, p.13). Briefly, the problems resulting from increases in temperature are extremely diverse and widespread.
Consequently, the phenomenon of global warming has been recognized as a problem that needs to be resolved, not only at the national level, but also at the global level.
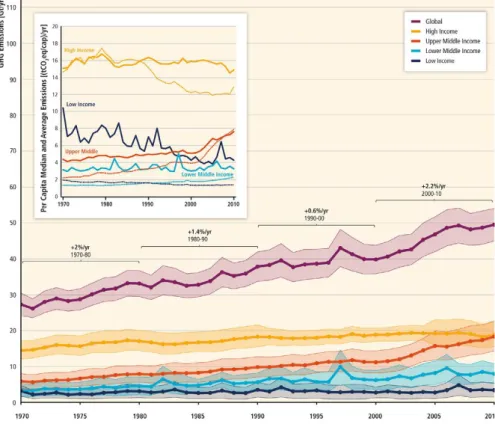
The cause of global warming is considered to be the release and subsequent accumulation of greenhouse gases such as carbon dioxide (CO2), methane (CH4), nitrogen oxide (N2O) and Freon in the atmosphere. Moderating the quantity of GHG emissions is considered important in maintaining average temperatures at levels suitable for sustaining healthy populations of living organisms. However, the current high levels of GHG emissions into the atmosphere have contributed to a rise in global average temperatures (Houghton et al, 1992). According to the IPCC (2014c), GHG emissions have increased considerably from 1970 to 2010, with particularly marked increases (ca. 2.2% per year) observed from 2000 to 2010. Of the GHGs emitted in 2010, 76% was CO2, and of that, 86% was derived from the combustion of fossil fuels and other industrial processes (see Figure 1.1).
5
Figure 1.1. Change in annual GHG emissions from 1970 to 2010 (Source: IPCC, 2014c)
Within the context of the level of economic development, GHG emissions of high- income countries have remained almost unchanged from 1970 to 2010 (see Figure 1.2).
Since 2000, the GHG emissions of upper-middle income countries such as China and Brazil have increased, and in 2010, GHG emissions from these countries exceeded those of high-income countries. IPCC (2014c) reported that the economies of emerging countries have become industrialized and that this has been associated with a marked increase in CO2 emissions from these countries. In particular, China has become the largest CO2 emitter since 2007, which means that the country now plays an important role in the reduction of global CO2 emissions.
6
Figure 1.2. Global increase in GHGs emissions by economic region according to national income level per capita (Source: IPCC, 2014)
As mentioned above, while the problems associated with global warming are varied, most have arisen because of an increase in the average temperature of the earth due to an increase in greenhouse gases in the atmosphere. As a result, any mitigation measures directed at reducing global GHG emissions requires international cooperation.
Global warming issues started to be discussed when the World Climate Conference was convened in Geneva in 1979. The problem of global warming due to CO2 emissions, specifically, was first discussed at the international conference on the assessment of the role of carbon dioxide and of other greenhouse gases in climate variations and
associated impacts (Villach conference) convened by the United Nations Environment Programme (UNEP) in 1985. Although scientists had discussed global warming before
7
the Villach conference, the conference was the first time that scientists and policy makers committed themselves to cooperating with each other to tackle global warming (World Metrological Organization, 1986).
Subsequently, the Kyoto Protocol and the Paris Agreement were important international efforts directed at reducing global GHG emissions. The Kyoto Protocol was concluded in the conference of the parties to the United Nations Framework Convention on Climate Change (COP 3) in 1997 and came into force in 2005. In The Kyoto Protocol, the Annex I Parties (i.e. developed countries), were obliged to reduce the emissions of six greenhouse gases by 5% compared to 1990 levels. The agreement proposed several instruments, such as emissions trading and clean development mechanism, to achieve the aim of reducing GHG emissions through international cooperation at a global scale (UNFCCC, 2008). However, agreement did not achieve the proposed goals, primarily because America—one of the largest CO2 emitters—withdrew from the Kyoto Protocol, and developing countries, who were undergoing rapid industrialization at the time, were not obliged to reduce CO2 emissions (Böhringer, 2003; Böhringer and Vogt, 2003; Lau et al., 2012; Clémençon, 2016).
The Paris Agreement, which is widely recognized as the post Kyoto Protocol, was adopted in 2015. According to a press release from the United Nations, the agreement is
“A historical agreement to combat climate change and unleash actions and investment towards a low carbon resilient and sustainable future was agreed by 195 nations in Paris today” (UNFCCC, 2015, p. 1). As a new international framework for the reduction of GHG emissions after 2020, the Paris Agreement is considered to be a fair agreement in
8
that it allows nations to set their own reduction targets, which are referred to as their
“Intended Nationally Determined Contribution”. In other words, nations can take their own social and economic circumstances into consideration when they set their reduction targets, increasing the support for the agreement from a number of nations. In this way, global warming can be mitigate through a framework of global cooperation that is not based on the level of economic development or geographic area.
9
1.2 Economic Activities and their Impacts on the Climate Mitigation
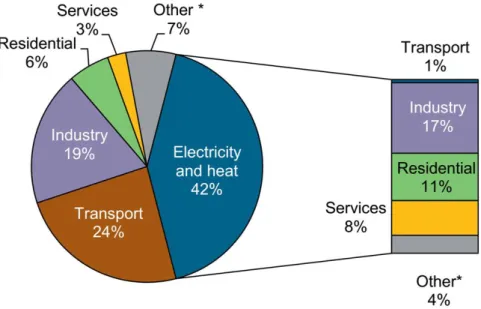
Global GHG emissions, especially CO2 emissions, have increased as the consumption of fossil fuels has increased since the industrial revolution in the 18th century (Canadell et al., 2007; IPCC, 2014a, 2014b). Figure 1.3 shows a breakdown of CO2 emissions derived from global fossil fuel combustion in 2015 (IEA, 2017). In 2015, the combined direct and indirect global CO2 emissions (i.e. the total amount of emissions discharged directly by sectors and the emissions produced by generating the electricity and heat for those sectors) for the industrial and service sectors were 36% and 11% of GHG emissions, respectively. These data show that industrial production
activities are responsible for a very high proportion of global CO2 emissions.
Figure 1.3. Global CO2 emissions from fossil fuel combustion by sector in 2015 (Source: IEA, 2017)
10
The issue of anthropogenic GHG emissions, such as GHG emissions derived from fossil fuel combustion, encompasses a broad range of social and economic issues, including population growth, changes in industrial structure, consumption trends, national policy, technological development, and changes in land use. For example, IPCC (2014c) quantified the contribution of social and economic factors to changes in CO2 emissions from 1970 to 2010 at global and regional levels using the IPAT (I: impact, P: population, A: affluence and T: technology) and Kaya decomposition methods (Ehrlich and Holdren, 1971; Kaya, 1989) (see Figure 1.4). The figure shows that, from 1970 to 2010, human population growth, GDP per capita, energy intensity in GDP (Energy/GDP in Figure 1.4), and CO2 intensity in energy (CO2/ Energy in Figure 1.4) contributed to fossil fuel-derived global CO2 emissions were +87%, +103%, −35%, and −15%, respectively. Thus, increases in population and GDP per capita cancelled out the improvements in energy intensity. Since the ways in which these social factors influence changes in GHG emissions is very complicated, extensive studies will need to be undertaken to clarify the underlying mechanisms in the future (IPCC, 2014c).
As I mentioned above, social factors, such as population growth and economic scale, have been considered in studies of anthropogenic CO2 emissions. Changes in the industrial structure are also recognized as an important social factor for anthropogenic CO2 emissions, especially derived from production activities. In developed countries, more than half of the domestic labor market is engaged in the service sectors (Fuchs, 1968; Zucher, 1986; Iversen and Wren, 1998; Buera and Kaboski, 2012). Within the context of GHG emissions, this shift towards a service economy (Wölfl, 2005) has become increasingly important, as services are considered to generate relatively fewer
11
emissions (e.g. SO2, NO2 and CO2) than conventional industrial activities (Pacala and Socolow, 2004; Levinson, 2009; Okamoto, 2013). However, this shift has resulted in countries satisfying their domestic intermediate input and final demand requirements by importing the agricultural and industrial products from overseas. As a result, they effectively pass on the CO2 emissions associated with production to the country or region exporting the goods (Wiedmann and Minx, 2007; Hertwich and Peters, 2008). Thus, changes in the structure of industrial activities have far-reaching impacts on the production structures that govern the domestic supply chain (Suh, 2006; Nansai et al., 2009). However, since the production structure differs among countries, the distribution of the CO2 emissions associated with domestic production activities throughout the supply chain will differ from one country to the next. Thus, in order to clarify the characteristics of global CO2 emissions, we need to thoroughly understand the role of the production structure (i.e. supply chain structure) in the economy.
12
Figure 1.4. Four-factor decomposition of global CO2 emissions from fossil fuel combustion over the period 1970 to 2010 (Source: IPCC, 2014c).
13 1.3 Structure of this Dissertation
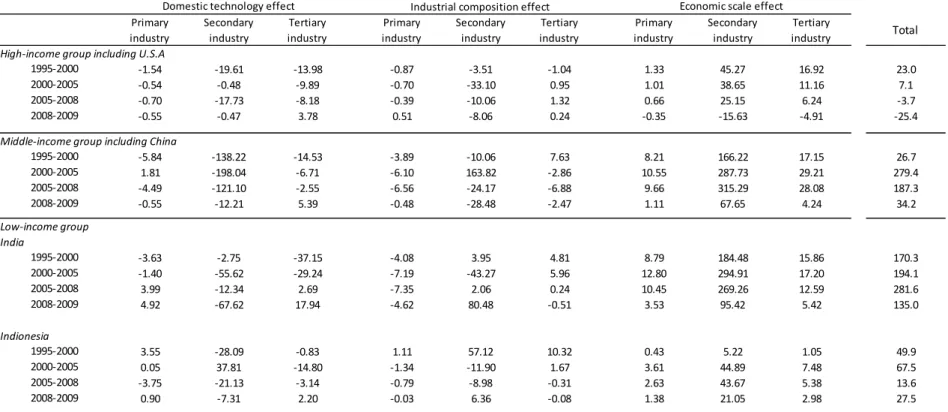
This doctoral dissertation comprises five chapters (See Figure 1.5). Chapter 2 is a review of relevant literature. In addition, the significance and objectives of this thesis are described in detail. Chapter 3 examines the domestic economic structures of the 40 countries from 1995 to 2009. The changes in CO2 emissions induced by the industrial activities of these countries are decomposed into five factors—technology, economic scale, industrial composition, import scale and import composition. Chapter 4 is a comprehensive analysis of the effects of production structures on supply-chain segments, such as inputs of material goods to service sectors, which are required for assessing policies related to reducing CO2 emissions. Finally, Chapter 5 summarizes the results of Chapters 3 and 4 and presents the conclusions of this dissertation.
Figure 1.5 Structure of this thesis
Chapter 1:
Introduction Chapter 2:
Literature review and research objectives
Chapter 3:
Global structural changes and their implication for territorial CO2 emissions
Chapter 4:
Cross-country analysis of relationship between material input
structures and consumption-based CO2emissions
Chapter 5:
Conclusions
14
Chapter 2 Literature review and research objectives
2.1 Studies on relationship between economic activity and GHG emissions
Many studies have been performed that analyze the relationship between environmental problems and economics and many researchers have noted various macro factors as the main drivers of anthropogenic GHG emissions. One example has been a focus on economic growth as an important driver of GHG emissions (Grossman and Krueger, 1994; Lim et al., 2009; Blodgett and Parker, 2010). The environmental Kuznets curve (EKC) for the relationship between environmental impact and economic growth is particularly well known (Grossman and Krueger, 1994; Levinson, 2002; Carson, 2009).
It is an inverted-U curve showing that as an economy grows, the emissions of pollutants and other environmental impacts initially rises, reaches a turning point, and thereafter declines.
Analyses of the relationship between economic growth and GHG emissions have often been based on the EKC hypothesis (Wagner, 2008; Gallagher, 2009; Vollebergh et al., 2009; Stern, 2010; Fodha and Zaghdoud, 2010; He and Richard, 2010; Nasir and Ur Rehman, 2011). These previous studies have shown that GHG emissions continue to increase with rising per capita income, and thus that GHG emissions (environmental impact) do not decrease with growth in per capita income.
As analysis methods that consider not only economic growth but also change in population and technology, the IPAT (I: Impact; P: Population; A: Affluence; T:
Technology) method (Ehrlich and Holdren, 1971) and the Kaya identity (Kaya, 1990)
15
provide frameworks for analysis of the factors of overall change in environmental impact.
The IPAT identity decomposes overall GHG emissions into three factors: population, per capita income, and GHG emission intensity. It may be noted that the Kaya identity is a special case of the IPAT method and focuses on CO2 emissions from fossil fuel combustion and production processes. Raupach et al. (2007) used the Kaya identity to decompose CO2 emissions from fossil fuel combustion and production processes into four drivers: population, per capita GDP, energy intensity of GDP (energy/GDP), and carbon intensity of energy (emissions/energy), and showed that from 2000 to 2004, whereas reductions in the energy intensity of GDP and carbon intensity of energy tended to depress the world’s GHG emissions from fossil fuels, they ultimately rose as a result of increases in population and per capita GDP.
A change in industrial structure can be considered another macro factor with an impact on anthropogenic GHG emissions (IPCC, 2014c). Changes in industrial structure defined in this doctoral dissertation are changes in the share of industrial sectors in the gross national product of a country. In what is well known as Petty-Clark's law (Clark, 1940), it has been observed that in the course of economic growth, as income grows, the agricultural share in production and employment initially decreases while the industrial share increases but later decreases as the share of the service industry ultimately increases (Hollis et al, 1962; Syrquin and Chenery, 1989; Chenery and Syrquin ,1990). This tendency toward increasing weight of the service industry in the economy is known as the shift toward the service economy (Wölfl, 2005).
There are 2 views of the role of shifting toward the service economy in
16
environmental impact. One view is that in a country such a shift contributes to reduction in its domestic GHG emissions (i.e., intraterritorial GHG emissions) because service- oriented nations engage in producing products (i.e., services) with little energy use and with low GHG emission intensity and decrease their GHG emissions from industries manufacturing products with high emission intensity. Pacala and Socolow (2004) estimated future world CO2 emissions extending from 2004 to 2054 and laid out 15 strategies for CO2 emission curtailment that would maintain the 2004 emission level. As part of those strategies, they hold that service industry expansion could suppress future world energy demand and that it would as a result be possible to limit CO2 emissions (Pacala and Socolow, 2004).
For the other view, however, some studies concludes that shifting toward a service economy contributes to increased energy use and higher GHG emissions. Fourcroy et al.
(2012) have shown that in France the transport and communication sectors are capital- intensive and require large amounts of equipment among the service industry, making energy (e.g., electricity) consumed in that industry important. Suh (2006) has estimated the direct and indirect GHG emissions of industries incidental to U.S. household consumption and noted that the domestic service sector in the U.S. contributes indirectly to increases in GHG emissions.
In the following sections, I review the method of analysis relating to CO2 accounting systems, which are important for describing these two contrasting views.
17
2.2 Analysis of CO2 emission structure by production-based accounting 2.2.1 Production-based accounting
Production-based accounting (IPCC, 1997; Peters, 2008) is an accounting system for measurement of the consumption of energy used directly for production of goods and services and measurement of pollutant emissions and other aspects in a country. This accounting system has been used mainly in studies analyzing the relationship between economic growth and environmental impact as in the EKC discussed in Section 2.1. CO2
emissions associated with fossil fuel combustion required for production correspond to CO2 emissions in the usual statistics. Production-based accounting was used to set the emission reduction targets in the Kyoto Protocol and the Paris Agreement (UNFCCC, 2008, 2015). Production-based CO2 emissions are also known as territorial CO2 emissions since the accounted CO2 emissions are those arising in the national territory.
18
2.2.2 Index decomposition analysis for production-based CO2 emissions
One important method of analyzing environmental impacts by production-based accounting is index decomposition analysis (IDA), which is a factor decomposition analysis that uses total output, composition ratio, and other statistical data to perform quantitative estimation of the contribution of factors (e.g., change in industrial composition ratio) to changes in total production. Broadly speaking, IDA consists of two approaches. One is based on the Laspeyres or other price indices (Jenne and Cattell, 1983;
Marlay, 1984; Sun, 1998; Sun and Ang, 2000; Ang and Liu, 2007) and the other on the Divisia index (Ang and Choi, 1997;Ang et al., 1998; Ang and Zhang, 2000; Choi and Ang, 2003; Wood and Lenzen, 2006; Ang and Liu, 2007). In addition, a factor decomposition based on Shapley value proposed in Shapley (1953) are used (Albrecht et al., 2002; Shorrocks, 2013; Xu and Ang, 2013; Yu et al., 2014; Han et al., 2015). Shapley value was developed as an approach to fairly distribute payoff to players in the field of cooperative game theory. Since 1953, Shapley value has been used in cost/income allocation models (Hamlen et al., 1977; Young et al., 1982; Wan, 2004). Shapley value employs a concept that payoff (or costs) are symmetrically distributed to every player (or factor) involved in game (or model) Shapley decomposition also employs this concept and estimate the contributions of factors based on Shapley Value (Albrecht et al., 2002).
Ang et al. (2003) and Ang (2004) pointed out that there is an similarity between the factor decomposition based on Shapley value and Laspeyres index proposed in Sun (1998). Ang (2004) collectively referred them as S/S method.
In the environmental field, IDA is applied to analysis of total energy consumption,
19
energy intensity, GHG emissions, and so forth (Jenne and Cattell, 1983; Marlay, 1984;
Howarth et al., 1991; Ang, 1994; Sun, 1998; Ang et al., 1998; Dietzenbacher and Los, 1998; Dietzenbacher et al., 2000; Ang and Liu, 2001, Albrecht et al., 2002; Hoekstra and van den Bergh, 2003; Ang 2004; Wood and Lenzen, 2006, Levinson, 2009, Kagawa et al., 2012; Su and Ang, 2012; Löschel et al., 2015). The data requirement for IDA is comparatively small, and long-term or international analysis is therefore possible (Hoekstra and van den Bergh, 2003).
The study by Löschel et al. (2015) is an important study using IDA to analyze the relationship between industrial structure and the environmental impact using the production-based accounting. Löschel et al. (2015) used the World Input-Output Database (WIOD) (Dietzenbacher et al., 2013; Timmer et al., 2015), which is one of the multi-regional input-output tables, to analyze the changes from 1995 to 2009 in total energy intensity of 27 EU countries decomposed by changes in industrial structure and changes in energy intensity per country unit. The results of this analysis showed that from 1995 to 2009 the reduction in energy intensity in production in the EU was the result of industrial sector reduction of energy intensity by technological improvements and shifting to industrial sectors with low energy intensity. In another analyses with IDA applied to WIOD, Voigt et al. (2014) quantitatively assessed the impact of the industrial composition of 40 countries and the energy intensity of their industrial sectors on changes in their domestic energy intensity and showed that changes in the industrial composition of countries such as Japan and America contributed to reduction of their energy intensity.
Levinson (2009) decomposed changes from 1972 to 2001 in the emissions of atmospheric pollutants (e.g., SO2 and NO2) from production in the American manufacturing industry
20
into the three factors of (1) emission intensity (technology), (2) industrial composition ratio (composition), and (3) manufacturing industry gross product (scale), and quantitatively analyzed the level of contribution by each. The results showed that curtailing the industrial composition ratio of the manufacturing industry contributed to the reduction of pollutant emissions. Moreover, while many of the analyses that used production-based accounting focused on emissions occurring in the ‘domestic production’
in the countries, Levinson (2009) also focused on changes in the composition ratio of
‘imported intermediate materials input’ to production. In this way, it showed that growth in the import composition ratio of American domestic industries resulted in substitution for domestically produced manufacturing industry products and suppression of pollutant emissions.
21
2.3 Analysis of CO2 emission structure by consumption-based accounting 2.3.1 Consumption-based accounting
Another important accounting system for assessing environmental impact is consumption-based accounting, which measures the energy consumption, pollutant emissions, and other aspects associated with producing final goods and services and intermediate materials for production of these final goods and services in a country. In studies using it, input-output analysis has been applied as a top-down approach and it is therefore possible to estimate indirect emissions associated with the final goods and services through the supply chain (Peters and Hertwich, 2008).
This environmentally extended input-output analysis has been applied to various environmental indicators such as environmental pollution (Leontief, 1970, 1972; Kagawa and Inamura, 2001), GHG and CO2 emissions (Guan et al., 2008; Weber et al., 2008;
Hertwich and Peters, 2009; Peters, et al., 2011; Davis et al., 2011; Oshita, 2011; Okamoto, 2013), amount and intensity of energy use (Bullard and Herendeen, 1975; Park, 1992; Liu et al., 2009; Kagawa et al., 2013; Voigt et al., 2014), water use, resources, and ecology, (Duarte et al., 2002; Hoekstra and van den Bergh, 2006, Lenzen et al., 2012). Particularly in recent years, the development of Chinese domestic input-output tables has progressed, and therefore detailed analysis relating to atmospheric pollutants and CO2 emissions has become vigorous (Chang et al, 2010; Lin et al, 2013; Wang et al., 2014; Liu et al., 2015;
Lei et al., 2017; Mi et al., 2017; Ou et al., 2017). In further progress of multi-regional input-output database development, it has become possible to estimate environmental impact by consumption-based accounting with more widely covered countries (Lenzen et
22
al., 2004, Wiedmann and Minx, 2007; Hertwich and Peters, 2009; Wiedmann, 2009;
Davis et al., 2011). Using a multi-regional input-output table (a GTAP model), Hertwich and Peters (2009) estimated the consumption-based carbon emissions of 69 countries and, based on the relationship of consumption-based carbon emissions to the level of final demand and consumption composition, showed that countries with a higher degree of economic development corresponded to a greater impact on the world’s GHG emissions.
As shown in Hertwich and Peters (2009), analyses using consumption-based accounting have mainly focused on the total amount and composition of the consumption (and import) of final goods and services by developed and developing countries and some have discussed the emissions responsibility between producers and consumers (Lenzen et al, 2007; Feng et al, 2013).
23
2.3.2 Structural decomposition analysis for consumption-based CO2 emissions
Structural decomposition analysis (SDA), like IDA, enables quantitative measurement of the contribution of changes in each factor to changes in total amount and is widely applied in the environmental field (Proops, 1984; Rose, 1990; Lin and Polenske, 1995; Rose and Casler, 1996; Dietzenbacher and Los, 1997; 1998; 2000; Dietzenbacher et al. 2000; Casler and Rose, 1998; Wier, 1998; Nansai et al., 2007; Nansai et al., 2009;
Minx et al., 2011; Xu et al., 2011; Xu and Dietzenbacher, 2014). Detailed descriptions of SDA (and comparisons between SDA and IDA) have been given by Hoekstra and van den Bergh (2003), Su and Ang (2012), and Lenzen (2016). SDA has become an important method for input-output analysis. In particular, estimating the contribution of change in the production structure including the supply chain shown by the Leontief inverse matrix L enables quantitative assessment of structural changes that considers a complex supply chain.
One example is provided by Minx et al. (2011), which applied SDA to the Chinese input-output table, identified the causes of increase in Chinese CO2 emissions from 1992 to 2007, and showed that during that period the expansion in final demand constantly contributed to increase in CO2 emissions and the change in production structure contributed largely to the increase in CO2 emissions particularly from 2002 to 2007.
SDA used in environmental input-output analysis studies is generally additive, but the use of multiplicative SDA enables extraction of important supply chain sectors or segments (Nansai et al, 2007; 2009). Nansai et al. (2009) decomposed the supply chain
24
reflecting the domestic production structure into the four segments; input from goods to goods, input from goods to services, input from services to goods, and input from services to services, and performed multiplier decomposition analysis (Miyazawa, 1966; Sonis and Hewing, 1993; Sonis et al., 1998). The results of this analysis showed that in Japan the intermediate demand for goods such as personal computers, copy machines, and other electronic instrument products increased with the expansion in domestic demand for services. The domestic production structure in Japan tended to be rematerialized (van den Bergh and Janssen, 2004) and the emission intensity of the supply chain segment relating to input of energy and goods for the service industries increased greatly from 1990 to 2000.
25
2.4 Research objectives and contribution of this Dissertation
A comprehensive overview of the prior studies on CO2 emissions in light of the two accounting systems shows the following as challenges remaining to be met.
Studies to the present using production-based accounting have included quantitative analysis of the contribution of production technology and industrial composition ratio to changes in national and territorial CO2 emissions and CO2 emission intensity, but they have treated emission intensities as technology. In additions, they have lacked information on the supply chains that constitute the domestic production structure and overlooked the potential for reduction of supply chain emissions. In another vein, studies to the present that have used consumption-based accounting centered on discussion of emission transfer and consumer responsibility and have not included comprehensive analysis of the relationship between changes in industrial structure (changes in the industrial composition ratio and other aspects) and production structure and technology materialization (e.g., raising the emission intensity in intermediate input to the supply chain). Recent emission managements like the Paris Agreement are based on the production-based accounting which consequently led to an inconsistency between discussion around consumption-based emissions and such emission managements.
Studies to the present that used domestic input-output tables, moreover, have not enough included international comparisons using widespread country coverage. It is critically important to analyze the impact of the world’s composite structural changes on CO2 emissions through international comparisons.
26
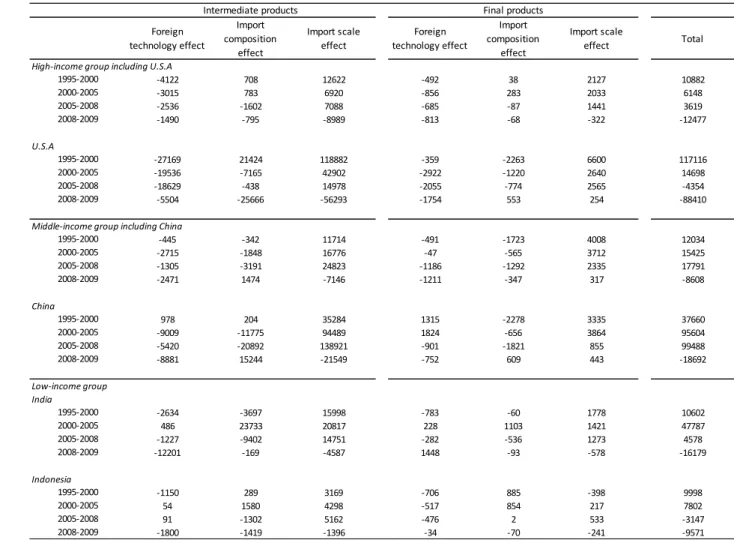
This doctoral dissertation is predicated to meeting these challenges by developing time-series data relating to multi-regional input-output tables and considering both production-based and consumption-based CO2 emission accounting systems, and by focusing on changes in industrial structure from the perspective of industrial and import compositions and on changes in domestic production technology from the perspective of supply chains, all with the objective of comprehensive analysis of the relationship between environment and economy. More specifically, I begin in Chapter 3 by using time- series data of world input-output tables and focusing on changes in the intra- and extraterritorial CO2 emissions (production-based CO2 emissions) of 40 countries. The causes of these changes in emissions are decomposed into effects of industrial and import compositions, production and import scales, and technology (CO2 intensity), and the contributions of multiple factors regarded as having caused change in emissions are measured quantitatively. Particularly in this analysis, the role of changes in industrial structure in world CO2 emissions is considered with a focus on the effects of country industrial and import compositions. In Chapter 4, I utilize data on production structure obtained from world input-output tables to estimate the multiplier effect of CO2 emissions of supply chain segments on CO2 emissions in consumption-based accounting. In elucidating the relationship between the estimated CO2 emission effect and level of economic development, moreover, I discuss the policy for supply chain management in accordance with the level of economic growth in the midst of domestic CO2 reduction.
Simultaneous analyses of the time series for widespread covered countries from both perspective of production-based and consumption-based CO2 emissions enable
27
composite and comprehensive analysis of the role that has been played in global warming by past changes in the world’s industrial structures, and the findings of these analyses will provide important information that constitutes a basis for simultaneous solution of the world’s problems of economic development and global warming in the future.
28
Chapter 3 Global structural changes and their implication for territorial CO
2emissions
3.1 Introduction
Global territorial GHG emissions have increased continuously as nations have pursued economic growth. The average annual increase in GHG emissions for the decade 2000 through 2010 is 2.2% (IPCC, 2014c). According to Assessment Report 5 of the IPCC, CO2 remains the major GHG, accounting for 76% of total GHG emissions.
Changes in human population, per capita gross domestic product (GDP), energy intensity of production, and CO2 emission intensities of energy production have affected fossil fuel-related CO2 emissions by +87%, +103%, −35%, and −15%, respectively, over the 40-year period from 1970 to 2010 (IPCC, 2014c). These data imply that the positive effects of energy efficiency improvements on CO2 emissions have been cancelled out by the increase in per capita production and population.
While territorial and consumption-based CO2 emissions in Asia increased at relatively comparable rates from 1990 to 2010 (i.e., 175% and 197%, respectively), consumption-based CO2 emissions in the OECD member nations increased at least three times as quickly as territorial CO2 emissions (i.e., production-based CO2 emissions) over the same period (IPCC, 2014c). The reason for this remarkable increase in consumption- based CO2 emissions in OECD member nations has been the growing dependence on Asia for imports, which implies that the increase in CO2 emissions was attributable to international trade (Hertwich and Peters, 2009; Davis et al., 2011; Peters et al., 2011).
29
Compared to territorial CO2 emissions, however, the accounting method for consumption-based CO2 emissions poses additional challenges, including the requirement for a deeper understanding of the global supply chain complexity associated with the final demand of nations. Conversely, accounting for the CO2 emissions directly generated to produce products (i.e., production-based CO2 emissions) is relatively straightforward. Therefore, it would be useful to be able to estimate the production-based CO2 emissions responsible for exports when evaluating how importing countries contribute directly to CO2 emissions induced by the domestic production activities of exporting countries. It is crucial to monitor the driving fouces of the changes in not only production-based emissions but export-based emissions in making a climate change policy with a focus of territorial emissions.
In this study, I focus on recent changes in domestic economic structure in the world.
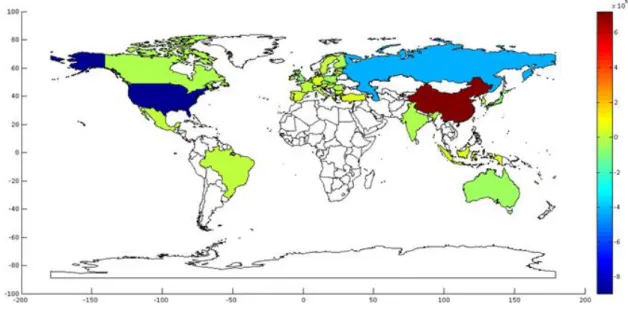
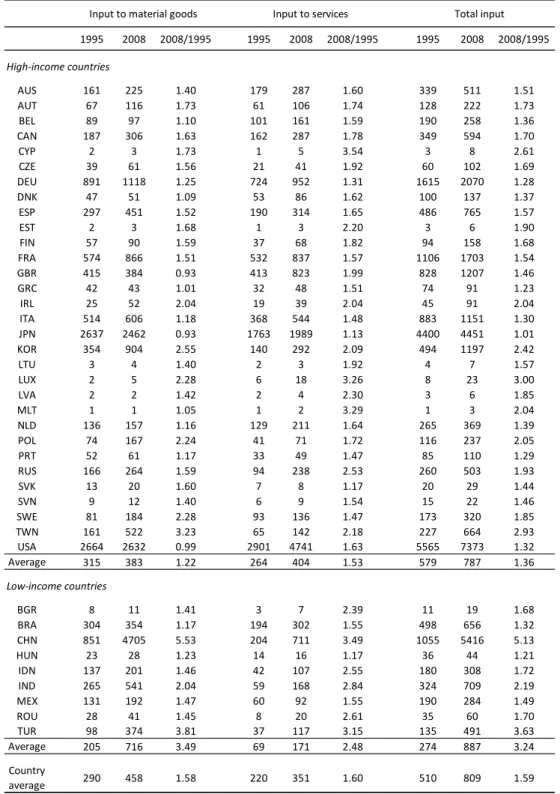
The World Input-Output Database (WIOD) covering 40 developed and developing countries shows that from 1995 to 2009, the ratio of domestic output in the tertiary sectors of the 40 countries to the total output of those countries grew by 1.1%, whereas that of domestic production in the primary and secondary sectors of those countries declined by 4.4% (Dietzenbacher et al., 2013). In addition, the dependence of the 40 countries on imports of primary and secondary products during the same period grew at rates of 2.1%.
In other words, domestic industrialization has rapidly weakened from 1995 to 2009 and this structural change has affected the environment.
A wide variety of indexes and structural decomposition techniques have been developed to analyze the effects of structural changes on energy consumption and the
30
environment (Leontief and Ford, 1972; Proops, 1984; Rose and Chen, 1991; Park, 1992;
Lin and Polenske, 1995; Rose and Casler, 1996; Casler and Rose, 1998; Sun, 1998; Wier, 1998; Kagawa and Inamura, 2001; Ang et al., 2003; Ang, 2004; Levinson, 2009; Wood and Lenzen, 2009; Kagawa et al., 2012; Oshita, 2012; Okamoto, 2013). For example, methodological and empirical comparisons of index decomposition analyses (IDA) and structural decomposition analyses (SDA) were presented in Hoekstra and van der Bergh (2003). In a recent important IDA study, Voigt et al. (2013) used the WIOD to examine energy intensity trends and drivers in 40 major economies, and estimated the effects of changes in the sectoral composition of the global economy as well as regional structural changes on energy intensities. However, they did not argue that domestic structural changes are strongly related to import structural changes. For climate change policy, it is crucial to examine the effects of both changes in industrial composition and import composition on greenhouse gas emissions (Hertwich and Peters, 2009; Peters et al., 2011;
Davis et al., 2011). Xu and Dietzenbacher (2014) examined driving forces of the growth of CO2 emissions from 1995 to 2007 by applying the WIOD to a multiplicative decomposition technique (Dietzenbacher et al., 2000) and revealed that the growth in net export emissions (i.e., emissions embodied in exports minus emissions embodied in imports) in developed countries was mainly due to changes in the trade structure of final and intermediate products. The abovementioned articles focused on consumption-based emissions and so did not include empirical decomposition results that took into account production-based emissions, which should also be discussed by climate policy makers.
This chapter proposes an additive decomposition method of production-based emissions and empirically examines the extent to which changes in the global industrial
31
structure as well as changes in import structure and export structure, have contributed to changes in production-based CO2 emissions (i.e., territorial CO2 emissions). Specifically, the territorial CO2 emissions of each of the 40 aforementioned nations from 1995 to 2009 were estimated using the Environmentally Extended World Input-Output Tables at 2009 prices (Dietzenbacher et al., 2013; Timmer et al., 2015). The Shapley–Sun–
Dietzenbacher–Los additive decomposition method (Park, 1992; Dietzenbacher and Los, 1997; Dietzenbacher and Los, 1998; Sun, 1998; Ang et al., 2003; Ang, 2004; Nansai et al., 2007; Nansai et al., 2009; Kagawa et al., 2012) was then applied to examine the sources of changes in the territorial CO2 emissions. Based on these results, I examine how these structural changes have contributed to changes in CO2 emissions. It should be noted that empirical results from the additive decomposition used in this study are not directly comparable to those from previous studies using multiplicative decomposition techniques (e.g., Voigt et al., 2013; Xu and Dietzenbacher, 2014).
The remainder of this paper is organized as follows: Section 2 describes the study methodology, Section 3 presents the data, Section 4 gives results and discussion, and Section 5 concludes this chapter.
32 3.2 Methodology
In this study, I clarify how a widely used multi-regional input-output database is useful for estimating the effects of changes in industrial composition and trade patterns on production-based emissions. I employ additive decomposition techniques to examine the effects of technology, industrial composition, and economic scale on production- based emissions (Park, 1992; Sun, 1998; Ang et al., 2003; Ang, 2004). Furthermore, I develop a decomposition method for examining the effects of changes in the composition of both regional and sectoral imports on CO2 emissions.
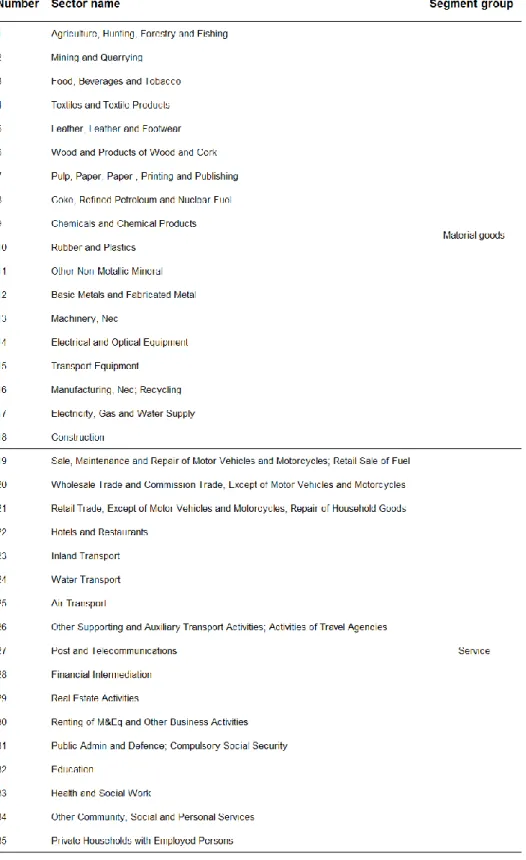
The WIOD database from 1995 to 2009 (Dietzenbacher et al., 2013; Timmer et al., 2015) covers 35 industrial sectors and 40 countries (Tables S3.1 and S3.2 in the Appendix). Using the time series multiregional input–output tables, total territorial emissions Qdt s induced by manufacturing activities in country s in year t can be expressed as follows:
1 N
t t t t
d i i d
i
t t t
d
Q s e s θ s X s s s X s
e θ
(1)
where et s
e sit
, θt s
θ sit
, and Xdt s are the emission intensity row vector describing CO2 emissions per unit output in industrial sector i in country s in year t, the industrial composition column vector describing the fraction of output from industry sector i of total production across all industries in country s in year t, and total33
industrial output summed over all industrial sectors in country s in year t, respectively.
The subscript d denotes “domestic”. N is the number of industrial sectors.
The annual change in Qdt s from year t to year t+1 is then
t 1 t 1 t 1 t t t
d d d
Q s s s X s s s X s
e θ e θ (2)
which can be re-arranged as
t t t t t t
d d d d
t t t
d d d
d
Q s s s X s s s X s s s X s
s s X s s s X s s s X s
s s X s
e θ e θ e θ
e θ e θ e θ
e θ
(3)
The first term on the right-hand side of Eq. (3) represents the effects of changes in CO2 emission intensities on the estimated CO2 emissions, and the second and third terms represent the influence of changes in industrial composition and in gross output on CO2
emissions, respectively; the remaining four terms are interaction terms. Using the Shapley–Sun–Dietzenbacher–Los decomposition to classify the seven terms (including the interaction terms among the technology effect, the industrial composition effect, and the economic scale effect), the following is obtained:
34
1 1
2 3
Technology effect
1 1
2 3
1 1
2
Industrial composition effect
Ec
3
eθ e θ eθ e θ
e θ e θ e θ e θ
+ e θ eθ e θ e θ
t t t t
d d d d d
t t t t
d d d d
t t t t
d d d d
Q X X X X
X X X X
X X X X
onomic scale effect
(4)
For notational convenience, the symbol s denoting country is omitted.
Equation (4) does not allow an examination of the sources of changes in extraterritorial emissions due to direct imports of intermediate products that are necessary for domestic production and direct imports of final products. Therefore, in this study, the emissions associated with the direct imports of intermediate products and final products are formulated as follows:
, ,
1, 1 1, 1
, ,
1, 1,
e λ e π
R N R N
t t t rs t t t rs t
m i i z i i f
r r s i r r s i
R R
t t r t t t r t
z f
r r s r r s
Q s e r λ s IM s e r π s IM s
r s IM s r s IM s
(5)
where Qmt s , λt r, s
λt rsi, s
, πt r, s
πt rsi, s
, IMzt s , and Mtf s are the total territorial emissions caused by imports, the import composition column vectors of the ratios of imports by industrial sector i into country s to the total imports for intermediate products and final products to country s, the total amount of imports of intermediate products, and the total amount of imports of final products for country s, respectively. et r
e rit
is the emission intensity row vector for country r, and R is35 the number of countries.
The extraterritorial emissions due to importation can be decomposed in the same way, i.e., into the effects of technology, domestic import structure, and domestic import scale in the importing country:
Overseas technology effect for intermedaite products
Overseas technology effect for final prod
1 1
2 3
1 1
2 3
t t t t t
m z z z z
t t t t
f f f f
Q IM IM IM IM
IM IM IM IM
eλ e λ eλ e λ
eπ e π eπ e π
ucts
Import composition effect for intermedaite products
Import composition
1 1
2 3
1 1
2 3
t t t t
z z z z
t t t t
z f f f
IM IM IM IM
IM IM IM IM
e λ e λ e λ e λ
e λ e π e π e π
effect for final products
Import scale effect for intermedaite products
Impor
1 1
2 3
1 1
2 3
t t t t
z z z z
t t t t
f f f f
M IM IM IM
IM IM IM IM
+ e λ eλ e λ e λ
e π eπ e π e π
t scale effect for final products
(6)
The emissions associated with the direct export of intermediate products and final products are formulated as follows:
, ,
1, 1 1, 1
, ,
1, 1,
e ε e δ
R N R N
t t t sr t t t sr t
x i i z i i f
r r s i r r s i
R R
t t r t t t r t
z f
r r s r r s
Q s e s ε s EX s e s δ s EX s
s s EX s s s EX s
(7)
36
where Qtx s , εt r, s
εit sr, s
, δt r, s
δit sr, s
, EXzt s , and EXtf s are the total territorial emissions caused by exports, the export composition column vectors of the ratios of exports by industrial sector i from country s to the total exports of intermediate products and final products to country r, the total amount of exports of intermediate products, and the total amount of imports of final products for country r, respectively. et s
eit s
is the emission intensity row vector for country s.Territorial CO2 emissions due to exportation can be decomposed into the effects of technology, domestic export structure, and domestic export scale in the exporting country:
Domestic technology effect for intermedaite products
Domestic technology effect for final produ
1 1
2 3
1 1
2 3
t t t t
x z z z z
t t t t
f f f f
Q EX EX EX EX
EX EX EX EX
eε e ε eε e ε
eδ e δ eδ e δ
cts
Export composition effect for intermedaite products
Export composition e
1 1
2 3
1 1
2 3
t t t t
z z z z
t t t t
z f f f
EX EX EX EX
EX EX EX EX
e ε e ε e ε e ε
e δ e δ e δ e δ
ffect for final products
Export scale effect for intermedaite products
Exp
1 1
2 3
1 1
2 3
t t t t t
z z z z
t t t t t
f f f f
EX EX EX EX
EX EX EX EX
+ e ε eε e ε e ε
e δ eδ e δ e δ
ort scale effect for final products
(8)
37 3.3 Data
In this study, the WIOD (Dietzenbacher et al., 2013; Timmer et al., 2015) and the Environmental Accounts, which are downloadable from the data website:
http://www.wiod.org/new_site/data.htm, are employed. These data cover 35 industrial sectors and 40 countries and region (Tables S3.1 and S3.2 in the Appendix) and focus on the period of 1995 to 2011. For this study, the nominal World Input-Output Tables for 1995 to 2009 were converted into deflated World Input-Output Tables based on 2009 prices using the double deflation method (United Nations, 1999). The deflators were obtained from the output prices of the nominal World Input-Output Tables and of the real World Input-Output Tables in previous year’s prices.
The industrial composition column vector and total industrial output of 40 countries and region are calculable from the domestic outputs described in the deflated World Input- Output Tables, and the industrial CO2 emissions for 40 countries are obtainable from the Environmental Accounts (Dietzenbacher et al., 2013; Timmer et al., 2015). The emission intensity row vector can be easily obtained by dividing industrial CO2 emissions by industrial outputs. The data on intermediate inputs and final demand of goods and services are directly obtainable from the deflated World Input-Output Tables.