九州大学学術情報リポジトリ
Kyushu University Institutional Repository
Immune checkpoint protein and cytokine
expression by T lymphocytes in pleural effusion of cancer patients receiving anti–PD-1 therapy
池松, 祐樹
https://doi.org/10.15017/4060029
出版情報:九州大学, 2019, 博士(医学), 課程博士 バージョン:
権利関係:(C) 2019 Elsevier B.V. All rights reserved.
Contents lists available atScienceDirect
Lung Cancer
journal homepage:www.elsevier.com/locate/lungcan
Immune checkpoint protein and cytokine expression by T lymphocytes in pleural effusion of cancer patients receiving anti–PD-1 therapy
Yuki Ikematsu
a, Kentaro Tanaka
a,⁎, Toyoshi Yanagihara
a, Renpeng Liu
a, Hiroyuki Inoue
a, Yasuto Yoneshima
a, Keiichi Ota
a, Eiji Iwama
a, Shohei Takata
b, Kentaro Hata
c, Yuriko Takahata
c, Hiroshi Wataya
c, Yoichi Nakanishi
a, Isamu Okamoto
aaResearch Institute for Diseases of the Chest, Graduate School of Medical Sciences, Kyushu University, Fukuoka, Japan
bNational Hospital Organization Fukuoka-Higashi Medical Center, Fukuoka, Japan
cDivision of Internal Medicine, Saiseikai Fukuoka General Hospital, Fukuoka, Japan
A R T I C L E I N F O Keywords:
Pleural effusion Anti–PD-1 therapy T lymphocyte
Immune checkpoint molecule
A B S T R A C T
Objectives:Pleural effusion (PE) occasionally develops in cancer patients during treatment with antibodies to programmed cell death–1 (PD-1) or to its ligand PD-L1 (hereafter, αPD-1 therapy). Such effusion often contains infiltrated mononuclear cells, although the types of immune cell present as well as the outcome of such patients have remained unclear.
Materials and methods:We performed a multi-institutional, observational study to examine the clinical outcome of patients who develop PE after the onset of αPD-1 therapy. We compared the immune cell profiles and the immune status of lymphocytes in PE as determined by flow cytometry between nine patients who developed effusion during αPD-1 therapy (αPD-1 group) and 15 patients who developed PE during treatment with other anticancer agents (control group).
Results:Most mononuclear cells in PE were lymphocytes in both the αPD-1 and control groups. The frequency of both CD4+and CD8+T lymphocytes expressing the immune checkpoint proteins TIM-3 or TIGIT as well as that of CD8+T lymphocytes expressing PD-L1 were increased in the αPD-1 group compared with the control group.
αPD-1 therapy continued for a substantial period after the emergence of PE in six of the nine patients in the αPD- 1 group, and the frequency of CD4+T lymphocytes in PE expressing the immune checkpoint protein LAG-3 or the cytokine interkeukin-17 was lower for these patients than for those who did not receive a sustained treat- ment benefit.
Conclusion:Our results suggest a clinical benefit of continuing αPD-1 therapy in some patients who develop PE.
We found that infiltrating T lymphocytes in PE manifest a more exhausted phenotype during αPD-1 therapy than during treatment with other cancer drugs, with subpopulations of these cells characterized by specific immune checkpoint protein and cytokine expression profiles possibly contributing to the antitumor immune response.
1. Introduction
The emergence of pleural effusion (PE) is usually a sign of pro- gressive disease in individuals with cancer. In many such cases, the PE contains malignant cells and is referred to as malignant pleural effusion.
It is treated with repeated thoracentesis or chemical pleurodesis, but it is associated with poor prognosis [1], with a median survival time after its diagnosis of ∼6 months [2,3].
The development of antibodies to programmed cell death–1 (PD-1) and to its ligand PD-L1 (hereafter referred to as αPD-1 therapy) and of
other immune checkpoint inhibitors has brought about a paradigm shift in the treatment of various cancers. αPD-1 therapy achieves a clinical response by interrupting the interaction of PD-L1 on tumor and other cells with PD-1 on CD8+T lymphocytes and thereby reactivating ef- fector T cell function [4–9]. We recently experienced a case of PE containing abundant lymphocytes that developed in a kidney cancer patient after the onset of αPD-1 therapy and which was followed by pronounced shrinkage of a metastatic tumor in the chest wall [10]. The patient was able to continue αPD-1 therapy until a severe adverse event occurred, and no tumor recurrence was observed after the cessation of
https://doi.org/10.1016/j.lungcan.2019.10.011
Received 7 September 2019; Received in revised form 1 October 2019; Accepted 8 October 2019
⁎Corresponding author at: Research Institute for Diseases of the Chest, Graduate School of Medical Sciences, Kyushu University, 3-1-1 Maidashi, Higashi-ku, Fukuoka, 812-8582, Japan.
E-mail address:[email protected](K. Tanaka).
0169-5002/ © 2019 Elsevier B.V. All rights reserved.
T
treatment. This case raised the question of whether emerging effusion under αPD-1 therapy has a distinct clinical meaning.
The pleural space of individuals with cancer and PE often contains abundant lymphocytes and can be considered a tumor microenviron- ment (TME) [11,12]. PD-1–PD-L1 signaling is a key mechanism for suppression of the activity of tumor-infiltrating lymphocytes in the TME, with the exhausted T cells being characterized by down-regula- tion of the production of effector cytokines such as interferon-γ (IFN-γ) and impaired cytotoxicity [13,14]. On the other hand, αPD-1 therapy does not always result in complete restoration of T cell function, and the outcome of such therapy remains limited [15,16]. This situation has promoted further study of the immune cells present in the TME for the identification of biomarkers that may allow prediction of the efficacy of αPD-1 therapy or serve as a target for enhancement of antitumor im- munity.
Co-inhibitory receptors other than PD-1—such as T cell im- munoglobulin mucin–3 (TIM-3), T cell immunoglobulin and ITIM do- main (TIGIT), and lymphocyte activation gene–3 (LAG-3)—are up- regulated on exhausted T lymphocytes and regulate effector T cell function in the TME [17], although their precise roles have remained unclear. In addition to immune checkpoint molecules, cytokines pro- duced by T cells in the TME are thought to contribute to the status of the antitumor response [18], but the mechanism by which tumor-in- filtrating lymphocytes produce cytokines in PE after the initiation of αPD-1 therapy and the relation of such cytokine production to the outcome of treatment are unknown.
To elucidate how patients who develop PE might benefit from continuation of αPD-1 therapy and to provide insight into the char- acteristics of PE in such patients, we examined the clinical outcome of patients and analyzed infiltrating mononuclear cells by flow cytometry.
In the present study, we analyzed not only immune cell profiles but also the expression of immune checkpoint proteins and cytokine production by T lymphocytes in PE from cancer patients undergoing αPD-1 therapy or other anticancer treatments in order to shed light on the immune response mediated by T lymphocytes during αPD-1 therapy and its possible association with clinical efficacy.
2. Materials and methods 2.1. Patients and sample collection
This multi-institutional, observational study was approved by the institutional review board of each institution and was conducted in accordance with the Declaration of Helsinki. All patients provided written informed consent. PE was collected via thoracentesis at the time cancer patients developed PE during anticancer treatment. Patients who manifested clinical or laboratory signs of acute or chronic infection were excluded from the study. Those with transudative PE according to Light’s criteria [19] were also excluded. The total cell count in PE was
determined with an automated instrument at each hospital. The effu- sion samples were centrifuged at 400 ×gfor 5 min, and the cell pellets were washed twice with RPMI 1640 medium. If necessary, immune cells including lymphocytes were separated from red blood cells by centrifugation with Ficoll-Paque Plus (GE Healthcare Life Sciences) and were then suspended in RPMI 1640 medium.
2.2. Flow cytometric analysis
Antibodies used for flow cytometry were summarized in Supplementary Table 1 and surface staining of cells was performed as previously described [20]. For measurement of intracellular interleukin (IL)–17 and IFN-γ, mononuclear cells (1 × 10⁶/ml) were stimulated for 6 h at 37 °C under 5% CO2 with Leukocyte Activation Cocktail with BD Golgiplug (2 μl/ml) (BD Biosciences). The cells were then stained with antibodies to CD3, CD4, and CD8 before fixation and permeabilization with the use of a Cytofix/Cytoperm-Plus Fixation/Permeabilization Kit (BD Biosciences). For measurement of intracellular perforin and gran- zyme B, cells were stained without stimulation, fixed and permeabilized in same ways as those of IL-17 and IFN-γ. Finally, intracellular staining was performed with antibodies to human IL-17, IFN-γ, perforin,- granzyme B and mouse isotype control, respectively.
2.3. Statistical analysis
Data were compared with Student’sttest. All statistical analysis was performed with JMP software version 13 (SAS Institute). AP value of < 0.05 was considered statistically significant.
3. Results
3.1. Clinical course of patients developing PE during αPD-1 therapy Between February 2017 and October 2018, we identified nine pa- tients who developed PE after the onset of αPD-1 therapy (αPD-1 group). The clinical course of these patients is summarized inTable 1.
They included one patient with renal cell carcinoma, six with lung adenocarcinoma, and two with squamous cell lung carcinoma. Four of the nine patients received nivolumab, and the others received pem- brolizumab. PE of six patients (67%) was found to contain malignant cells. The median time before development of PE after the onset of αPD- 1 therapy was 31 days (range, 7–49 days).
To elucidate specific characteristics of PE emerging during αPD-1 therapy, we also examined patients who developed PE while receiving anticancer treatments other than αPD-1 therapy. During the same period, we identified 15 such patients (control group). The clin- icopathologic characteristics of the αPD-1 group and the control group, including age, sex, type of cancer, histology, and therapy, are sum- marized inTable 2.
Table 1
Clinical course of patients in the anti–PD-1 therapy (αPD-1) group.
Patient Diagnosis TNM stage PD-L1 TPS
(%) Malignant cells
in PE Therapy Time to PE emergence after onset
of αPD-1 therapy (days) Continuation of αPD-1
therapy after PE TTS (days)
1 Kidney cancer CCC cTXN0M1b stage IV UN (–) Nivo 26 (after 2 courses) Yes > 806 (NR)
2 Lung cancer ADC cT2aN2M1a stage IV 80 (+) Pembro 9 (after 1 course) Yes > 627 (NR)
3 Lung cancer ADC cT1bN2M1c stage IV ≥90 (–) Pembro 49 (after 3 courses) Yes > 217 (NR)
4 Lung cancer SCC pT4N2M0 stage IIIB 65 (–) Pembro 44 (after 2 courses) Yes 148
5 Lung cancer ADC cT4N2M1b stage IV 35 (+) Pembro 31 (after 2 courses) Yes 132
6 Lung cancer ADC cT1bN2M0 stage IIIB ≥90 (+) Pembro 33 (after 2 courses) Yes 109
7 Lung cancer SCC cT1cN3M1c stage IV 1–24 (+) Nivo 7 (after 1 course) Yes 46
8 Lung cancer ADC cT1bNoM1a stage IV 15 (+) Nivo 37 (after 3 courses) No 37
9 Lung cancer ADC cT2aN2M1a stage IV 0 (+) Nivo 15 (after 1 course) No 21
TPS, tumor proportion score; PE, pleural effusion; TTS, time before implementation of a change in treatment strategy; CCC, clear cell carcinoma; ADC, adeno- carcinoma; SCC, squamous cell carcinoma; UN, unknown; Nivo, nivolumab; Pembro, pembrolizumab; NR, not reached.
Y. Ikematsu, et al. Lung Cancer 138 (2019) 58–64
59
3.2. Up-regulation of immune checkpoint molecules on T cells in PE of the αPD-1 group
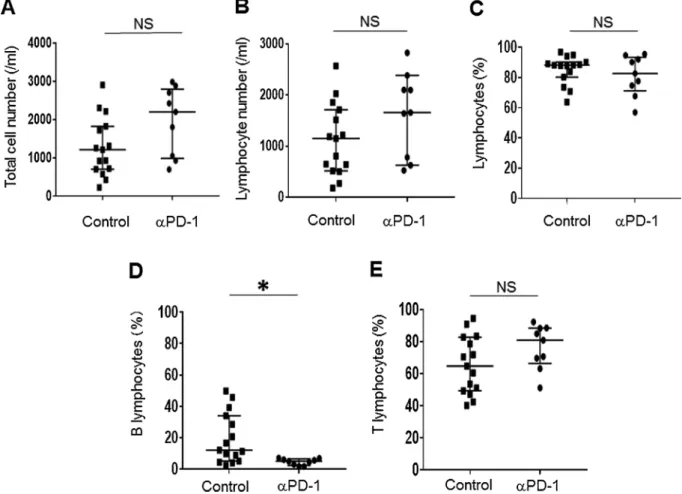
We analyzed mononuclear cells by flow cytometry in order to characterize the types of immune cell present in PE. The total cell number as well as the number of lymphocytes (CD45+CD3+cells and CD45+CD19+cells) in PE did not differ significantly between the αPD- 1 group and the control group (Fig. 1A and B). The percentage of natural killer (NK) cells (CD45+CD3–CD19–CD56+cells) or myeloid cells (CD45+CD3–CD19–CD11b+cells) also did not differ between the two groups (Supplementary Fig. 1A and B). More than half of mono- nuclear cells in PE were found to be lymphocytes in both groups (Fig. 1C), showing that most infiltrating immune cells after the onset of αPD-1 therapy were lymphocytes. Further analysis of lymphocyte subsets revealed that the percentage of B lymphocytes (CD45+CD19+ cells) was significantly lower in the αPD-1 group (P= 0.012) (Fig. 1D), whereas neither the frequency of T lymphocytes (CD45+CD3+cells), CD4+ T lymphocytes (CD3+CD4+ cells), or CD8+ T lymphocytes (CD3+CD8+ cells) nor the CD4/CD8 cell ratio differed significantly between the two groups (Fig. 1E and Supplementary Fig. 1C-E).
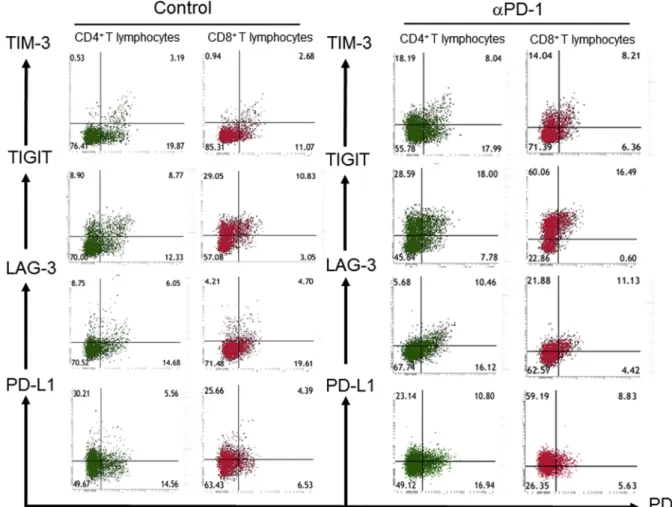
To examine whether αPD-1 therapy might affect the expression of immune checkpoint proteins on T lymphocytes in PE, we measured the surface expression of PD-1, TIM-3, TIGIT, LAG-3, and PD-L1 in both the αPD-1 group and the control group (Fig. 2). The frequency of both CD4+T lymphocytes and CD8+T lymphocytes expressing TIM-3 or TIGIT as well as that of CD8+T lymphocytes expressing PD-L1 were significantly higher in the αPD-1 group than in the control group (Fig. 3), suggesting that T lymphocytes show a more exhausted phe- notype under αPD-1 treatment.
To investigate the specific functional characteristics of T lympho- cytes in PE of the αPD-1 group, we also evaluated the expression pro- files of the cytotoxicity mediators perforin and granzyme B as well as of the signature cytokines IL-17 and IFN-γ. The frequency of CD4+ T lymphocytes or CD8+T lymphocytes producing each protein did not differ between the αPD-1 and control groups, however (Supplementary Fig. 2 and Supplementary Fig. 3).
3.3. Clinical benefit of continuing αPD-1 therapy after PE development αPD-1 therapy for the study subjects continued after the develop- ment of PE if the investigator deemed the patients to be still receiving a clinical benefit. We defined a time before implementation of a change in treatment strategy (TTS) of ≥90 days as clinical benefit and a TTS of < 90 days as nonbenefit (Table 1). Six of the nine patients in the αPD-1 group were thus classified as having received a clinical benefit.
All three of the nonbenefit patients manifested malignant cells in their PE, whereas three of the six patients in the benefit group did so. The median TTS of the clinical benefit group was 182.5 days, compared with 37 days for the nonbenefit group (P= 0.132).
3.4. Relation of immune checkpoint protein or cytokine profiles of T lymphocytes to the antitumor immune response during αPD-1 therapy
The fact that six of the nine patients in the αPD-1 group continued to show apparent disease control after the emergence of PE led us to perform an exploratory analysis of the relation between response to αPD-1 therapy and the characteristics of T lymphocytes in PE. We found that the number and frequency of lymphocytes did not differ significantly between the clinical benefit group and the nonbenefit group (data not shown). Examination of the expression of immune checkpoint proteins (Fig. 4A), cytotoxicity mediators (Supplementary Fig. 4), and cytokines (Fig. 4B and C) in T lymphocytes revealed that the frequency of CD4+T lymphocytes expressing LAG-3 or IL-17 was significantly higher in the nonbenefit group than in the clinical benefit group.
4. Discussion
Our observational study has shown that some patients are able to receive clinical benefit by continuing αPD-1 therapy after the emer- gence of PE, indicating that the clinical course of these patients differs from that of patients who develop PE during treatment with conven- tional anticancer drugs. We found that lymphocytes constituted the majority of immune cells in PE and that αPD-1 therapy did not sig- nificantly affect the number or percentage of lymphocytes, NK cells, or myeloid cells compared with other anticancer treatments, whereas αPD-1 therapy was associated with an increased proportion of T lym- phocytes expressing TIM-3, TIGIT, or PD-L1. In addition, LAG-3 ex- pression and IL-17 production by CD4+T lymphocytes were negatively associated with clinical outcome in patients receiving αPD-1 therapy.
As far as we are aware, our study is the first to examine the expression of multiple checkpoint proteins and cytokine production by T lym- phocytes in PE of cancer patients receiving αPD-1 therapy.
αPD-1 therapy has been associated with a pattern of immune-re- lated responses [21] that differ from responses to cyotoxic agents. The clinical course and characteristics of PE for patients in the αPD-1 group of the present study suggest that the activation of T lymphocytes by such therapy might lead to an immune-related reaction that is occa- sionally followed by clinical tumor shrinkage. Case reports have de- scribed emergence of PE followed by clinical benefit during αPD-1 therapy [22–24]. Our observational study confirms the existence of such patients. At present, there is no definitive PE-based biomarker for prediction of subsequent clinical response to αPD-1 therapy. Patients who develop PE soon after the onset of αPD-1 therapy should thus be carefully evaluated so that some are able to receive clinical benefit by continuing such therapy.
In addition to PD-1 and cytotoxic T lymphocyte–associated pro- tein–4 (CTLA-4), which serve as targets for immune checkpoint in- hibitors in clinical practice, immune checkpoint proteins including TIM-3, TIGIT, and LAG-3 are expressed on exhausted or dysfunctional T lymphocytes [17,25]. The apparent functional overlap among these proteins in immune suppression might contribute to the maintenance of immune homeostasis in the event that one or more of them becomes Table 2
Clinicopathologic characteristics of patients in the anti–PD-1 therapy (αPD-1) group and the control group.
Characteristic αPD-1
(n = 9) Control (n = 15) Age (years)
Median 67 70
Range 64–75 48–79
Sex Male 4 11
Female 5 4
Type of cancer
Kidney
cancer 1 2
Clear cell carcinoma 1 2
Lungcancer 8 13
Adenocarcinoma 6 9
Squamous cell
carcinoma 2 3
Small cell carcinoma 0 1 Malignant cells in
PE Positive 6 13
Negative 3 2
Type of therapy
Nivolumab 4 0
Pembrolizumab 5 0
Cyototoxic drug 0 8
Tyrosine kinase
inhibitor 0 7
compromised. However, αPD-1 therapy was found to result in up-reg- ulation of TIM-3 expression on CD8+T lymphocytes in association with the development of treatment resistance in a mouse model of lung cancer, and the addition of an antibody to TIM-3 to αPD-1 therapy overcame this resistance [26]. This previous study suggested to us that TIM-3, TIGIT, and LAG-3 expressed on the surface of T lymphocytes might all play specific roles in the TME. Our results now show that PD-1 blockade was associated with increased TIM-3 and TIGIT expression on both CD4+and CD8+T lymphocytes in PE as well as with increased PD-L1 expression on CD8+T lymphocytes. These findings might reflect the operation of an autoregulatory mechanism to prevent the over- reaction of T lymphocytes in response to αPD-1 therapy. Among the checkpoint proteins examined, we found that an increased frequency of LAG-3 expression on CD4+ T lymphocytes was associated with a shorter duration of response to αPD-1 therapy. LAG-3 has been found to be expressed on CD4+T lymphocytes with a regulatory function such as regulatory T cells [27]. Our findings thus suggest that regulatory T cells might contribute to the development of immune unresponsiveness to αPD-1 therapy [28].
Furthermore, the frequency of IL-17–producing CD4+T lympho- cytes, which include T helper 17 (Th17) cells, was increased in PE of patients who did not benefit from αPD-1 therapy compared with those who did. In a mouse model of KRASmutation–positive lung cancer, expression of an IL-17 transgene was shown to confer intrinsic re- sistance to αPD-1 therapy, suggesting that IL-17 contributes to tumor promotion [29]. On the other hand, pleural Th17 cells are associated with better survival in non–small cell lung cancer patients receiving cancer treatments other than αPD-1 therapy [30]. The functions of IL-
17 and Th17 cells in the TME thus appear to be complex and might be dependent on treatment type. Our data suggest that an increased number of Th17 cells in PE might be a sign of early resistance to PD-1 blockade. We thus found that the response to αPD-1 therapy was as- sociated not with the characteristics of CD8+T lymphocytes but with those of CD4+T cells, suggesting that CD4+T lymphocytes may play an essential role in orchestration of immune reactions in cancer patients receiving αPD-1 therapy [31–34].
Our study has several limitations. First, given that the number of cancer patients who develop PE after the onset of αPD-1 therapy is limited [6,35], the number of such patients enrolled in the study was small. Second, we did not compare immune checkpoint protein ex- pression and cytokine production by T lymphocytes in PE with those in paired tumor specimens. However, sampling of tumor tissue during treatment is invasive and ethically not justifiable, especially in patients with lung cancer.
In conclusion, our study has revealed that there is a substantial number of patients who can benefit from continuation of αPD-1 therapy after the emergence of PE. Our findings indicate that lymphocytes ac- count for most of the immune cells in PE and that αPD-1 therapy up- regulates the expression of immune checkpoint proteins other than PD- 1 on T lymphocytes in PE. Furthermore, increased expression of LAG-3 and IL-17 by CD4+T lymphocytes was apparent in emergent PE of patients refractory to αPD-1 therapy. Our results thus provide insight into immune responses in the TME and provide a basis for further de- velopment of biomarkers for prediction of the efficacy or expansion of the therapeutic reach of cancer immunotherapy.
Fig. 1.Lymphocyte subsets in pleural effusion of patients in the anti–PD-1 therapy (αPD-1) and control groups as determined by flow cytometry. The total cell number (A); total number of lymphocytes (CD45+CD3+ cells and CD45+CD19+ cells) (B) and percentage of lymphocytes (C); frequency of B lymphocytes (CD45+CD19+cells) (D) or T lymphocytes (CD45+CD3+cells) (E) among all lymphocytes were determined for pleural effusion samples of patients in the αPD-1 (n = 9) and control (n = 15) groups. Bars indicate the median ± interquartile range. *P< 0.05; NS, not significant (Student’sttest).
Y. Ikematsu, et al. Lung Cancer 138 (2019) 58–64
61
Fig. 2.Representative flow cytometric analysis of immune checkpoint protein expression on CD4+or CD8+T lymphocytes in pleural effusion of patients in the anti–PD-1 therapy (αPD-1) and control groups. The surface expression of PD-1 and either TIM-3, TIGIT, LAG-3, or PD-L1 is shown. The patient in the αPD-1 group is no. 2 inTable 1.
Fig. 3.Immune checkpoint protein expression by CD4+or CD8+T lymphocytes in pleural effusion of patients in the anti–PD-1 therapy (αPD-1) and control groups.
Expression of PD-1, TIM-3, TIGIT, LAG-3, and PD-L1 for the αPD-1 group (n = 9) and the control group (n = 15) were determined by flow cytometry. Data in figure are means + SEM. *P< 0.05, **P< 0.01, ***P< 0.001; NS, not significant (Student’sttest).
Funding
This research did not receive any specific grant from funding agencies in the public, commercial, or not-for-profit sectors.
Declaration of Competing Interest
The authors declare no conflict of interest.
Appendix A. Supplementary data
Supplementary material related to this article can be found, in the online version, at doi:https://doi.org/10.1016/j.lungcan.2019.10.011.
References
[1] S. Sugiura, Y. Ando, H. Minami, M. Ando, S. Sakai, K. Shimokata, Prognostic value of pleural effusion in patients with non-small cell lung cancer, Clin. Cancer Res. 3 (1) (1997) 47–50.
[2] S. Bielsa, A. Salud, M. Martinez, A. Esquerda, A. Martin, F. Rodriguez-Panadero, J.M. Porcel, Prognostic significance of pleural fluid data in patients with malignant effusion, Eur. J. Intern. Med. 19 (5) (2008) 334–339.
[3] J.E. Pilling, M.E. Dusmet, G. Ladas, P. Goldstraw, Prognostic factors for survival after surgical palliation of malignant pleural effusion, J. Thoracic Oncol. 5 (10) (2010) 1544–1550.
[4] C. Blank, T.F. Gajewski, A. Mackensen, Interaction of PD-L1 on tumor cells with PD- 1 on tumor-specific T cells as a mechanism of immune evasion: implications for tumor immunotherapy, Cancer Immunol. Immunother.: CII 54 (4) (2005) 307–314.
[5] C. Robert, G.V. Long, B. Brady, C. Dutriaux, M. Maio, L. Mortier, J.C. Hassel, P. Rutkowski, C. McNeil, E. Kalinka-Warzocha, K.J. Savage, M.M. Hernberg, C. Lebbe, J. Charles, C. Mihalcioiu, V. Chiarion-Sileni, C. Mauch, F. Cognetti, A. Arance, H. Schmidt, D. Schadendorf, H. Gogas, L. Lundgren-Eriksson, C. Horak,
B. Sharkey, I.M. Waxman, V. Atkinson, P.A. Ascierto, Nivolumab in previously untreated melanoma without BRAF mutation, N. Engl. J. Med. 372 (4) (2015) 320–330.
[6] J. Brahmer, K.L. Reckamp, P. Baas, L. Crino, W.E. Eberhardt, E. Poddubskaya, S. Antonia, A. Pluzanski, E.E. Vokes, E. Holgado, D. Waterhouse, N. Ready, J. Gainor, O. Aren Frontera, L. Havel, M. Steins, M.C. Garassino, J.G. Aerts, M. Domine, L. Paz-Ares, M. Reck, C. Baudelet, C.T. Harbison, B. Lestini, D.R. Spigel, Nivolumab versus docetaxel in advanced squamous-cell non-small-cell lung cancer, N. Engl. J. Med. 373 (2) (2015) 123–135.
[7] A. Rittmeyer, F. Barlesi, D. Waterkamp, K. Park, F. Ciardiello, J. von Pawel, S.M. Gadgeel, T. Hida, D.M. Kowalski, M.C. Dols, D.L. Cortinovis, J. Leach, J. Polikoff, C. Barrios, F. Kabbinavar, O.A. Frontera, F. De Marinis, H. Turna, J.S. Lee, M. Ballinger, M. Kowanetz, P. He, D.S. Chen, A. Sandler, D.R. Gandara, Atezolizumab versus docetaxel in patients with previously treated non-small-cell lung cancer (OAK): a phase 3, open-label, multicentre randomised controlled trial, Lancet (Lond., Engl.) 389 (10066) (2017) 255–265.
[8] M. Reck, D. Rodriguez-Abreu, A.G. Robinson, R. Hui, T. Csoszi, A. Fulop, M. Gottfried, N. Peled, A. Tafreshi, S. Cuffe, M. O’Brien, S. Rao, K. Hotta, M.A. Leiby, G.M. Lubiniecki, Y. Shentu, R. Rangwala, J.R. Brahmer, Pembrolizumab versus chemotherapy for PD-L1-Positive non-small-cell lung cancer, N. Engl. J. Med.
375 (19) (2016) 1823–1833.
[9] R.J. Motzer, B. Escudier, D.F. McDermott, S. George, H.J. Hammers, S. Srinivas, S.S. Tykodi, J.A. Sosman, G. Procopio, E.R. Plimack, D. Castellano, T.K. Choueiri, H. Gurney, F. Donskov, P. Bono, J. Wagstaff, T.C. Gauler, T. Ueda, Y. Tomita, F.A. Schutz, C. Kollmannsberger, J. Larkin, A. Ravaud, J.S. Simon, L.A. Xu, I.M. Waxman, P. Sharma, Nivolumab versus everolimus in advanced renal-cell carcinoma, N. Engl. J. Med. 373 (19) (2015) 1803–1813.
[10] T. Yanagihara, K. Tanaka, K. Ota, E. Kashiwagi, A. Takeuchi, K. Tatsugami, M. Eto, Y. Nakanishi, I. Okamoto, Tumor-infiltrating lymphocyte-mediated pleuritis fol- lowed by marked shrinkage of metastatic kidney cancer of the chest wall during nivolumab treatment, Ann. Oncol. 28 (8) (2017) 2038–2039.
[11] D. Atanackovic, A. Block, A. de Weerth, C. Faltz, D.K. Hossfeld, S. Hegewisch- Becker, Characterization of effusion-infiltrating T cells: benign versus malignant effusions, Clin. Cancer Res. 10 (8) (2004) 2600–2608.
[12] H. Prado-Garcia, S. Romero-Garcia, D. Aguilar-Cazares, M. Meneses-Flores, J.S. Lopez-Gonzalez, Tumor-induced CD8+ T-cell dysfunction in lung cancer pa- tients, Clin. Dev. Immunol. 2012 (2012) 741741.
Fig. 4.Immune checkpoint protein expression and cytokine production by CD4+or CD8+T lymphocytes in pleural effusion of patients in the anti–PD-1 therapy (αPD-1) group who benefited or did not benefit from treatment. (A) Expression of PD-1, TIM-3, TIGIT, LAG-3, and PD-L1 for the benefit (n = 6) and nonbenefit (n = 3) subgroups of the αPD-1 group was determined by flow cytometry. (B and C) Representative flow cytometric analysis (B) and combined data (C) for IL-17 and IFN-γ production by CD4+or CD8+T lymphocytes for the benefit (n = 6) and nonbenefit (n = 3) subgroups of the αPD-1 group. Data in (A) are means + SEM, whereas bars in (C) indicate the median ± interquartile range. **P< 0.01, ***P< 0.001; NS, not significant (Student’sttest).
Y. Ikematsu, et al. Lung Cancer 138 (2019) 58–64
63
[13] P.S. Kim, R. Ahmed, Features of responding T cells in cancer and chronic infection, Curr. Opin. Immunol. 22 (2) (2010) 223–230.
[14] Y. Zhang, S. Huang, D. Gong, Y. Qin, Q. Shen, Programmed death-1 upregulation is correlated with dysfunction of tumor-infiltrating CD8+ T lymphocytes in human non-small cell lung cancer, Cell. Mol. Immunol. 7 (5) (2010) 389–395.
[15] S.L. Topalian, F.S. Hodi, J.R. Brahmer, S.N. Gettinger, D.C. Smith, D.F. McDermott, J.D. Powderly, R.D. Carvajal, J.A. Sosman, M.B. Atkins, P.D. Leming, D.R. Spigel, S.J. Antonia, L. Horn, C.G. Drake, D.M. Pardoll, L. Chen, W.H. Sharfman, R.A. Anders, J.M. Taube, T.L. McMiller, H. Xu, A.J. Korman, M. Jure-Kunkel, S. Agrawal, D. McDonald, G.D. Kollia, A. Gupta, J.M. Wigginton, M. Sznol, Safety, activity, and immune correlates of anti-PD-1 antibody in cancer, N. Engl. J. Med.
366 (26) (2012) 2443–2454.
[16] C. Grigg, N.A. Rizvi, PD-L1 biomarker testing for non-small cell lung cancer: truth or fiction? J. Immunother. Cancer 4 (2016) 48.
[17] A.C. Anderson, N. Joller, V.K. Kuchroo, Lag-3, Tim-3, and TIGIT: Co-inhibitory receptors with specialized functions in immune regulation, Immunity 44 (5) (2016) 989–1004.
[18] E. Elinav, R. Nowarski, C.A. Thaiss, B. Hu, C. Jin, R.A. Flavell, Inflammation-in- duced cancer: crosstalk between tumours, immune cells and microorganisms, Nat.
Rev. Cancer 13 (11) (2013) 759–771.
[19] R.W. Light, Clinical practice. Pleural effusion, N Engl. J. Med. 346 (25) (2002) 1971–1977.
[20] K. Tanaka, T. Yanagihara, Y. Ikematsu, H. Inoue, K. Ota, E. Kashiwagi, K. Suzuki, N. Hamada, A. Takeuchi, K. Tatsugami, M. Eto, K. Ijichi, Y. Oda, K. Otsubo, Y. Yoneshima, E. Iwama, Y. Nakanishi, I. Okamoto, Detection of identical T cell clones in peritumoral pleural effusion and pneumonitis lesions in a cancer patient during immune-checkpoint blockade, Oncotarget 9 (55) (2018) 30587–30593.
[21] V.L. Chiou, M. Burotto, Pseudoprogression and immune-related response in solid tumors, J. Clin. Oncol. 33 (31) (2015) 3541–3543.
[22] G. Liu, T. Chen, R. Li, L. Zhu, D. Liu, Z. Ding, Well-controlled pleural effusion in- dicated pseudoprogression after immunotherapy in lung cancer: a case report, Thorac. Cancer 9 (9) (2018) 1190–1193.
[23] A. Yoshimura, C. Takumi, T. Tsuji, R. Hamashima, S. Shiotsu, T. Yuba, Y. Urata, N. Hiraoka, Pulmonary pleomorphic carcinoma with pseudoprogression during nivolumab therapy and the usefulness of tumor markers: a case report, Clin. Case Rep. 6 (7) (2018) 1338–1341.
[24] R. Elias, P. Kapur, I. Pedrosa, J. Brugarolas, Renal cell carcinoma pseudoprogression with clinical deterioration: to hospice and back, Clin. Genitourin. Cancer 16 (6) (2018) 485–488.
[25] D.S. Thommen, T.N. Schumacher, T cell dysfunction in cancer, Cancer Cell 33 (4) (2018) 547–562.
[26] S. Koyama, E.A. Akbay, Y.Y. Li, G.S. Herter-Sprie, K.A. Buczkowski, W.G. Richards, L. Gandhi, A.J. Redig, S.J. Rodig, H. Asahina, R.E. Jones, M.M. Kulkarni, M. Kuraguchi, S. Palakurthi, P.E. Fecci, B.E. Johnson, P.A. Janne, J.A. Engelman, S.P. Gangadharan, D.B. Costa, G.J. Freeman, R. Bueno, F.S. Hodi, G. Dranoff, K.K. Wong, P.S. Hammerman, Adaptive resistance to therapeutic PD-1 blockade is associated with upregulation of alternative immune checkpoints, Nat. Commun. 7 (2016) 10501.
[27] C.T. Huang, C.J. Workman, D. Flies, X. Pan, A.L. Marson, G. Zhou, E.L. Hipkiss, S. Ravi, J. Kowalski, H.I. Levitsky, J.D. Powell, D.M. Pardoll, C.G. Drake, D.A. Vignali, Role of LAG-3 in regulatory T cells, Immunity 21 (4) (2004) 503–513.
[28] M.E. Marmarelis, C. Aggarwal, Combination immunotherapy in non-small cell lung cancer, Curr. Oncol. Rep. 20 (7) (2018) 55.
[29] E.A. Akbay, S. Koyama, Y. Liu, R. Dries, L.E. Bufe, M. Silkes, M.M. Alam, D.M. Magee, R. Jones, M. Jinushi, M. Kulkarni, J. Carretero, X. Wang, T. Warner- Hatten, J.D. Cavanaugh, A. Osa, A. Kumanogoh, G.J. Freeman, M.M. Awad, D.C. Christiani, R. Bueno, P.S. Hammerman, G. Dranoff, K.K. Wong, Interleukin- 17A promotes lung tumor progression through neutrophil attraction to tumor sites and mediating resistance to PD-1 blockade, J. Thorac. Oncol. 12 (8) (2017) 1268–1279.
[30] Z.J. Ye, Q. Zhou, Y.Y. Gu, S.M. Qin, W.L. Ma, J.B. Xin, X.N. Tao, H.Z. Shi, Generation and differentiation of IL-17-producing CD4+ T cells in malignant pleural effusion, J. Immunol. 185 (10) (2010) 6348–6354.
[31] M. Mitsdoerffer, Y. Lee, A. Jager, H.J. Kim, T. Korn, J.K. Kolls, H. Cantor, E. Bettelli, V.K. Kuchroo, Proinflammatory T helper type 17 cells are effective B-cell helpers, Proc. Natl. Acad. Sci. U.S.A. 107 (32) (2010) 14292–14297.
[32] M.N. Kelly, M. Zheng, S. Ruan, J. Kolls, A. D’Souza, J.E. Shellito, Memory CD4+ T cells are required for optimal NK cell effector functions against the opportunistic fungal pathogen Pneumocystis murina, J. Immunol. 190 (1) (2013) 285–295.
[33] D.G. DeNardo, J.B. Barreto, P. Andreu, L. Vasquez, D. Tawfik, N. Kolhatkar, L.M. Coussens, CD4(+) T cells regulate pulmonary metastasis of mammary carci- nomas by enhancing protumor properties of macrophages, Cancer Cell 16 (2) (2009) 91–102.
[34] M. Veldhoen, H. Moncrieffe, R.J. Hocking, C.J. Atkins, B. Stockinger, Modulation of dendritic cell function by naive and regulatory CD4+ T cells, J. Immunol. 176 (10) (2006) 6202–6210.
[35] H. Borghaei, L. Paz-Ares, L. Horn, D.R. Spigel, M. Steins, N.E. Ready, L.Q. Chow, E.E. Vokes, E. Felip, E. Holgado, F. Barlesi, M. Kohlhaufl, O. Arrieta, M.A. Burgio, J. Fayette, H. Lena, E. Poddubskaya, D.E. Gerber, S.N. Gettinger, C.M. Rudin, N. Rizvi, L. Crino, G.R. Blumenschein Jr., S.J. Antonia, C. Dorange, C.T. Harbison, F. Graf Finckenstein, J.R. Brahmer, Nivolumab versus docetaxel in advanced non- squamous non-small-cell lung cancer, N. Engl. J. Med. 373 (17) (2015) 1627–1639.