•
•
•
Ca + 2H
2
O → Ca(OH)
2
+ H
2
2Ca + O
2
→ 2CaO
CaO+ H
2
O → Ca(OH)
2
1
O
46
2
Si
28
3
Al
8
4
Fe
5
5
Ca
4
1
Cl
58
2
Na
32
3
Mg
4
4
S
3
5
Ca
1
4%
1%
0.03%
0.00005%
0.0000000000004%
0.0000000006%
1/6 G
1 G
•
•
Ca
Mg
P
FGF23
osteocalcin
600 mg Ca in diet
900 mg
140 mg
300 mg
500 mg
10,000 mg
9,840 mg
160 mg in urine
440 mg
in feces
PI3K
PI, PtdIns
PI3K
PI3K
SFK
adaptor
GPCR
PI3K
PI3K
PI-3,4,5-P
3
Akt
Tec
ArfGEF
Rac
Rac
SWAP70
Nature, 2002
O
2-O
2-O
2-JBC, 2007; -JBC, 2010
Tec
Tec
Src
Y
es1Fyn Lck Lyn Fgr Hck Blk Syk
Zap70
Jak1Jak2Jak3Tyk2
Tec Btk
Itk
Bmx Txk Ptk2
Ptk2b
Fes
Fert2
CskMatk Srms
Frk
Ptk6
0
200
400
600
800
1000
A
verage dif
ference
0
200
400
600
800
1000
0h
24h
48h
72h
0d
7d
21d
Src
Syk
Jak
Tec
FAK Fes Csk Others
破骨細胞
骨芽細胞
Src
Y
es1Fyn Lck Lyn Fgr Hck Blk Syk
Zap70
Jak1Jak2Jak3Tyk2
Tec Btk
Itk
Bmx Txk Ptk2
Ptk2b
Fes
Fert2
CskMatk Srms
Frk
Ptk6
Src
Syk
Jak
Tec
FAK Fes Csk Others
A
verage dif
ference
Tec
Btk Tec
Tec
X
CT
WT
Tec
-/-Btk
-/-In vitro
Tyrosine Kinases Btk and Tec
Regulate Osteoclast Differentiation
by Linking RANK and ITAM Signals
Masahiro Shinohara,1,2Takako Koga,1,2Kazuo Okamoto,1,2Shinya Sakaguchi,4Kimiko Arai,1,5Hisataka Yasuda,7
Toshiyuki Takai,6Tatsuhiko Kodama,8Tomohiro Morio,3Raif S. Geha,9Daisuke Kitamura,10Tomohiro Kurosaki,11
Wilfried Ellmeier,4and Hiroshi Takayanagi1,2,* 1Department of Cell Signaling, Graduate School
2Center of Excellence Program for Frontier Research on Molecular Destruction and Reconstruction of Tooth and Bone 3Department of Pediatrics and Developmental Biology, Graduate School
Tokyo Medical and Dental University, Yushima 1-5-45, Bunkyo-ku, Tokyo 113-8549, Japan
4Institute of Immunology, Center for Physiology, Pathophysiology, and Immunology, Medical University of Vienna, Lazarettgasse 19,
Vienna 1090, Austria
5Division of Orthodontics and Dentofacial Orthopedics, Graduate School of Dentistry 6Department of Experimental Immunology, Institute of Development, Aging, and Cancer
Tohoku University, Seiryo-machi 4-1, Aoba-ku, Sendai, Miyagi 980-8575, Japan
7Nagahama Institute for Biochemical Science, Oriental Yeast Co., Ltd., Kanoh-cho 50, Nagahama,
Shiga 526-0804, Japan
8Department of Molecular Biology and Medicine, Research Center for Advanced Science and Technology, University of Tokyo,
Komaba 4-6-1, Meguro-ku, Tokyo 153-8904, Japan
9Division of Immunology, Children’s Hospital, One Blackfin Circle, Boston, MA 02115, USA
10Division of Molecular Biology, Research Institute for Biological Sciences, Tokyo University of Science, Yamazaki 2669,
Noda, Chiba 278-0022, Japan
11Laboratory for Lymphocyte Differentiation, RIKEN Research Center for Allergy and Immunology, RIKEN Yokohama Institute,
Suehiro-cho 1-7-22, Tsurumi-ku, Yokohama, Kanagawa 230-0045, Japan *Correspondence:[email protected]
DOI 10.1016/j.cell.2007.12.037
SUMMARY
Certain autoimmune diseases result in abnormal
bone homeostasis, but association of
immunodefi-ciency with bone is poorly understood. Osteoclasts,
which derive from bone marrow cells, are under the
control of the immune system. Differentiation of
oste-oclasts is mainly regulated by signaling pathways
activated by RANK and immune receptors linked to
ITAM-harboring adaptors. However, it is unclear
how the two signals merge to cooperate in osteoclast
differentiation. Here we report that mice lacking
the tyrosine kinases Btk and Tec show severe
osteo-petrosis caused by a defect in bone resorption.
RANK and ITAM signaling results in formation of
a Btk(Tec)/BLNK(SLP-76)-containing complex and
PLCg-mediated activation of an essential calcium
signal. Furthermore, Tec kinase inhibition reduces
osteoclastic bone resorption in models of
osteopo-rosis and inflammation-induced bone destruction.
Thus, this study reveals the importance of the
osteo-clastogenic signaling complex composed of tyrosine
kinases, which may provide the molecular basis for
a new therapeutic strategy.
INTRODUCTION
Bone homeostasis depends on balanced action of bone-resorb-ing osteoclasts and bone-formbone-resorb-ing osteoblasts (Karsenty and Wagner, 2002). Tipping the balance in favor of osteoclasts leads to diseases with a low bone mass, whereas impaired osteoclas-tic bone resorption results in diseases with a high bone mass, including osteopetrosis (Teitelbaum and Ross, 2003). Bone re-serves calcium and responds to calcium-regulating hormones, but osteoclasts and osteoblasts are not only regulated by the en-docrine system. The immune and bone systems share numerous regulatory factors, including cytokines, receptors, signaling mol-ecules, and transcription factors (Theill et al., 2002; Walsh et al., 2006; Takayanagi, 2007). Therefore, the pathology of one system may very well affect the other: it is well documented that en-hanced bone resorption is associated with activation of the im-mune system observed in autoimim-mune or inflammatory diseases such as rheumatoid arthritis and periodontitis (Theill et al., 2002; Takayanagi, 2007).
Diseases with impaired immune responses are also associ-ated with bone abnormalities, but it is poorly understood how the immunodeficiencies are functionally related to bone disor-ders. Hyperimmunoglobulin E (IgE) syndrome is characterized by skeletal symptoms such as osteoporosis (Kirchner et al., 1985) and scoliosis (Grimbacher et al., 1999), which are partly explained by the abnormality of osteoblasts and osteoclasts
794 Cell 132, 794–806, March 7, 2008ª2008 Elsevier Inc.
Rheumatoid Arthritis
•
•30-50
•
1
70
•RA
B
T
Btk Btk Btk Btk Btk BtkRANKL
Btk
Btk
LPS
Btk
Btk
ibrutinib
Ibrutinib
Figure 1
A
0 nM
0.1 nM
0.3 nM
1 nM
3 nM
10 nM
30 nM
100 nM
0
100
200
300
0 0.1 0.3 1
3 10 30 100
0
20
40
60
80
100
0 0.1 0.3 1
3 10 30 100
0
10
20
30
40
0 0.1 0.3 1
3 10 30 100 UV
B
C
D
E
0 nM
0.1 nM
0.3 nM
1 nM
3 nM
10 nM
30 nM
100 nM
F
0
0.2
0.4
0.6
0.8
1
1.2
0 0.1 0.3 1
3 10 30 100
0
20
40
60
80
100
120
0 0.1 0.3 1
3 10 30 100
G
(nM)
(nM)
(nM)
(nM)
(nM)
T
R
AP
+MN
C
n
umb
er
(cm
-2)
Brd
U
in
co
rp
ora
tio
n
(%
)
Ratio of
T
U
N
EL
-p
osi
tive
ce
lls
(%
)
R
el
at
ive
AL
P
act
ivi
ty
Al
iza
rin
re
d
(µ
M)
n.s.
n.s.
n.s.
n.s.
+ibrutinib
control
Ibrutinib
REVIEWS Drug Discovery Today!Volume 19, Number 8!August 2014
Bruton’s
tyrosine
kinase
inhibitors
for
the
treatment
of
rheumatoid
arthritis
Jennifer
A.
Whang
and
Betty
Y.
Chang
Pharmacyclics,Inc.,999EastArquesAvenue,Sunnyvale,CA94085,USA
The
function
and
role
of
Bruton’s
tyrosine
kinase
(BTK)
in
human
B
cell
development
was
demonstrated
by
its
association
with
X-linked
agammaglobulinemia
(XLA)
manifested
by
a
substantial
reduction
in
immunoglobulins
and
B
cells.
BTK
has
a
crucial
role
in
pre-B
cell
receptor
(BCR)
and
BCR
signaling
during
normal
B
cell
development
and
activation.
Aberrant
BCR
signaling
is
associated
with
autoimmune
diseases,
such
as
rheumatoid
arthritis
(RA).
In
addition,
BTK
is
also
expressed
in
myeloid
cell
populations,
including
monocytes,
macrophages,
neutrophils
and
mast
cells.
These
innate
cells
infiltrate
the
synovial
cavity
and
produce
inflammatory
cytokines,
aggravating
arthritic
symptoms.
In
myeloid
cell
populations,
BTK
functions
downstream
of
the
Fcg
receptors
(FcgR)
and
Fce
receptors
(FceR)
[1,2]
.
In
the
absence
of
BTK,
FcR-mediated
functions,
such
as
cytokine
production,
are
impaired.
In
addition,
Xid
mice,
which
have
a
mutation
in
BTK,
have
decreased
susceptibility
to
developing
collagen-induced
arthritis
(CIA)
[3]
.
Given
that
BTK
is
involved
in
multiple
signaling
pathways
downstream
of
the
BCR
and
FcR,
it
is
an
attractive
therapeutic
target
for
RA.
Introduction
Thedysregulationoftheimmunesystemcanresultin abnor-malimmuneresponsesagainstself-tissues,leadingtothe
devel-opment and pathogenesis of autoimmune diseases. A
combinationofgeneticsandenvironmentalfactorshasbeen
attributedtoautoimmunedisorders,butthetriggersthat
initi-atethediseaseareunknown.RAisoneofmanyautoimmune
diseasescharacterizedbyunusualTcellactivationandBcell function,circulatingautoantibodiesandincreased pro-inflam-matorycytokines.All thesefactorscontributetotheclinical manifestationsofRA,whichincludesynovialhyperplasia, pan-nus formation, cartilage damage and joint destruction [4]. Persistentinflammationlocalized inthejoints consequently
leadsto systemic complications affectingnumerous organs,
includingbut not limited tothebrain, liver andlungs[4]. Therefore,itisofgreatinteresttoidentifyatherapeutictarget thatcanattenuatetheactionsofmultiplefactorscontributing toRApathogenesis.
Pathogenesis
of
RA
Theeffectorfunctionsofimmunecellscontributetothe patho-genesisofRA.Infectionsandtissueinjuryarehypothesizedto initiatethedisease.TheinitiationofRAinvolvesthepresentation ofself-antigens,leadingtotheactivationofTandBlymphocytes. Activationoftheadaptiveimmuneresponseresultsincytokine secretionandautoantibodyproduction,whichpromotes inflam-mation.Furthermore,interactionsbetweenTandBcellsinthe synovium are capableof sustainingcell activation. Persistent
inflammation occursasa resultof theformationof immune
complexes that activate synovium-infiltrating myeloid cells, whichincludemonocytes,macrophages,neutrophils,dendritic cellsandmastcells.Thereleaseofproinflammatorycytokinesand matrixmetalloproteasesbyactivatedTcellsandmyeloidcells causescartilagedamageandjointdestruction.Thedestruction of tissuecausesthe releaseofadditionalself-antigens,further potentiatingthedisease.Finally,chronicinflammationinduces boneerosionthroughosteoclastactivation[5].
GiventheabundanceofTcellsinthesynovialcavityandtheir abilitytoactivateBcellsduringRA,thiscellpopulationhasbeen anattractivetargetforRAtherapy.AlthoughtheblockadeofTcell
Reviews
!
POST
SCREEN
E-mailaddresses:[email protected],[email protected].
1200 www.drugdiscoverytoday.com 1359-6446/06/$-seefrontmatter!2014ElsevierLtd.Allrightsreserved.http://dx.doi.org/10.1016/j.drudis.2014.03.028
0 5 10 15 20 25 30 35 40 45 0 2,000 4,000 6,000 8,000 10,000 12,000 14,000 1950 1955 1960 1965 1970 1975 1980 1985 1990 1995 2000 2005 2010 2015 2020 2025 2030 2035 2040 2045 2050 2055 2060 75 65 74 20 64 19 65
2010
28.4%
CKD
l
l
PTH
Calcitonin
Cytokines
Insulin
Leptin
Adiponectin
Estrogen
Testosterone
FSH, TSH
Sympathetic nerve
Vitamin D3
Corticosteroid
Retinoic acid
RANKL
RANKL
T
B
T
RANKL
B
T
RANKL
RANKL
RANKL
RANKL
↓
Tatsumi et al., Cell Metab, 2007
Nakashima et al., Nat Med, 2011
RANKL
RANKL exon1
ATG
ATG
tdTomato-Cre
RANKL promoter
tdTomato-Cre
RANKL
JAXA
1G
JAXA
30
1G
l
l
l
l
1G
l
l
…
…
…
(macrophage/monocyte)
RANKL
TRAP (tartrate-resistant acid phosphatase)
CtsK (cathepsin K)
HCl
BMP BMP IGF IGFRANKL
OPG
IGF
BMP
SOST/Dkk1
Wnt
Sema4D
Estrogen
IFNg
IFNβ
IL4
TNFα
IL1β
IL6
IL17
VitD
3
Estrogen
RANKL OPG
RANK: RANKL
OPG: RANKL
0 50 100 150 200 250 300 4w 8w 12w
RANKL
0 500 1000 1500 2000 2500 3000 3500 4w 8w 12wOPG
0 0.02 0.04 0.06 0.08 0.1 0.12 0.14 0.16 4w 8w 12wRANKL/OPG ratio
RANKL OPG
pg ml n=5
l
RANKL
OPG
1. 2009 8 4 10 13 2.3. JAX® Mice Strain C57BL/6J 4. 292×440×200H(mm) 235×325×170H(mm) 30 / , 10 / 20 25 21 23 45 70 55±5 30 200Pa 6 00 18 00 18 00 6 00 3 4 5 6 7 8 9 10 11 12 13 n 60 60 60 60 60 60 60 60 60 60 60 (g) 8.7 14.1 18.9 21.2 23.1 24.2 24.7 25.3 25.9 26.7 27.2 0.50 1.07 1.13 1.17 0.96 0.93 0.97 1.01 1.03 1.02 1.05 3 4 5 6 7 8 9 10 11 12 13 n 40 40 40 40 40 40 40 40 40 40 40 (g) 8.6 14.0 17.6 18.0 18.9 19.4 19.8 20.6 21.1 21.8 22.0 0.50 1.00 0.74 0.61 0.65 0.62 0.69 0.72 0.66 0.77 0.88 JAX® is a registered trademark of The Jackson Laboratory. All rights reserved.
110 30 22kcal% 62kcal% 16kcal%
JAX
JAX
JAX
JAX
®®®®Mice Strain C57BL/6J
Mice Strain C57BL/6J
Mice Strain C57BL/6J
Mice Strain C57BL/6J
121 20
5-8ppm
JAX® Mice Strain C57BL/6J 3 13 0 5 10 15 20 25 30 3 4 5 6 7 8 9 10 11 12 13 (g ) 2009 11
RANKL
Ca 650~800mg
VitD, VitK
bone mineral density
YAM (young adult mean):
FRAX:
l
l
BMD
l
BMD
l
BMD
BMD
BAP
OC
P1NP
TRAP
CTX
WPM/41
骨代謝マーカーの種類と利用法について
はじめに
骨粗鬆症は、骨折による患者のQOL(quality of life)悪化に加え、高齢化社会に伴う介護や医療
費増加の観点からも注目されている疾患のひとつである。対策が急がれる中、骨折予防効果が科学
的に証明され、新たな治療薬の登場や骨代謝マーカーの臨床応用によって、骨粗鬆症治療は大きく
変わろうとしている。そこで今回、骨代謝マーカーの種類と利用法についてまとめてみました。
■ 骨代謝マーカーとは
骨は一度作られたら一生変化しないように見えますが、破骨細胞が古い骨を壊し(骨吸収)、骨芽
細胞が新しい骨を作る(骨形成)という骨代謝が常に繰り返されて新しい骨に生まれ変わっています。
この様な骨代謝回転を評価する指標として骨吸収マーカーと骨形成マーカーがあります。骨吸収
マーカーや骨形成マーカーを測定することにより今後骨密度がどの様に変化するのか知ることが可
能と考えられています。
一方、骨密度測定では、こうした骨代謝の結果、形成された現在の骨密度が多いか少ないかを知
ることができますが、今後骨密度がどのように変化するかを知ることはできません。
■ 骨代謝のしくみ 図1
骨は骨吸収と骨形成を繰り返して
新陳代謝をおこなっています
■ 骨粗鬆症における骨密度と骨代謝マーカーの特徴 表1
骨密度(BMD)
骨代謝マーカー
骨粗鬆症の診断
骨粗鬆症の予知
過去の骨代謝の総決算
リアルタイムな骨代謝
局所骨の評価
全身骨の平均評価
治療効果の確認1∼2年
3∼6ヵ月
施設の制限
簡便
整・災外47:327-336,2004
■ 骨代謝マーカーの主な種類
骨代謝マーカーは骨形成マーカーと骨吸収マーカーに大別されます。
<骨形成マーカー>
骨芽細胞に由来する酵素の骨型ALP(BAP)
石灰化の調節因子のオステオカルシン(OC)
コラーゲン前駆体の断片(プロペプチド)・・・PICP、PINP
l
Yoshimura et al., Osteoporos Jpn, 2005
l
Ivaska et al., J Bone Miner Res, 2010
–
l
l
l
l
BMD
BMD
(DBMD/Dt)
DBMD/Dt = k
ob
[BF] – k
oc
[BR]
BMD
BF
=
BR
=
BF
BAP
OC
P1NP
BR
TRAP
CTX
(DBMD/Dt)
DBMD/Dt = k
ob
[BF] – k
oc
[BR]
BMD
Peterson and Riggs, CPT Pharmacom Syst Pharmacol
[BF] [BR]
k
ob
k
oc
BMD
RANKL
OPG
IGF
BMP
SOST/Dkk1
Wnt
Sema4D
RANKL
OPG
SOST/Dkk1
TRAP
P1NP
CT
control
osteoporosis
BV/TV BS/BV
CT
microCT
3D-BON
TRI/3D-BON
・骨梁構造
マイクロX線CTによる骨断層像を基に海綿骨の
3次元ネットワーク構造を直接解析する。
3D骨梁構造計測項目
3D骨梁構造計測項目
■ 骨密度 : BV/TV ���■ 骨梁曲面Euler数
骨梁幅 : Tb.Th������ �一次元Betti数
骨梁数 : Tb.N������� 骨梁表面フラクタル次元
骨梁中心距離 : Tb.spac���骨パターンファクターTBPf
TBPf・SMI
TBPf・SMI
■ TBPf
骨パターンファクター
TBPf(Trabecular Bone Pattern factor)
3D空間上で骨梁の表面近傍体積の変化に対する
表面積の変化量を計算。
これより、従来の2次元TBPfではできなかった
3D凹面構造の定量化が可能。
凹面構造の多い骨梁は負となり凸面構造の
多い骨梁は正となる。
������
���TBPf=ΔBS/ΔBV (1/mm)
■ SMI HILDEBRAND&RUEGSEGGERによる
ストラクチャーモデルインデックス
(Stracture Model Index) : SMI
骨梁構造指標を理想的な板状のとき 0、
棒状のとき3、
球状のとき4として
混合状態を中間値で表現する。
ストラクチャーモデルによる骨梁巾:thickness
骨梁抽出・分離
骨梁抽出・分離
■ 骨組織を3次元画像処理により抽出分離する。
中間断層は3D補間法により分離。
計測対象となる骨組織を切り出し分離する。
骨領域は、次の3領域に分離される。
microCT
Rat大腿骨海綿骨とMIL楕円体���� 3DMIL定義骨梁ネットワーク構造解析
骨梁ネットワーク構造解析
Node-Strut
Node-Strut
骨梁の骨格線ネットワークを抽出して、骨格線を
端点接続状態で分類し、計測する。
��� Rat大腿骨全海綿骨の骨格線 Rat大腿骨海綿骨とNode-Strut骨梁ネットワーク構造解析
骨梁ネットワーク構造解析
Node-StrutⅡ
Node-StrutⅡ
骨梁の厚さ、幅、長さを3D画像から直接算出し、
板状骨、棒状骨に分離して、骨梁3D構造パラメーター
を算出する。
骨格線と骨梁厚み��������������骨梁厚みの疑似カラー表示� �����������������������(太)赤→黄→緑(細) ■�板状骨の個数����������■�棒状骨の個数 ��平均:厚さ�������������平均:径 ��平均:幅��������������平均:長さ ��平均:長さ������������骨梁体積に占める棒状骨の割合 �骨梁体積にしめる板状骨の割合 ■�骨梁幅の変化に対するトポロジー変化 ��板状骨に穴が発生する割合 ��棒状骨が切断する割合 Nd :複数骨格線の結節点 Tm :孤立端点 Ct :皮質骨との結合点 TV :計測対象組織体積 Rat大腿骨海綿骨とMIL楕円体���� 3DMIL定義骨梁ネットワーク構造解析
骨梁ネットワーク構造解析
Node-Strut
Node-Strut
骨梁の骨格線ネットワークを抽出して、骨格線を 端点接続状態で分類し、計測する。 ��� Rat大腿骨全海綿骨の骨格線 Rat大腿骨海綿骨とNode-Strut骨梁ネットワーク構造解析
骨梁ネットワーク構造解析
Node-StrutⅡ
Node-StrutⅡ
骨梁の厚さ、幅、長さを3D画像から直接算出し、 板状骨、棒状骨に分離して、骨梁3D構造パラメーター を算出する。 骨格線と骨梁厚み��������������骨梁厚みの疑似カラー表示� �����������������������(太)赤→黄→緑(細) ■�板状骨の個数����������■�棒状骨の個数 ��平均:厚さ�������������平均:径 ��平均:幅��������������平均:長さ ��平均:長さ������������骨梁体積に占める棒状骨の割合 �骨梁体積にしめる板状骨の割合 ■�骨梁幅の変化に対するトポロジー変化 ��板状骨に穴が発生する割合 ��棒状骨が切断する割合 Nd :複数骨格線の結節点 Tm :孤立端点 Ct :皮質骨との結合点 TV :計測対象組織体積 ■ 端点個数 N.Nd N.Tm N.Ct ■ 単位体積当りの端点数 ■ 骨格線個数 N.NdNd N.CtNd N.NdTm ■ 骨格線の平均長E(NdNd) E(CtNd) E(NdTm) ■ 骨格線総長 TSL ■ 骨格線 構成比 総NdNd長/TSL 総CtNd長/TSL 総NdTm長/TSL ■ 組織量に対する骨格線長 TSL /TV 総NdNd長/TV Rat大腿骨海綿骨とNode-Strut総CtNd長/TV 総NdTm長/TV その他 ����� 骨梁(白)と厚み ������(太)赤→黄→緑(細)
TRI/3D-BON-C
・皮質骨3D計測オプション
■ 端点個数 N.Nd N.Tm N.Ct ■ 単位体積当りの端点数 ■ 骨格線個数 N.NdNd N.CtNd N.NdTm ■ 骨格線の平均長
E(NdNd) E(CtNd) E(NdTm) ■ 骨格線総長 TSL ■ 骨格線 構成比 総NdNd長/TSL 総CtNd長/TSL 総NdTm長/TSL ■ 組織量に対する骨格線長 TSL /TV 総NdNd長/TV Rat大腿骨海綿骨とNode-Strut総CtNd長/TV 総NdTm長/TV その他 ����� 骨梁(白)と厚み ������(太)赤→黄→緑(細)
TRI/3D-BON-C
・皮質骨3D計測オプション
microCT
RNA
RNA-seq
RNA
RNA-seq
ChIP-seq
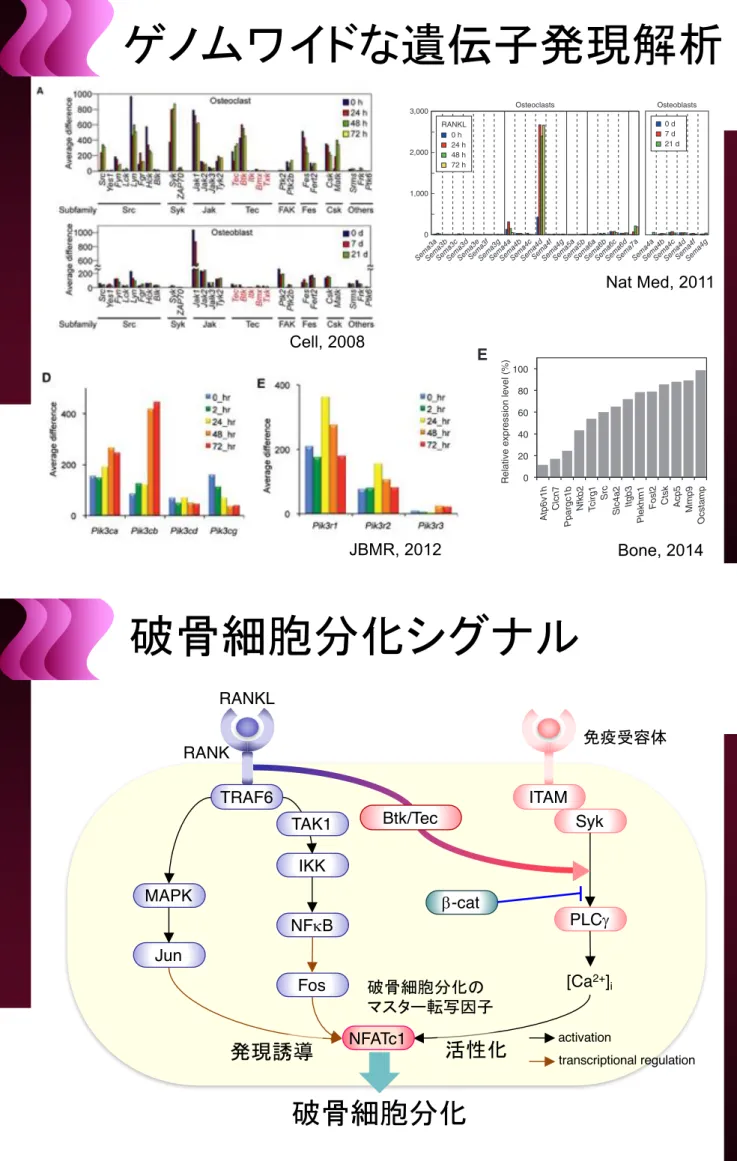
Figure 1. Osteopetrotic Phenotype of Tec!/!Btk!/!Mice
(A) GeneChip analysis of mRNAs for nonreceptor tyrosine kinases during osteoclast and osteoblast differentiation. FAK, focal adhesion kinase; Fes, feline sarcoma oncogene; Csk, c-src tyrosine kinase.
(B) RT-PCR analysis of Tec, Btk, and Itk mRNAs in WT and Tec!/!Btk!/!BMMs. (C) Expression of Tec, Btk, and Itk proteins in WT and Tec!/!Btk!/!BMMs. 796 Cell 132, 794–806, March 7, 2008ª2008 Elsevier Inc.
Cell, 2008
A R T I C L E S
1474 VOLUME 17 | NUMBER 11 | NOVEMBER 2011 NATURE MEDICINE
Fc-sema4D (µg ml–1) 10 20 Control IgG Fc-sema4D (µg ml–1) Fc-sema4D (µg ml–1) 50 0 200 Alizarin red ( µM) 150 10 20 100 0 *** *** 0 1.0
Relative ALP activity ( A450 ) 0.5 10 20 0 *** **
c
j
f
a
Fc-sema4D (µg ml–1) BglapRelative mRNA expression (%)
10 20 0 0 100 75 * *** 50 25 Col1a1 10 20 0 0 100 75 50 25 ** ***
h
g
RANKL 0Sema4D (ng per well)
50 25 ND Supernatant Lysate NS NS
i
WT − Osteoclast culture supernatant Culture with osteoclasts Origin of osteoclasts Alizarin red ( µM) 50 0 200 150 * 100 NS – 100 0 400 300 ** 200 NS Supernatant Osteoclasts – Anti-Sema4D 500 50 100 500 Control IgG (ng ml–1) 500 Control IgG 500 * ** *** *** 0 Alizarin red (µ M) 200 400 Osteoclasts − − − − WT NS NS Anti-Sema4D (ng ml−1) 50 100 500 Bone volume/ tissue volume (%) 20 15 10 5 0 ** Recipients ** Donor BMsd
20e
15 10 5 0Osteoclast surface/ bone surface (%)
NS 15
10 5 0
Eroded surface/ bone surface (%)
NS 0 4 2 6 8
Osteoclast number/ bone perimeter (mm
–1) NS
b
1 mm WT Sema4d–/– WT WT WT WT Sema4d –/– Sema4d –/– Sema4d –/– Sema4d –/– 1 mm 20 0 40 60 Trabecular thickness ( µm) *** Energy (N.mm) 0 15 10 5 * *** 20 15 10 5 0 Bone volume/tissue volume (%) Load of failure (N)
0 9 6 3
*
Sema3aSema3bSema3c Sema3eSema3dSema3f Sema4aSema3g Sema4bSema4cSema4dSema4fSema4gSema5aSema5bSema6aSema6bSema6cSema6dSema7a
Osteoclasts Osteoblasts
Sema4aSema4bSema4cSema4dSema4fSema4g
3,000 1,000 0 2,000 0 h 24 h 48 h 72 h RANKL 0 d 7 d 21 d WT
Osteoblast surface/ bone surface (%)
20 10 0 30
40 *
Osteoid surface/ bone surface (%)
10 5 0 15
20 *
Bone formation rate (mm
3 cm –2 year –1) 2 1 0 3 4 5 *** 50 µm 0 h 24 h 48 h 96 h WT Sema4d –/– WT Sema4d –/– WT Sema4d –/– Sema4d–/– WT WT WT Sema4d –/– WT Sema4 d–/– WT WT Sema4d –/– Sema4d –/– Sema4d –/– Sema4d–/– WT Sema4 d–/– Sema4d –/– Sema4d–/–
Figure 1 Inhibition of bone formation by osteoclast-derived Sema4D. (a) Genome-wide screening of mRNA for the semaphorin family proteins during differentiation of osteoclasts and osteoblasts. (b) Microcomputed tomography (MCT) of the proximal femur of the wild-type (WT) and Sema4d−/− mice
(top left, axial view of the metaphyseal region; bottom left, longitudinal view). Bone volume and trabecular thickness were determined by MCT analysis (middle). Maximum load to failure and energy resorption were determined by the three-point bending test (right). (c) Bone formation, as observed by calcein double labeling at an interval of 4 d (top) and the parameters for osteoblastic bone formation, as determined by bone morphometric analysis (bottom). (d) The parameters for osteoclastic bone resorption, as determined by bone morphometric analysis. (e) Bone volume after adoptive transfer of wild-type or Sema4d−/− bone marrow cells (BMs) to wild-type (left) and Sema4d−/− (right) mice. (f) Effect of Fc-sema4D on bone nodule formation.
Left, Alizarin red staining; middle, amount of alizarin red; right, effect of Fc-sema4D on ALP activity. (g) Effect of Fc-sema4D on the mRNA expression of Bglap and Col1a1. (h) The amount of Sema4D in the osteoclast supernatant and the cell lysate during osteoclast differentiation. The amount of Sema4D was analyzed using bone-resorbing osteoclasts 96 h after RANKL stimulation. (i) Effect of osteoclast culture supernatant or coculture with osteoclasts on bone nodule formation. Left, Alizarin red staining; right, amount of the alizarin red. (j) Effect of antibody to Sema4D (anti-Sema4D) on bone formation in wild-type osteoblasts cocultured with wild-type or Sema4d−/− osteoclasts. Left, Alizarin red staining; right, amount of alizarin red.
*P < 0.05; **P < 0.01; ***P < 0.005; NS, not significant; ND, not detected. Error bars show s.e.m.
Nat Med, 2011
Because M-CSF is one of the potent growth factors that activate class IA PI3K in osteoclasts,(33)we examined the effect of
M-CSF on osteoclast PI-3,4,5-P3generation. M-CSF induced a
rapid and marked increase in the PI-3,4,5-P3level (Fig. 1F), and
ultimately caused its accumulation at the plasma membrane (Fig. 1G). M-CSF stimulation disrupted the podosome ring, and the lamellipodia was formed at the cell periphery (Fig. 1G). The disruption of the podosome ring, accompanied by lamellipodia
Fig. 1. Temporal and spatial regulation of PI-3,4,5-P3 and the actin structure by M-CSF stimulation. (A) The level of PI-3,4,5-P3during osteoclast
differentiation. Osteoclast precursor cells were treated with (red) or without (blue) RANKL for the indicated periods. Data are represented as mean! SEM of three independent experiments (Student’s t test;"p < 0.05, versus without RANKL group). (B) Localization of PI-3,4,5-P
3, and the actin structure in
AktPH-GFP transgenic osteoclasts. AktPH-GFP signals indicated that the localization of PI-3,4,5-P3(left), and the actin structure had been visualized (middle). (C)
Localization of PI-3,4,5-P3(left) and LAMP2 (middle) in AktPH-GFP transgenic osteoclasts. (D) Expression level of Pik3ca, Pik3cb, Pik3cg, and Pik3cd encoding
the catalytic subunits of class I PI3K, p110a, p110b, p110g, and p110d during osteoclast differentiation. (E) Expression level of Pik3r1, Pik3r2, and Pik3r3, encoding the regulatory subunits of class IA PI3K, p85a, p85b, and p55g during osteoclast differentiation. (F) The level of PI-3,4,5-P3in osteoclasts after
stimulation with M-CSF. Osteoclasts were treated with (red) or without (blue) 100 ng/mL M-CSF for 0, 5, 15, 30, and 60 minutes. Data are represented as mean! SEM of three independent experiments (Student’s t test;"p < 0.05 versus without M-SCF group). (G) Localization of PI-3,4,5-P
3, and the actin
structure in osteoclasts stimulated with 100 ng/mL M-CSF for 0 and 5 minutes.
Journal of Bone and Mineral Research CLASS IA PI3K IN BONE RESORPTION THROUGH AKT-MEDIATED TRANSPORT 2467
JBMR, 2012
by binding to the catalytic site in its kinase domain[28], and exhibited Btk inhibitory activity along with Tec inhibitory activity[29]. However, since LFM-A13 is not orally available and has high cell toxicity, its usage has been limited to in vitro experiments. The in vitro osteoclast differen-tiation was significantly suppressed, with an IC50of approximately
30 μM, and was completely blocked at 100 μM. In contrast, we observed that ibrutinib completely inhibited the in vitro osteoclast differentiation at 1 nM. Furthermore, ibrutinib has an advantage over LFM-A13 in terms of toxicity. The mice treated with LFM-A13 at the effective dose often were debilitated and subsequently died (data not shown), but such adverse events were not observed in the mice treated with ibrutinib. Since LFM-A13 inhibits not only Tec kinases but also Janus ki-nases (JAKs)[30]and Polo-like kinases (PLKs)[31], which might be the reason for the unexpected side effects in mice. In contrast, ibrutinib treatment did not affect serum levels of a variety of components determined by blood chemistry tests in a various mouse model[14], and there was no effect of ibrutinib on liver and renal functions even in humans[32–34], suggesting that ibrutinib has no severe side effects. Collectively, the usage of ibrutinib in the clinical treatment of osteoclast-associated bone diseases warrants further investigation.
The master transcription factor NFATc1 is essential for the expres-sion of osteoclast-related genes [4]. The initial induction of this transcription factor is largely dependent on Fos and NFκB, which are ac-tivated by RANKL stimulation in the early phase of osteoclast differenti-ation, and subsequently activated through dephosphorylation by calcineurin, a protein phosphatase regulated by calcium signaling[9].
The promoter region in the Nfatc1 gene contains NFAT-binding se-quences as well as the Fos- and NFκB-binding sites, which enable the autoamplification of NFATc1 in order to maintain the high expression level that is required during the course of osteoclastogenesis[35]. Con-comitant with the autoamplification of NFATc1, it has been shown that NFATc1 also activates the gene expression of various molecules associ-ated with osteoclast differentiation and function, such as TRAP, OSCAR, cathepsin K, the chloride channel and the proton pump sub-units. The data show that calcium oscillation and NFATc1 expression were significantly suppressed in the cells treated with ibrutinib, resulting in the inhibition of the osteoclast differentiation through the down-regulation of a wide range of NFATc1 targets.
Our results also suggest that Btk regulates gene expression indepen-dently of NFATc1 in osteoclasts. Src is eviindepen-dently essential for osteoclastic bone resorption, because mice deficient in Src exhibit severe osteopetrosis due to a lack of the bone-resorbing activity of osteoclasts
[24]. However, the mechanism of Src expression in osteoclasts has long been largely unknown. Our data indicate that Src expression was not suppressed in NFATc1-deficient cells. In addition, the expression of Ptk2, Ptk2b and Tln1, was also expressed in NFATc1-deficient cells (Fig. S1), suggesting that the expression of these genes is independent of NFATc1 but dependent on Btk. In contrast, it is well known that ex-pression of CtsK and Acp5 is under the control of NFATc1[9,36]. Since ibrutinib inhibited expression of both NFATc1-dependent (CtsK and Acp5) and -independent (Src, Ptk2, Ptk2b and Tln1) genes, Btk regulates the gene expression in the NFATc1-dependent and -independent
A
B
C
D
0 20 40 60 80 100Atp6v1h Clcn7 Ppargc1b Nfkb2 Tcirg1
Src Slc4a2 Itgb3 Plekhm1 Fosl2 Ctsk Acp5 Mmp9 Ocstamp 0 20 40 60 80 100 0 0.1 1 10 100 (nM) Nfatc1
E
0 0.2 0.4 0.6 0.8 1 0 50 100 150 200 250 0 0.2 0.4 0.6 0.8 1 0 50 100 150 200 250 0 20 40 60 80 100 0 0.1 1 10 100 (nM) Acp5 0 20 40 60 80 100 0 0.1 1 10 100 Ctsk (nM) (sec) (sec) pY-PLC 1 PLC 1 pY-PLC 2 PLC 2 Ibrutinib (nM) 0 1 10 100 [Ca 2+] i%Max ratio increase
Relative expression level (%) Relative expression level (%) Relative expression level (%)
Relative expression level (%)
n.s. 0 2.54 1.73 1.52 0.89 1 1.83 1.51 1.41 1.08 1 pY-PLC 1/PLC 1 pY-PLC 2/PLC 2 RANKL + control Ibrutinib
Fig. 2. Ibrutinib suppresses the expression of osteoclast-related genes. A, Tyrosine phosphorylation of PLCγ after RANKL stimulation of osteoclast precursor cells. B, Intracellular Ca2+
concentration in the control (left) and ibrutinib (10 nM)-treated (right) BMMs 2 days after stimulation with RANKL. C, Expression level of Nfatc1 in ibrutinib-treated BMMs 3 days after RANKL stimulation. D, Expression level of Acp5 (left) and Ctsk (right) in ibrutinib-treated BMMs 3 days after RANKL stimulation. E, Expression profile of the osteoclast-related genes in the ibrutinib-treated BMMs 3 days after RANKL stimulation. determined by GeneChip analysis. The relative expression level in the ibrutinib-treated cells compared with untreated cells is shown.
12 M. Shinohara et al. / Bone 60 (2014) 8–15
Bone, 2014
RANKL
RANK
TRAF6
[Ca
2+]
iactivation
transcriptional regulation
MAPK
IKK
Jun
NFkB
Fos
ITAM
Syk
PLCg
NFATc1
Btk/Tec
b-cat
TAK1
IKKb, and Akt, all of which are activated downstream of TRAF6
(
Wong et al., 1999
) (
Figure 4
D). These results indicate that
RANKL-activated Btk and Tec are selectively involved in the
phosphorylation of PLCg, and a defect in calcium signaling
causes the impaired NFATc1 induction in Tec
!/!Btk
!/!cells.
Thus, Btk and Tec link the RANK signal to calcium signaling in
the osteoclast lineage.
Tec Kinases Form an Osteoclastogenic
Signaling Complex with Scaffold Proteins
Since PLCg activation is known to be dependent on the ITAM
signal, another question arises as to how PLCg activation is
reg-ulated by both RANK and ITAM signals. The ITAM-associated
gene network indicates that ITAM associates with Syk, which
associates with and phosphorylates scaffold proteins such as
BLNK (
Ishiai et al., 1999
). Because BLNK associates with Btk
in a phosphorylation-dependent manner in B cells (
Hashimoto
et al., 1999
), we examined whether RANKL-activated Btk is
re-cruited to BLNK in BMMs. The colocalization of Btk and BLNK
was increased, at what appeared to be the plasma membrane,
after RANKL stimulation (
Figure 5
A and
Figure S3
). This
translo-cation was not observed in DAP12
!/!FcRg
!/!cells (
Figure 5
A
and
Figure S3
), suggesting that the ITAM signals are also
re-quired for the formation of the Btk-BLNK complex. Consistent
with this, immunoblot analysis showed that Btk
coimmunopreci-pitated with BLNK in BMMs in the presence of RANKL, but
Figure 4. Tec Kinases Mediate Osteoclastogenic Signaling Pathway
(A) Dynamic protein-protein interaction network in osteoclast differentiation. Proteins connected with a black line are interacting partners, and the color indicates how many fold mRNA expression was increased 24 hr after RANKL stimulation.
(B) RANKL-induced PLCg1 and PLCg2 phosphorylation in WT and Tec!/!Btk!/!BMMs.
(C) Oscillatory change in the intracellular Ca2+concentration in WT and Tec!/!Btk!/!BMMs after RANKL stimulation. The addition of 10 mM ionomycin at the end
of each experiment is indicated by an arrow. Each color indicates a different cell in the same field. (D) RANKL-induced ERK, JNK, p38, Akt, and IKK phosphorylation in WT and Tec!/!Btk!/!BMMs.